


Servicios Personalizados
Articulo
 Inglés (pdf)
 Articulo en XML
 Referencias del artículo
Indicadores

Links relacionados
-
 Citado por Google
 -
 Similares en Google
Compartir

 Permalink
South African Journal of Economic and Management Sciences
versión On-line ISSN 2222-3436
versión impresa ISSN 1015-8812
S. Afr. j. econ. manag. sci. vol.19 no.3 Pretoria 2016
http://dx.doi.org/10.17159/2222-3436/2016/v19n3a10
ARTICLES
The quest for process operations variability reduction in manufacturing firms in South Africa
Madi KatombeI; Elias MunapoII
IGraduate School of Business and Leadership, University of KwaZulu-Natal
IISchool of Economics and Decision Sciences, North West University
ABSTRACT
In an era characterised by a volatile economy, intense competition, and rising energy and material costs, improving operational efficiency has become a necessity for margin purposes and long-term business success. This research study attempts to develop a model for process operations variability reduction that integrates the fundamental drivers, the intermediate measures and the four traditional competitive capabilities: quality, cost, delivery reliability and speed of delivery. In addition, it highlights the precise mechanisms in plants that lead to multiple competitive capabilities development. The concept of a routine-based approach to capabilities development provides a nexus between the earlier actions by the organisation and competitive advantage. Using longitudinal data from the Manufacturing Circle of South Africa, a statistical analysis was conducted to support the model, and path analysis models were developed which confirmed that the performance frontier is really a surface that spans many different dimensions. It is observed that the model clearly outlines pathways to process operations variability reduction through better execution of the routines concerned with maintaining the performance by current processes, improving existing processes, and transforming or changing to new processes.
Key words: manufacturing, firms, competitive capability, process management, longitudinal data analysis
JEL: M11, C32
1 Introduction
Today's process manufacturers are faced with a volatile economy, intense competition and rising energy and material costs. Improving operational efficiency has become a necessity for margin purposes and long-term business success (Bates, Kimberley, Flynn & Flynn, 2009; Chang & Park, 2012). Several analysts' reports and surveys in recent times have identified operational costs reduction, process operations variability reduction, and competition from low-cost sources as the top three key pressures for process manufacturers (Fonzi & Shah, 2008; Chen & Miller, 2012).
With the critical need to reduce costs, process manufacturers could turn to operations to address the additional significant pressure, which is the need to reduce the variability of process operations. The business environment confronts operations managers with changing operating conditions and complex internal challenges that cause variations throughout the operational chain (Bozarth, Warsing, Flynn & Flynn, 2009). Such process operations variability, regardless whether they result from the organisational strategy, predictable suppliers or customers' behaviour, or from unforeseeable events that are beyond immediate control, negatively affect the performance capabilities of firms in aspects such as quality, cost efficiency, speed of delivery and delivery reliability (Hopp & Spearman, 2001).
Klassen and Menor (2007) studied trade-offs between inventory, manufacturing firm capacity, and operations variability, and suggested that further study where integrative conceptual models, such as competitive capability models, could be better informed by using a different approach to process operations' variability. However, researchers who developed capability models have conducted a relatively limited number of studies on the mechanisms of performance factors. Much of the existing work in this field used cross-sectional data and focused on the interactions between the competitive capabilities (Mapes, Szwejczevski & New, 2000; Sarmiento, Sarkis & Byrne, 2008). Other researchers have focused on performance drivers at the manufacturing firm level. The current research study attempts to correct this deficiency.
Mapes et al. (2000) in their study of "Process variability and its effect on plant performance", developed the mechanisms between performance drivers and performance capabilities, using cross-sectional data. The purpose of this study is, therefore, to examine the fundamentals drivers and the performance capabilities, as well as the mechanisms within manufacturing firms that would lead to multiple competitive capabilities using longitudinal data. This was in order to develop a model for process operations variability reduction so that recommendations may be made to management to ensure improvement in operational efficiency. This was done by using the longitudinal data of 54 manufacturing firms in South Africa. The validity of this model was tested statistically.
2 Literature review
2.1 Background
The concept of capabilities in operations management refers to a business unit's anticipated or realised competitive performance or operational strengths (Boyer & Lewis, 2002; Flynn & Flynn, (2004) and are therefore evaluated using operational performance, which often takes account of quality, cost, delivery reliability, speed of delivery, and flexibility, as discussed by Tsang, Dultra-de-Lima, Csillag and Oyodomani (2015). Swink and Hegarty (1998) point out that the concept of capabilities in operations management which has a performance-based approach is conceptually too aggregated to visibly provide clear direction for the proper use of manufacturing resources.
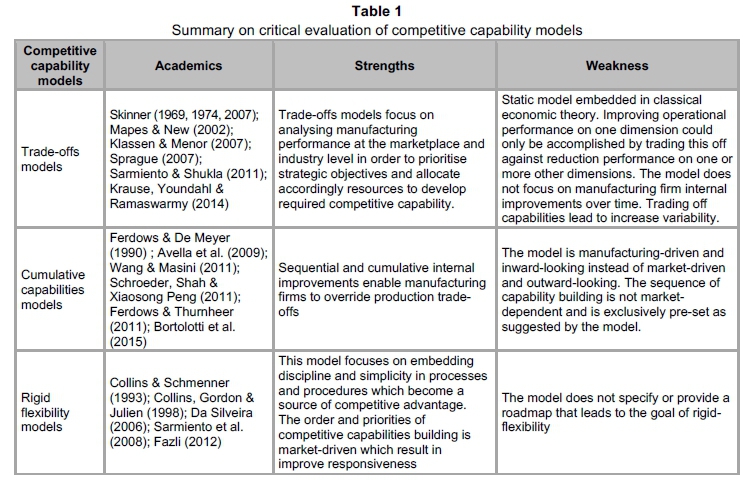
One of the most fundamental areas for operations managers wishing to improve performance is an in-depth understanding of the interactions that exist between different measures of operational performance. There has been an ongoing debate on the relationship among competitive capabilities. This debate has been evolving amid three schools of thought: trade-off, cumulative capabilities and rigid flexibility models. The findings on the critical evaluation of competitive capability models are summarised in Table 1.
The main schools of thought on the competitive capabilities models described above provide a range of contending views on how manufacturing firms can accomplish improved performance that results in the development of competitive advantage. However, the traditional competitive advantage approaches are oriented to competitive capability sequential and/or interactional development.
The tidal wave analogy presented by Corbett and Van Wassenhove (1991) suggests that there is a dynamic hierarchy in the traditional competitive priorities and necessities, beyond which human resources are the only source of competitive advantage. Schroeder et al. (2011) tested the actual sequence of the sand-cone theory, and suggested a contingency theory, as they did not find universal support. Flynn and Flynn (2004), using cross sectional data, found that there is environmental contingency in the pattern of cumulative competitive capabilities, which is closely associated with country and industry differences. Da Silveira and Slack (2001) assess the managers' perceptions of the existence and importance of trade-offs. They point out that trade-off is an easily understood theory which describes the operating compromises usually made by operations managers. They conclude that the implication of specific trade-offs within any process operations is expected to be governed by two factors, which are the importance and the sensitivity of the trade-off.
Deriving useful principles of operations management that are managerially practicable remains a challenge, because operations managers are confronted with a complex set of operational issues and challenges that dictate trade-offs (Klassen & Menor, 2007); internal and external sources of process operations variability related to these operational matters further complicate the operations manager's mandate. While Da Silveira and Slack's (2001) study reveals the perceptions and practice of operations managers regarding trade-off, it also highlights their attitudes to process operations variability reduction. Trading-off competitive capabilities will result only in an increase in operations variability; in turn, this will decrease manufacturing firms' performance efficiency.
Schmenner and Swink (1998) propose a concept that takes account of both the trade-offs and the cumulative competitive capabilities laws: the performance frontier (Stevenson & Hojati, 2007; Cai & Yang, 2014). Performance frontiers are created depending on the choices in manufacturing firm design and investment (asset frontier), and the choices in process operations (operating frontier). The manufacturing firm's performance is bounded subsequently by the operating frontier and its asset frontier. Similarly, it could be argued that the competitive capabilities, such as delivery reliability, the speed of delivery, cost, and quality, are immediately bounded by the operating frontier, and are subject to process operations variability. Moreover, in line with operations variability, it could be argued that the dimensions of the business environment, such as munificence, which describes the level of resources scarcity, and dynamism, which refers to unpredictable changes in the business environment, affect the operating frontiers (Bourgeois, 1980; Ward et al., 1995; Cai & Yang, 2014).
2.2 Performance drivers' mechanisms
Many researchers report that a shorter throughput time is the most critical driver, being closely associated with with high-quality consistency, productivity, speed of delivery and delivery reliability. Schmenner and Swink (1988) maintain that, although a short throughput time does not improve productivity by itself, it creates a synergy of complementary actions and tactics within the manufacturing firm, which results in productivity improvement. Cambitsis (2012) concurs by considering downtimes that occur as consequences of the downstream and upstream starvation and choking effects of each activity. According to Plossl (1991), all the benefits are directly in proportion to the speed of flow of materials and information within the process operations. Mapes et al. (2000) mention that low throughput times and high stock turns are intermediate measures. However, they are a major source of competitive capability; they are themselves the outcome of earlier actions by the organisation (Hall, 1987; Ohno, 1988).
It could be argued that process operations variability should be reduced depending on the earlier actions by the organisation. These earlier actions will result in low inventory and shorter throughput times in the high-performing manufacturing firms. This will, in turn, result in a fast speed of delivery, high delivery reliability, greater quality consistency and high productivity.
Based on the above, it could be argued that the fundamental drivers that lead to concurrent improvements in cost, speed of delivery, delivery reliability and quality consistency are all aspects of the reduction of process operations variability and uncertainty within the operational system. The fundamental drivers of any improvement are core skills or competencies, which lead to an increased adherence to schedule, the increased reliability of supplier deliveries, reduced process output variability, and reduced process time variability (Porter, 1980; Hayes & Wheelwright, 1984; Collins & Schmenner, 2005).
2.2.1 Increased adherence to schedule
The less uncertainty there is regarding future customer prospects, availability of materials and machineries processing times in the production line, the easier it is for manufacturing firms to follow the predetermined schedule. Uncertainty about future demand prospects and a rolling horizon trigger volatility. Glock et al. (2014) claim that volatility leads to nervousness in the process operations through the cancellation of existing setups, the introduction of new setups, and alteration of the production volumes. Kazan, Nagi and Rump, (2000) and Beck, Grosse and Tebmann (2015) argue that the main adverse effects of unplanned changes to the manufacturing schedule are an increase in the throughput times and the work-in-progress stocks. The outcome is higher costs, slower speed of delivery and poor delivery reliability. Armistead and Mapes (1993) find that the key factor in high operating efficiency and customer service is the integration of supply/customer by means of sharing production schedules in order to reduce uncertainty and increase the degree of adherence to the planned schedule.
Rivera-Gómez, Ghabi and Kenné. (2013) and Kazaz and Sloan (2013) argue that the adherence to schedule can also be affected by the association of equipment reliability and quality challenges. Since maintenance ineffectiveness results in the escalation of downtime and overtime costs, poor quality, excessive change over time, unreliability of production machinery, as argued by Onawoga and Akinyemi (2010); Salonen and Deleryd (2011) are convinced that maintenance management activities should be viewed in a similar light to quality management activities and that the cost of poor maintenance should be treated like the cost of poor quality. Farrero et al. (2002) and Prajapati, Bechtel & Ganasan (2012) claim that the proper integration of the maintenance approaches mitigates the risk of sub-optimality and premature equipment failure.
2.2.2 Increased reliability of supplier deliveries
Ambulkar et al. (2015) and Knemeyer et al. (2009) maintain that, in today's turbulent and uncertain business environment, manufacturing firms are subject to disruptive events which trigger a disturbance in the flow of goods or services (Craighead et al., 2007). Wright (2013) states that robustness to supply chain disruptions is considered to be a key priority in this ever-changing business environment. Having material on hand or inventory means carrying costs composed of the cost of capital, stores, personnel salaries, facilities, field delivery, obsolescence of inventory, information systems, utilities, insurance, security, and so on (Wagner & Bode, 2008; Narasimhan & Talluri, 2009).
Xinlin, Tang and Rai-Arun (2014), Vanpoucke, Vereeckeb and Wetzels (2014), and Mapes et al. (2000) suggest that manufacturing firms should develop customer-suppliers relationships so that suppliers could provide on-time delivery. The result of on-time delivery would be not only the reduction of the throughput time and an increase in delivery reliability, but also a reduction in the amount of inventory that should be held. Danesen (2013) points out that supplier integration and fast supply network structure practices have provided significantly positive effects on the manufacturing firms' performance measures like efficiency, schedule compliance and flexibility. Wonga, Sakun and Wong, (2011) emphasise that competitive capabilities, such as delivery and flexibility, are extremely sensitive to uncertainty from the external environment and, as a result, could be improved by external integration. In the same way, competitive capabilities, such as quality and cost, are more internally dependent, and could therefore be improved through internal integration (Ragatz, Handfield & Peterson, 2002; Droge, Jayaram & Vickery, 2004; Danesen, 2013; Euehun, Semi, Hye & Rho, 2013).
2.2.3 Reduced process time variability
Hopp and Spearman (2001) claim that process time variability derives from either controllable or random processing time variation. The end result of processing time variation, irrespective of its type, is that it increases the throughput time (Johnson, 2003). Mapes et al. (2000) argue that the greater the process time variability of each production step the more complex is the task of coordinating these steps. The common practice used by operations managers in dealing with process time variability is to introduce work-in-progress buffers between the steps, diversifying the overall system, or creating a rapidly reconfigurable or responsive system, as stated by Fonzi and Shah (2008). The shortfall of the buffering practice is that it increases the throughput time, as the process time variability remains unchanged. The consequential effect is an increase in cost, customer lead times and a reduction in delivery reliability.
Koufteros, Vonderembse and Doll (1997) argue that time-based manufacturing comprises organizational level practices that compel shop-floor worker participation in problem-solving in order to reduce throughput time. Other researchers point out that employee involvement drives improvement efforts (Krishnamoorthi, 2006; Heizer & Render, 2008; Stephen, Rungtsusanatham, Zhao and Lee (2015). Improved workforce problem-solving skills facilitate the re-engineering of setups and the establishment of culture of quality conformance improvement (Su et al., 2014) and the implementation of effective preventive maintenance strategy as discussed by Sharma and Yadava (2011), Salonen and Bengtsson (2011) and Prajapati et al. (2012). Hafner (1991) and Wua-Kan and McGinnis (2012) conclude that the reduction of the standard deviation of the processing and inter-arrival times has a similar effect on throughput times, which results in an increase in manufacturing capacity.
2.2.4 Reduced process output variability
Mapes et al. (2000) state that, the lower the variability in the output at each manufacturing step, the higher the percentage of adherence to quality conformance, and the lower the reject rate. The overall effect is an improvement in throughput rates, cost and delivery reliability. Researchers have studied the relationship between several quality practices and quality performance. Their results show that quality practices, such as leadership, support, workforce involvement, process management, and cross-functional product development, have a beneficial outcome on quality performance (Flynn, Schroeder & Flynn, 1999; Dow, Samson & Ford, 1999; Ward & Duray, 2000; Su et al., 2014). Zhang, Linderman and Schroeder (2012), and D'Aveni, Dagnino and Smith (2010) argue that two general forms of learning processes are frequently debated in line with quality management: Firstorder and second-order learning. First-order learning consists of augmenting existing know-how in order to be able to proactively detect and correct quality defects. It is described as refinement, effectiveness, improvement and exploitation. In contrast, second-order learning implies search, experimentation, innovation and exploration. Total quality control relates to first-order learning, whereas total quality learning relates to second-order learning. Employee involvement and improved workforce problem-solving skills enable the establishment of a culture of quality conformance improvement (Deming, 1982). It can be argued that the quest for process operations variability is directly related to first-order and second-order learning, which trigger a reduction in process output variability.
2.2.5 Linking routines to capabilities in operations management
The common pointer to the achievement of the key performance drivers is the core skills or competencies, which are intangible resources. Mascarenhas, Baveja and Jami (1998) and Arrighettia, Landinib and Lasagnia (2014) maintain that core competencies include technical subject matter know-how, reliable process operations, supplier/customer integration, product development or culture, employee dedication, and best Human Resource Management. Hayes and Wheelwright (1984) and Clark (1996) argue that higher performance is eventually established depending on the people in an organisation (Lin & Wu, 2013; Kumlu-Ömer, 2014). The correct management principles, organisational systems and structures, and procedures are important (Persaud, 2005). However, the capabilities that generate competitive advantage derive from people: their skills, discipline, motivation, ability to resolve problems and their capacity for learning.
The impact of routines for developing process operations-based competitive advantage has been highlighted in the discipline of operations management. Winter (2003) and Rerup and Feldman (2011) indicate that routines are generally described as regular and predictable patterns of behaviours, or, more specifically, the way work is done. Xiaosong-Peng, Schroeder and Rachna (2008) state that routines and performance capabilities are embedded in the synergy of multiple knowledge sources and are more firm-specific and less transferable, thus leading to competitive advantage. Clark (1996) notes that ,in several cases, competitive advantage in process operations is developed through better execution of similar routines. Grant (1991) observes that the repertoire of routines provides a means for manufacturing firms to implement their value-creation strategy, and, as a result, is critical to performance capability improvement.
Competitive capabilities are defined in operations management as bundles of interrelated, yet distinct routines (Prahalad & Hamel, 1990; Stalk, Evans & Shulman, 1992; Hult, Snow & Kandemir, 2003; Xiaosong et al., 2008). This routine-based approach to capabilities allows the untangling of capabilities into specific and identifiable routines, and thus accurately generates probable pathways to capability development (Foss, Heimeriks, Winter & Zollo, 2012). A number of operations management researchers claim that, while competitive capabilities at the manufacturing firm level are defined as cost, quality, delivery reliability, and speed of delivery, operations-level capabilities should refer to routines (Ghosh, 2001; Schroeder et al., 2002). Capabilities building is linked mainly to the influence on organisational routines at the individual, organisational and network levels, which include customer/supplier integration and competitors (Capaldo, 2007; Newey & Zahra, 2009; Lisboa, Skarmeas & Lages, 2011; Capaldo & Messeni, 2011).
Stephen et al. (2015) point out that process management consists of three dimensions, which are process control, incremental process improvement and radical process improvement. Process control is an organisational capability established in bundles of routines and practices that aim to exploit existing processes by stabilising process performance to meet the required specifications, as discussed by Howard-Grenville and Parmigiani (2011). Incremental process improvement is an organisational capability established through a set of routines and practices aiming to exploit existing process by enhancing their performances continuously at a gentle pace and on a small scale. Krishnamoorthi (2006) and Heizer and Render (2008) maintain that process control prevents the production of defective units by detecting and stopping undesirable variations, thereby creating stable and predictable processes. According to Benner and Tushman (2002), incremental process improvement focuses on improving existing processes by eliminating non-value-added activities and reducing common variations. Radical process improvement is characterised by a fundamental rethinking and redesign of processes to obtain a drastic improvement in various dimensions of organisational performance. It consists of challenging the status quo and building new processes with a new resource base (Peng et al., 2008; Chang Yuan-Chich, Chang, Ru, Huei & Deng, 2012; Young, Kumar & Kumar, 2013; Lim-Chaisung, Han & Ito, 2013).
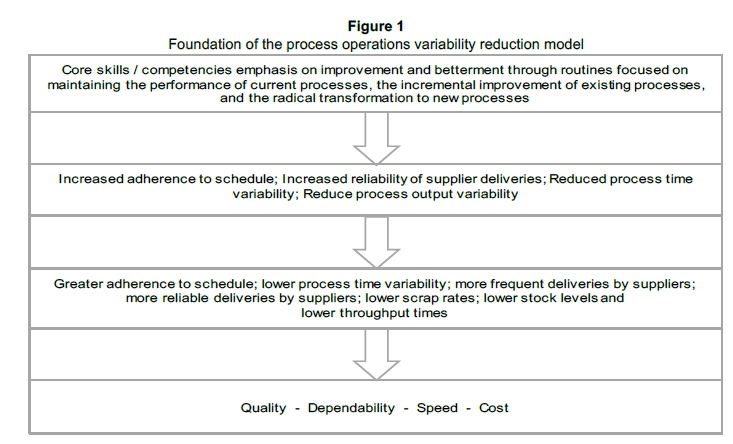
2.2.6 Foundation of the process operations variability reduction model
While the analysis in Section 2.2 of performance drivers is in no way complete, it does allow for the identification of some general patterns. Figure 1 summarises the general patterns identified in the analysis of manufacturing performance drivers, which then provide the basis of the model this research study intended to develop.
Process operations variability reduction theory matters because it not only reflects the practice of the industry, but also helps to constitute the practice. One of the ways in which it does this is by favouring the practices of continuous improvement and betterment. In line with the above, the researcher takes the view that process operations variability reduction is influenced by social systems made up of people, their aspirations, know-how or expertise, work practices, frustrations, and egos.
3 The proposed model
A model for process operations variability reduction, which is the ultimate goal of this research study, must address the core problems that have continually led to operations variability in most South African manufacturing firms. It has been said that the conceptual model for process operations variability reduction to be developed must be a generic process operations model that can be used by various process operations. The reason for this is that the model should be driven by the requirements of the manufacturing firms, which are determined first by the requirements of the South African business environment'. In other words, to what extent are the competitive capabilities of South African manufacturing firms able to meet the demands of the business environment?
The research has identified three classes of performance drivers/factors that influence and contribute to the development of the process operations variability reduction model. The first two classes of factors together affect the competitive capabilities. In other words, by considering these three classes of performance drivers/factors in the design and implementation of process operations variability reduction, it can be expected to consistently reduce operations variability and continuously improve performance capabilities. The three classes of factors are: fundamentals drivers, intermediate measures and competitive capabilities.
The two categories of beneficial movement within the performance space are improvement and betterment, as discussed by Schmenner and Swink (1998), and Cai and Yang (2014). Improvement takes a firm to its operating frontier. By contrast, betterment alters manufacturing operating policies in ways that move the operating frontier forward to the asset frontier. The fundamental drivers of improvement or betterment are the core skills or competencies that lead to more adherence to schedule, increased reliability of supplier deliveries, reduced process output variability, and reduced process time variability (Porter, 1980; Hayes & Wheelwright, 1984; Collins & Schmenner, 2005).
These earlier actions by the organisation, which derive from skills or competencies, are expected to relate to the establishment of operating systems that are considerably more stable and reliable.
Within the operations of manufacturing firms, all the benefits are in direct proportion to the speed of flow of materials and information - which implies that short throughput times and high stock turns are intermediate measures (Plossl, 1991). Faster throughput times and lower stock levels lead to improvements in the external performance, but they derive from earlier actions by the organisation, which are embedded in the core skills or competencies (Carmeli, 2004; Smith, 2008; Lin & Wu, 2013; Kumlu-Ömer, 2014). A manufacturing system operations variability is buffered by the integration of inventory, capacity and time. The intermediate measures highlight any buffering tendency.
Process operations variability will therefore be reduced, depending on the earlier actions by the organisation, which will lead to low inventory and faster throughput times in the high-performing manufacturing firms (Mapes et al, 2000). This subsequently leads to a faster speed of delivery, more reliable delivery, higher quality consistency and lower costs. In other words, the fundamental drivers that lead to concurrent improvements in cost, speed of delivery, delivery reliability and quality consistency are all aspects of reduced process operations variability and uncertainty in the operating system.
The requirements of the conceptual model discussed above provide a framework for the conceptual model and reflect a particular set of performance factors that, in combination, will achieve the stated objectives of operations variability reduction in the manufacturing firms.
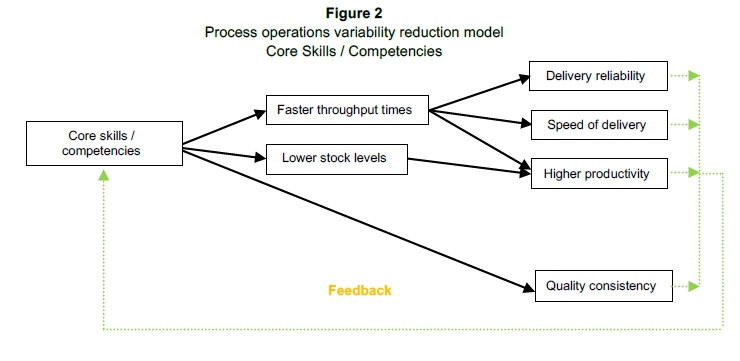
The proposed process operations variability reduction model shown in Figure 2 provides an appropriate description of a model for building multiple competitive capabilities through process operations variability reduction. This model not only provides increased visibility for performance factors, but also untangles the complex relationship between performance factors. As stated earlier, there are three classes of factors of importance in examining the model:
• Fundamentals drivers.
• Intermediate measures.
• Competitive capabilities.
The key factors are to consider the input elements of each imperative that makes up the operations variability reduction. The input elements depicted in Figure 2 should always be appropriate to the specific imperative requirements in question - in terms of process operations variability reduction. The model for process operations variability reduction integrates fundamentals drivers' imperatives, intermediate measures imperatives and competitive capabilities imperatives. The theoretical cooperation proposition leads to the development of the process operations variability reduction model shown in Figure 2.
The proposed model suggests that an improvement in core skills / competencies will result in an improvement in throughput, inventory, and quality. Subsequently, faster throughput times and lower stock levels will result in an improvement in delivery reliability, productivity and the speed of delivery. The feedback loop provides an opportunity for the critical review of a manufacturing firm's performance, particularly by exploring continual improvement as bundles of routines which enable an organisation to improve its capabilities.
4 Research methodology
The empirical statistical support will be conducted using the Manufacturing Circle Survey, which is compiled by Pan-African Investment and Research Services in the best interests of the Manufacturing Circle. The quarterly survey aims to capture economic and business conditions in the South African manufacturing industry.
The Manufacturing Circle database includes 54 different manufacturing firms drawn from different industrial categories. They vary from small to large South African manufacturing firms. The empirical data used to assess the relationship of each pair of performance measures were collected from the Manufacturing Circle quarterly survey for the past four years (2010 to 2014). The respondents represent different industries which cover all the manufacturing sectors.
The research study will use the quarterly data for the past four years, as it is intentionally a longitudinal study. Longitudinal studies observe individual over a period of time in order to study the relationship between variables to determine the cause and effect relationship and assess the observable antecedents and precedents. Longitudinal data present information on what happened to fundamentals drivers, intermediate measures, and competitive capability during a series of time periods.
In order to explore the relationship between core skills or competencies, throughput, stock levels, delivery reliability, speed of delivery, productivity and quality consistency, the 2010 to 2014 quarterly survey database of the Manufacturing Circle was used. The actual performance measures used were: status of skills availability in the industry, throughput or level/volume of general business output (non-monetary measures), inventory or level/volume of overall purchased stock of materials and goods used in the normal business or activities (non-monetary measures), supplier delivery or overall delivery performance versus that of the previous month of suppliers of materials, goods and services purchased, speed of delivery or the difference between new sales orders and the backlog of sales orders, and the level of labour productivity over the quarter. Unfortunately the database has no measures relating to quality. Quality will be discussed, according to previous research findings. The measurements of manufacturing firms' performance took place multiple times. A total of seventeen observations are used in the empirical analyses. Path analysis is used to provide support for the proposed model (Akintunde, 2012).
5 Analysis of the results
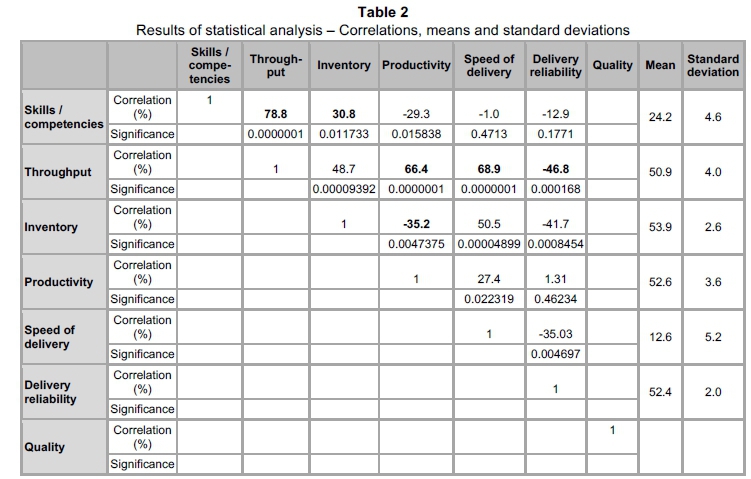
The results of the statistical analysis are summarised in Table 2. The Cronbach's alpha was computed and provided a result of 0.87, which indicates a good reliability or internal consistency of the test. The results show that nearly all of the pairs of performance measure have correlation coefficients or strength of a relationship between variables of 30 per cent or better; and which are significant at the 0.05 level or better. Each pair of variables shows a statistically significant correlation. The extent to which these results support the proposed conceptual model is discussed below.
5.1 Fundamentals drivers - intermediate measures
Substantial statistical support was provided for the relationship between the fundamental drivers and the intermediate measures. The statistical correlation coefficient is 78.8 per cent and is significant at the 0.0000001 level for the relationship between skills and throughput. The correlation coefficient between skills and inventory is 30.8 per cent and is significant at the 0.011733 level. Core skills/competencies are required to achieve faster throughput times and lower stock levels.
While the correlation between skills/competencies and inventory is statistically significant, the level of significance is lower than for the other pairs of variables. This is rather surprising and requires further investigation. However, it could be argued that a different set of skills is required to improve throughput times and lower stock levels. Figure 3 shows the status of skills availability in the manufacturing industry. The scarcity of skills remains a stumbling block for the manufacturing industry to the extent that 76.8 per cent of the respondents believed that skills availability in the manufacturing industry was either poor or less than adequate. It is worth mentioning that some manufacturing firms introduced internal training programmes to address the matter of skills scarcity. The relatively low correlation coefficient between skills/competencies and inventory indicates that manufacturing firms operate with high levels of inventory to protect themselves from uncertainty from the external/internal environment. This corroborates to the findings that show that supplier reliability decreases as throughput increases.
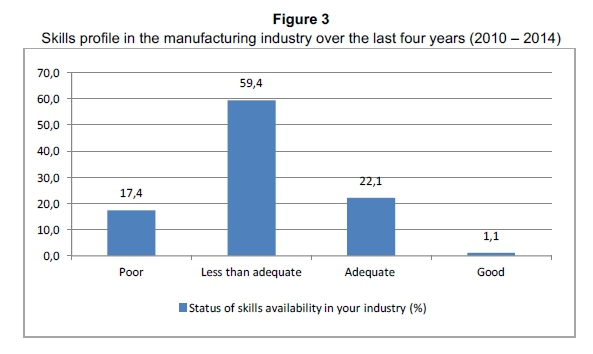
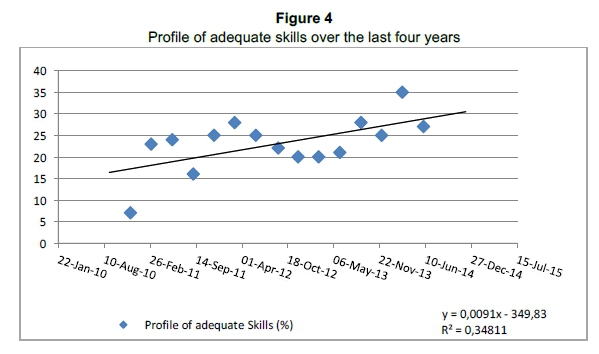
Figure 4 shows the profile of adequate skills over the last four years (2010 - 2014). R-squared is 34.81 per cent, which indicates that the regression line explains a small but reliable percentage of the variability of the response data around its mean. The linear regression line depicts a relatively weak uphill trend, suggesting that there are some skills improvements.
The proposed model showed that specific routine tasks should be integrated into the quest for improvement and betterment; which will lead to increased adherence to the schedule, increased reliability of supplier deliveries, reduced process output variability, and reduced process time variability. These routine tasks, which mean improvement and betterment, are an integral part of core skills or competencies, which are the cornerstone for the quest for process operations variability reduction.
First, in order to maintain their current performance, organisational capability established in bundle of routines and practices is required to exploit existing processes by stabilising process performance to meet required specifications. This will lead to the prevention of the manufacture of defective units by detecting and stopping undesirable variations, creating stable and predictable processes. It will also minimise any uncertainty caused by the external environment by integrating externally to maintain strategic partnerships, information-sharing and joint collaboration between customer and supplier.
Secondly, in order to incrementally improve organisations' current performance, organisational capability established through a set of routines and practices is required to exploit the existing process by continually enhancing their performance at a gentle pace and on a small scale. This would eliminate non-value added activities, reduce common variations through refining existing products, process technologies and operational practices on one hand; and enhance the aptitude of manufacturing firms to find best partners, initiate and develop relationships, and design governance policy for effective cooperation on the other hand.
Thirdly, in order to fundamentally rethink and redesign the processes, organisational capability established through a set of routines and practices is required to challenge the status quo and build new processes with a new resource base. This means obtaining drastic improvements in various dimensions of organisational performance. In order to achieve this, manufacturing firms will have to become involved in cooperative relationships with numerous external partners, including customers, suppliers, academic research and development institutions to integrate their value co-creation processes.
5.2 Intermediate measures - competitive capabilities
Statistical analysis provided substantial support for the relationship between throughput and delivery reliability, throughput and the speed of delivery, and throughput and productivity.
The relationship between throughput and supplier delivery reliability had a correlation coefficient of - 46.8 per cent, significant at the 0.000168 level. Throughput and supplier delivery reliability had a negative correlation coefficient, which indicates that supplier delivery reliability decreases as throughput increases. This implies that an increase in throughput triggers a supply chain disruption event which results in a disturbance of the flow of goods or services. Robustness to supply chain disruptions can be attained through customer/supplier integration and fast supply network structure practices. The outcome of customer/supplier integration is an in-depth understanding of market outlooks and opportunities, enabling on-time delivery to customer requests by matching supply with demand.
The relationship between throughput and the speed of delivery had a correlation coefficient of 68.9 per cent, significant at the 0.0000001 level. The results show that as throughput increases so does the speed. The speed of delivery is the dimension of flexibility which can enhance the capability of coping with volume fluctuations. Externally, the speed of delivery provides the advantage of being able to respond swiftly to customer orders. The internal effects of the speed of delivery are related more to the manufacturing cost reduction.
The relationship between throughput and productivity had a correlation coefficient of 66.4 per cent, significant at the 0.0000001 level. The results show that productivity increases with an increase in throughput. The model confirmed the findings of many researchers who report that faster throughput time is the most critical driver, which is closely associated with the high speed of delivery, productivity and delivery reliability.
The relationship between inventory and productivity had a correlation coefficient of -35.2 per cent, significant at the 0.0047375 level. The results show that, as inventory increases, productivity trends down. High inventory means carrying costs. Researchers have indicated that some manufacturing firms have a carrying cost as high as 61 per cent, and the costs of defective material are generally up to 30 per cent. It could be argued that manufacturing firms are required to adopt customer/suppliers integration and fast network structure practices to enhance on-time delivery and minimise inventory.
The uncertainty of future demand or supply prospects triggers volatility, which leads to the cancellation of existing setups, the introduction of new setups, the alteration of the production volumes, and an increase in inventory. This will result in an increase in the throughput times and work-in-progress stocks. The outcome is higher costs, a slower speed of delivery and poor delivery reliability. The less uncertainty there is regarding future customer demands, the availability of materials, and machineries processing reliability, the easier it is for manufacturing firms to follow a predetermined schedule.
The Manufacturing Circle database does not include parameters that can be related to quality. However, other researchers have suggested that skills improvement translates into an improvement in quality. Su et al. (2014) argue that, to sustain quality, manufacturing firms should focus first on meta-learning, which continually increases an organisation's ability to learn. Second, there should be a focus on sensing weak signals, which gives organisations the ability to detect subtle changes that could disrupt their quality performance. Third, there should be a resilience related to quality disruptions, which would help organisations to adapt quickly and recover from disruptions when they occur.
5.3 Path analysis
The correlation between the competitive capabilities will remain unanalysed, because we have chosen not to identify one variable as the cause of the other variable. Any correlation between these variables may actually be casual (one competitive capability causing another and/or inversely) and/or may be owing to (both competitive capabilities) sharing common causes. Similarly, the feedback loop will remain unanalysed, as it provides an opportunity for critical review of a manufacturing firm's performance by exploring continual improvement as bundle of routines to enable development of multiple competitive capabilities.
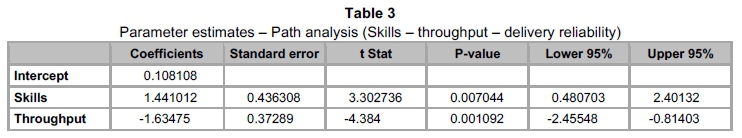
5.3.1 Skills - throughput - delivery reliability
The results of the regression analysis of skills - throughput - delivery reliability are presented in Table 3. R-square with all three variables is equal to 0.642 and the adjusted R-square is 0.577. The path analysis model showed some interesting results in terms of model fit: Chi-square is equal to 0.000, df is equal to 0, F is equal to 9.882567 and P-value is equal to 0.003494. As in the regression analysis, significant parameter estimates were observed: skills (P-value is equal to 0.007044) and throughput (P-value is equal to 0.001092).
5.3.2 Skills - throughput - speed of delivery
The results of the regression analysis of skills - throughput - speed of delivery are presented in Table 4. R-square, with all three variables, is equal to 0.654 and the adjusted R-square is 0.591. The path analysis model showed some interesting results in terms of model fit: Chi-square is equal to 0.000, df is equal to 0, F is equal to 10.42212 and P-value is equal to 0.002891. As in the regression analysis, significant parameter estimates were observed: skills (P-value is equal to 0.032983) and throughput (P-value is equal to 0.001677).
5.3.3 Skills - throughput - inventory - productivity
The results of the regression analysis of skills - throughput - inventory - productivity are presented in Table 5. R-square, with all four variables, is equal to 0.777 and the adjusted R-square is 0.710. The path analysis model showed some interesting results in terms of model fit: Chi-square is equal to 0.000, df is equal to 0, F is equal to 11.63602 and P-value is equal to 0.001337. As in the regression analysis, significant parameter estimates were observed: skills (P-value is equal 0.00181), throughput (P-value is equal to 0.000822) and inventory (P-value is equal to 0.001272).
Path analysis models showed that improvement in core skills/competencies will result in an improvement in throughput and inventory. Subsequently, faster throughput times and lower stock levels will result in an improvement in delivery reliability, productivity, and the speed of delivery.
6 Conclusion
A model has been developed which attempts to provide mechanisms for process operations variability reduction which link the different operational performance measures at the manufacturing firm level. Analysis of the Manufacturing Circle survey database provides a fair degree of support for this proposed conceptual model. Statistical analysis shows that all the pairs of performance measure, according to the proposed model, have significant correlations with each other.
Path analysis models not only untangle the incomprehensible and complex relationships between the performance factors, but also show that process operations variability reduction is a function of earlier actions (derived from core skills/competencies) by the organisation that will have a positive impact on delivery reliability, the speed of delivery, cost, and quality. This model clearly outlines mathematical pathways to process operations variability reduction mechanisms through better execution of routines concerned with maintaining the performance of the current processes, improving the existing processes, and transforming or changing to new processes in order to develop sustainable competitive advantage.
The path analysis models confirmed that the performance frontier is really a surface that spans many different dimensions, with each point representing different combinations of the various performance measures. Altering the shape of the frontier in one dimension possibly also changes its shape in other dimensions.
It should also be emphasised that the model presented here is essentially a dynamic one. It considers relationships between different performance measures according to longitudinal data; as performance improvement paths are time dependent.
7 Suggestions for further research
The Manufacturing Circle survey is compiled by Pan-African Investment and Research Services in order to capture economic and business conditions in the South African manufacturing industry. This research suggests that the survey should include the operating measure quality conformance. This would allow trending product quality and provide informed comment enabling future research to assess this competitive capability in the South African business environment.
The theory of performance frontier suggests that manufacturing firms that are under the operating frontier will be subject to multiple competitive capabilities development, while the firms that are close to or on the operating frontier will be subject to trade-off. It would be interesting to differentiate firms that are below the operating frontier and those close to or on the operating frontier and then statistically empirically test the proposed model.
Acknowledgements
The authors wish to express their gratitude to the Manufacturing Circle and more specifically to the Executive Director, Coenraad Bezuidenhout, for assisting with historical data.
The authors also acknowledge and thank all their reviewers for their careful reading and suggestions on improving this article.
References
AKINTUNDE, A.N. 2012. Path analysis step by step using excel. Journal of Technical Science and Technologies, 1(1):9-15 [ Links ]
AMBULKAR, S., BLACKHURST, J. & GRAWE, S. 2015. Firm's resilience to supply chain disruptions: Scale development and empirical examination. Journal of Operations Management, 33-34:111-122. [ Links ]
ARMISTEAD, C.G. & MAPES, J. 1993. The impact of supply chain integration on operating performance. Logistics Information Management, 6(4):9-14. [ Links ]
ARRIGHETTIA, A., LANDINIB, F. & LASAGNIA, A. 2014. Intangible assets and firm heterogeneity: Evidence from Italy. Research Policy, 43:202-213. [ Links ]
AVELLA, L., VAZQUEZ-BUS TELO, D. & FERNANDEZ, E. 2009. Cumulative manufacturing capabilities: An extended model and new empirical evidence. International Journal of Production Research; IJPR-0186. R2 . [ Links ]
BATES, A., KIMBERLY, FLYNN, E.J. & FLYNN, B.B. 2009. The pressure to perform: Innovation, cost, and the lean revolution. Business Horizons, 52:215-221. [ Links ]
BECK, F.G., GROSSE, E.H. & TEBMANN, R. 2015. An extension for dynamic lot-sizing heuristics. Production and Management Research: An Open Access Journal, 3(1):20-35. [ Links ]
BENNER, M. & TUSHMAN, M. 2002. Process management and technological innovation: A longitudinal study of the photography and paint industries. Administration Science quarterly, 47(4):676-706. [ Links ]
BOURGEOIS, L.J. 1980. Strategy and environment: A conceptual integration. Academic Management Review, 5:25-39. [ Links ]
BORTOLOTTI, T., DANESE, P., FLYNN, B.B. & ROMANO, P. 2015. Leveraging fitness and lean bundles to build the cumulative performance sand cone model. International Journal of Production Economics, 162:227-241. [ Links ]
BOYER, K.K. & LEWIS, M.W. 2002. Competitive priorities: Investigating the need for trade-offs in operations strategy. Production and Operations Management, 11(1):9-20. [ Links ]
BOZARTH, C.C., WARSING, P.D., FLYNN, B.B. & FLYNN, E.J. 2009. The impact of supply chain complexity on manufacturing plant performance. Journal of Operations Management, 27:78-93. [ Links ]
CAI, S. & YANG, Z. 2014. On the relationship between business environment and competitive priorities: The role of performance frontiers. International Journal of Production Economics, 151:131-145. [ Links ]
CAMBITSIS, A. 2012. A framework to simplify the management of throughput and constraints. The Southern African Institute of Mining and Metallurgy. Cyest Corporation. [ Links ]
CAPALDO, A. 2007. Network structure and innovation: The leveraging of a dual network as a distinctive relational capability. Strategic Management Journal, 28(6):585-608. [ Links ]
CAPALDO, A. & MESSENI, P.A. 2011. In search of alliance-level relational capabilities: Balancing innovation value creation and appropriability in R&D alliances. Scandinavian Journal of Management, 27(3): 273-286. [ Links ]
CARMELI, A. 2004. Assessing core intangible resources. European Management Journal, 22 (1):110-122. [ Links ]
CHANG, S.J. & PARK, S.H. 2012. Winning strategies in China: Competitive dynamics between MNCs and local firms. Long Range Planning, 45:1-15. [ Links ]
CHEN, M.J. & MILLER, D. 2012. Competitive dynamics: Themes, trends and a prospective research platform. Academy of Management Annuals, 6(1):135-210. [ Links ]
CHANG, Y.C., CHANG, H.T., RU, C.H., HUEI, C.M. & DENG, L. 2012. How do established firms improve radical innovation performance? The organisational capabilities view, Technovatian, 32:441-451. [ Links ]
CLARK, K. 1996. Competing through manufacturing and the new manufacturing paradigm: Is manufacturing strategy passé? Production and Operations Management, 5(1):42-58. [ Links ]
COLLINS, S.R., GORDON, C. & JULIEN, D. 1998. An empirical test of the rigid flexibility model. Journal of Operations Management, 16:133-146 [ Links ]
COLLINS, R.S. & SCHMENNER, R.W. 1993. Achieving rigid flexibility: Factory focus for the 1990s. European Management Journal, 11(4):443-447. [ Links ]
COLLINS, S.R. & SCHMENNER, W.R. 2005. Understanding persistently variable performance in plants. Journal of Operations Management (unpublished manuscript). [ Links ]
CORBETT, J.C. & VAN WASSENHOVE, N.L. 1991. Manufacturing strategy "trade-offs? What tradeoffs?" International Journal of Production Research; Printed at INSEAD, Fontainebleau, France. [ Links ]
CRAIGHEAD, C.W., BLACKHURST, J., RUNGTUSANATHAM, M.J. & HANDFIELD, R.B. 2007. The severity of supply chain disruptions: Design characteristics and mitigation capabilities. Decision ScienceJournal, 38:131-156. [ Links ]
DANESEN, P. 2013. Supplier integration and company performance: A configurational view. Omega 41: 1029-1041. [ Links ]
DA SILVEIRA, G. & SLACK, N. 2001. Exploring the trade-off concept; International Journal of operations & Production Management, 21(7):949-964. [ Links ]
DA SILVEIRA, G. 2006. Effects of simplicity and discipline on operational flexibility: An empirical reexamination of the rigid flexibility model. Journal of Operations Management, 24:932-947 [ Links ]
D'AVENI, R.A., DAGNINO, G.B. & SMITH, K.G. 2010. The age of temporary advantage. Strategy Management Journal, 31:1371-1385. [ Links ]
DEMING, W.E. 1982. Quality, productivity and competitive position. Cambridge, MA: Massachusetts Institute of Technology Center for Advanced Engineering Study. [ Links ]
DOW, D. & SAMSON, S. & FORD, S. 1999. Exploring the myth: Do quality management practices contribute to superior quality performance? Production and Operations Management, 8(1):1-27. [ Links ]
DROGE, C., JAYARAM, J., VICKERY, S,K. 2004. The effects of internal versus external integration practices on time-based performance and overall firm performance. Journal of Operations Management 22(6):557-573 [ Links ]
EUEHUN, L., SEMI, H., HYE, U.N. & RHO, J.J. 2013. Building capabilities via suppliers' effective management of relationships. Industrial Marketing Management, 42:805-813. [ Links ]
FARRERO, J.M.C., TARRES, L.G. & LOSILLA, B.C. 2002. Optimization of replacement stocks using a maintenance programme derived from reliability studies of production systems. Industrial Management and Data systems, 102(4):188-196. [ Links ]
FAZLI, I. 2012. Achieving flexibility in service operations using the rigid flexibility framework: An exploratory study. International Journal of Business and Society, 13(3):279-292. [ Links ]
FERDOWS, K. & DE MEYER, A.D. 1990. Lasting improvements in manufacturing performance: In search of a new theory. Journal of Operations Management, 9(2):168-184. [ Links ]
FERDOWS, K. & THURNHEER, F. 2011. Building factory fitness. International Journal of Operations and Production Management, 31(9):916-934. [ Links ]
FLYNN, B.B. & FLYNN, E.J. 2004. An exploratory study of the nature of cumulative capabilities. Journal of Operations Management, 22(5):439-459. [ Links ]
FLYNN, B.B., SCHROEDER, R.G. & FLYNN, E.J. 1999. World class manufacturing: An investigation of Hayes and Wheelwright's foundation. Journal of Operation Management, 17:249-269. [ Links ]
FONZI, D. & SHAH, M. 2008. Operational excellence in the process industries: Driving performance through real-time visibility. Aberdeen Group. A Harte & Hanks Company. [ Links ]
FOSS, N.J., HEIMERIKS, K.H., WINTER, S.G. & ZOLLO, M. 2012. A Hegelian dialogue on the micro- foundations of organizational routines and capabilities. European Management Review, 9(4):173-197. [ Links ]
GHOSH, S. 2001. Introduction to the special issue. Journal of Operations Management, 19(2):131-142. [ Links ]
GLOCK, C.H., GROSSE, E.H. & RIES, J.M. 2014. The lot sizing problem: A tertiary study, International Journal of Production Economics, 155:39-51. [ Links ]
GRANT, R.M. 1991. The resource-based theory of competitive advantage: Implications for strategy formulation. California Management Review, 33 (3):114-135. [ Links ]
HAFNER, H. 1991. Lot sizing and throughout time in a job shop, International Journal of Production Economics, 23(1-3): October 111-116. [ Links ]
HALL, R.W. 1987. Attaining manufacturing excellence, Dow Jones Irwin. [ Links ]
HAYES, R.H. & WHEELWRIGHT, S.C. 1984. Restoring our competitive edge: Competing through manufacturing. New York, NY: Wiley. [ Links ]
HEIZER, J. & RENDER, B. 2008. Operations management (8th ed.) New Jersey, US. Prentice Hall, [ Links ]
HOPP, W.J. & SPEARMAN, M.L. 2001. Factory physics: Foundations of manufacturing management (2nd ed.) Boston, MA: Irwin/McGraw-Hill, [ Links ]
HOWARD-GRENVILLE, J. & PARMIGIANI, A. 2011. Routines revisited: Exploring the capabilities and practice perspectives. The Academy of Management Annals, 5(1):413-453. [ Links ]
HULT, M.T.G., SNOW, C.C. & KANDEMIR, D. 2003. The role of entrepreneurship in building cultural competitiveness in different organisational types. Journal of Management, 29(3):401-426. [ Links ]
JOHNSON, J. DANNY. 2003. A framework for reducing manufacturing throughput time. Journal of Manufacturing Systems, 22(4). [ Links ]
KAZAN, O., NAGI, R. & RUMP, C.M. 2000. New lot-sizing formulations for less nervous production schedules Computer and Operations Research, 27(13):1325-1345. [ Links ]
KAZAZ, B. & SLOAN, T.W. 2013. The impact of process deterioration on production and maintenance policies, European Journal of Operational Research, 227: 88-100. [ Links ]
KLASSEN, D.R. & MENOR, J.L. 2007. The process management triangle: An empirical investigation of process trade-offs. Journal of Operations Management, 25:1015-1034. [ Links ]
KNEMEYER, A.M., ZINN, W. & EROGLU, C. 2009. Proactive planning for catastrophic events in supply chains. Journal of Operations Management, 27:141-53. [ Links ]
KOUFTEROS, X.A., VONDEREMBSE, M.A. & DOLL, W.J. 1997. Competitive capabilities: Measurement and relationships. Proceedings Decision Science Institute, 3:1067-1068. [ Links ]
KRAUSE, D., YOUNGDAHL, W. & RAMASWAMY, K. 2014. Manufacturing - still a missing link? Journal of Operations Management, 32(7-8):399-402. [ Links ]
KRISHNAMOORTHI, K.S. 2006. First course in quality engineering: Integrating statistical and management methods of quality. Prentice Hall Pearson. [ Links ]
KUMLU, Ö. 2014. The effect of intangible resources and competitive strategies on the export performance of small and medium sized enterprises. Procedía - Social and Behavioral Sciences, 150:24-34. [ Links ]
LIM, C., HAN, S. & ITO, H. 2013. Capability building through innovation for unserved lower end mega markets, Technovation, 33:391-404. [ Links ]
LIN, Y. & WU, L.-Y. 2013. Exploring the role of dynamic capabilities in firm performance under the resource-based view framework. Journal of Business Research, 67(3):407- 413. [ Links ]
LISBOA, A., SKARMEAS, D. & LAGES, C. 2011. Innovative capabilities: Their drivers and effects on current and future performance. Journal of Business Research, 64(11):1157-1161. [ Links ]
MAPES, J., SZWEJCZEWSKI, M. & NEW, C. 2000. Process variability and its effect on plant performance. International Journal of Operations & Production Management, 20(7):792-808. [ Links ]
MAPES, J. & NEW, C. 2002. Performance trade-offs in manufacturing plants. Cranfield University, School of Management. [ Links ]
MASCARENHAS, B., BAVEJA, A. & JAMI, M. 1998. Dynamics of core competencies in leading multinational companies. California Management Review, 40(4):117- 131. [ Links ]
NARASIMHAN, R. & TALLURI, S. 2009. Perspectives on risk management in supply chains. Journal of Operations Management, 27(2):114-118. [ Links ]
NEWEY, R.L. & ZAHRA, S.A. 2009. The evolving firm: How dynamic and operating capabilities interact to enable entrepreneurship, British Journal of Management, 20(1):81-100. [ Links ]
OHNO, T. 1988. Toyota production system: Beyond large scale production. Cambridge, MA: Productivity Press. [ Links ]
ONAWOGA, D.T. & AKINYEMI, O.O. 2010. Development of equipment maintenance strategy for critical equipment, The Pacific Journal of Science and Technology, 11. [ Links ]
PENG, D.X., SCCHROEDER, R.G. & SHAH, R. 2008. Linking routines to operations capabilities: a new perspective. Journal of operations management, 26(6):730-748. [ Links ]
PERSAUD, A. 2005. Enhancing synergistic innovative capability in multinational corporations: An empirical investigation. Journal of Product Innovation Management, 22(5):412-429. [ Links ]
PLOSSL, G.W. 1991. Managing in the new world of manufacturing. Englewood Cliffs, NJ: Prentice-Hall. [ Links ]
PORTER, M.E. 1980. Competitive strategy: Techniques for analysing industries and competitors. New York, NY: Free Press. [ Links ]
PRAHALAD, C.K. & HAMEL, G. 1990. The core competence of the corporation. Harvard Business Review, May-June:79-9I. [ Links ]
PRAJAPATI, A., BECHTEL, J. & GANESAN, S. 2012. Condition based maintenance: A survey. Journal of Quality in Maintenance Engineering, 18(4):384-400. [ Links ]
RAGATZ, G.L., HANDFIELD, R.B. & PETERSON, K.J. 2002. Benefits associated with supplier integration into new product development under conditions of technology uncertainty. Journal of business research, 55: 389-400. [ Links ]
RERUP, C. & FELDMAN, M.S. 2011. Routines as a source of change in organizational schemata: The role of trial-and-error learning. Academy of Management Journal, 54(3):577-610. [ Links ]
RIVERA-GÓMEZ, H., GHARBI, A. & KENNÉ, J.P. 2013. Joint production and major maintenance planning policy of a manufacturing system with deteriorating quality. International Journal of Production Economics, 146:575-587. [ Links ]
SALONEN, A. & DELERYD, M. 2011. Cost of poor maintenance: A concept for maintenance performance improvement. Journal of Quality in Maintenance Engineering, 17(1):63-73. [ Links ]
SALONEN, A. & BENGTSSON, M. 2011. The potential in strategic maintenance development. Journal of Quality in Maintenance Engineering, 17(4):337-350. [ Links ]
SARMIENTO, R., SARKIS, J, & BYRNE, M. 2008. Manufacturing capabilities and performance: A critical analysis and review. International Journal of Production Research. Available at: http://mc.manuscriptcentral.com/tprs [accessed April 2013]. [ Links ]
SARMIENTO, R. & SHUKLA, V. 2011. Zero-sum and frontier trade-offs: An investigation on compromises and compatibilities amongst manufacturing capabilities. International Journal of Production Research, 49: 2001-2007. [ Links ]
SCHMENNER, R.W. & SWINK, M.L. 1998. On theory in operations management. Journal of Operations Management, 17(1):97-113. [ Links ]
SCHROEDER, G.R., SHAH, R. & XIAOSONG PENG, D. 2011. The cumulative capability sand cone model revisited: A new perspective for manufacturing strategy. International Journal of Production Research, 49(16):4879-4901. [ Links ]
SCHROEDER, R.G., BATES, K.A. & JUNTTILA, M.A. 2002. A resource-based view of manufacturing strategy and the relationship to manufacturing performance. Strategic Management Journal, 23(2):105-117. [ Links ]
SHARMA, A. & YADAVA, G.S. 2011. A literature review and future perspectives on maintenance optimization. Journal of Quality in Maintenance Engineering, 17(1):5-25. [ Links ]
SKINNER, W. 1969. Manufacturing ± missing link in corporate strategy. Harvard Business Review, May- June:136-45. [ Links ]
SKINNER, W. 1974. The focused factory. Harvard Business Review, May-June:113-121. Strategy- Process and Content. London: Chapman & Hall:13- 25. [ Links ]
SKINNER, W. 2007. Manufacturing strategy: The story of its evolution. Journal of Operations Management, 25:328-335. [ Links ]
SMITH, R. 2008. Aligning competencies, capabilities and resources. Research Technology Management: The Journal of the Industrial Research Institute, September-October:1-11. [ Links ]
SPRAGUE, LINDA, G. 2007. Evolution of the field of operations management. Journal of Operations Management, 25(2):219-38. [ Links ]
STALK, G., EVANS, P. & SHULMAN, L.E. 1992. Competing on capabilities: The new rules of corporate strategy. Harvard Business Review, Mar-Apr:57-67. [ Links ]
STEPHEN, C.H., RUNGTSUSANATHAM, J.M., ZHAO, X. & LEE, T.S. 2015. Examining process management via the lens of exploitation and exploration: Reconceptualisation and scale development. International Journal of Production Economics, 163:1-15 [ Links ]
STEVENSON, W. & HOJATI, M. 2007. Operations management (3rd ed.) Toronto, Canada: McGraw-Hill Ryerson. [ Links ]
SU, H.C., LINDERMAN, K, SCHROEDER G.R. & VAN DE VEN, A.H. 2014. A comparative case study of sustaining quality as a competitive advantage. Journal of Operations Management, 32:429-445. [ Links ]
SWINK, M. & HEGARTY, W.H. 1998. Core manufacturing capabilities and their links to product differentiation. International Journal of Operations and Production Management, 18(4):374-396. [ Links ]
TSANG, C.Y., DULTRA-DE-LIMA, R.G., CSILLAG, J.M. & OYADOMARI, J.C.T. 2015. Does the competitive orientation really lead to emphasis on different internal capabilities? International Journal of Operations & Production Management, 35(7):1075-096. [ Links ]
VANPOUCKEA, E., VEREECKEB, A., WETZELS, M. 2014. Developing supplier integration capabilities for sustainable competitive advantage: A dynamic capabilities approach. Journal of Operations Management, 32(2014):446-461. [ Links ]
WAGNER, S.M. & BODE, C. 2008. An empirical examination of supply chain performance along several dimensions of risk. Journal of Business Logistics, 29:307-325. [ Links ]
WANG, C. & MASINI, A. 2011. The sand cone model revisited: The impact of service flexibility on quality, delivery, and cost. International Journal of Production Economics, 132(1):122-130. [ Links ]
WARD, P.T. & DURAY, R. 2000. Manufacturing strategy in context: Environment, competitive strategy and manufacturing strategy. Journal of Operations Management, 18:123-138. [ Links ]
WARD, P.T., DURAY, R., LEONG, G.K. & SUN, C. 1995. Business environment, operations strategy, and performance: An empirical study of Singapore manufacturer. Journal of Operations Management, 13:99-15. [ Links ]
WONGA, C.Y., SAKUN, B. & WONG, C.W.Y. 2011. The contingency effects of environmental uncertainty on the relationship between supply chain integration and operational performance. Journal of Operations Management, 29:604-615. [ Links ]
WINTER, S.G. 2003. Understanding dynamic capabilities. Strategic Management Journal, 24(10):991-995. [ Links ]
WRIGHT, J. 2013. Taking a broader view of supply chain resilience. Supply Chain Management Review, March/April:26-31. [ Links ]
WUA, K. & MCGINNIS, L. 2012. Performance evaluation for general queueing networks in manufacturing systems: Characterizing the trade-off between queue time and utilization. European Journal of Operational Research, 221:328-339. [ Links ]
XIAOSONG-PENG, D., SCHROEDER, G.R. & RACHNA, S. 2008. Linking routines to operations capabilities: A new perspective. Journal of Operations Management, 26:730-748. [ Links ]
XINLIN TANG & ARUN RAI, 2014. How should process capabilities be combined to leverage supplier relationships competitively? European Journal of Operational Research, 239:119-129. [ Links ]
YOUNG, K.D., KUMAR, V. & KUMAR, U. 2013. Relationship between quality management practices and innovation, Journal of Operations Management, 30:296-315. [ Links ]
ZHANG, D., LINDERMAN, K, & SCHROEDER, R.G. 2012. The moderating role of contextual factors on quality management practices. Journal of Operations Management, 30:12-23. [ Links ]
Accepted: April 2016

