


Serviços Personalizados
Artigo
 Inglês (pdf)
 Artigo em XML
 Referências do artigo
Indicadores

Links relacionados
-
 Citado por Google
 -
 Similares em Google
Compartilhar

 Permalink
South African Journal of Economic and Management Sciences
versão On-line ISSN 2222-3436
versão impressa ISSN 1015-8812
S. Afr. j. econ. manag. sci. vol.19 no.3 Pretoria 2016
http://dx.doi.org/10.17159/2222-3436/2016/v19n3a6
ARTICLES
The source of investment cash flow sensitivity in manufacturing firms: is it asymmetric information or agency costs?
Daniel Makina; Letenah Ejigu Wale
Department of Finance, Risk Management and Banking, University of South Africa
ABSTRACT
In the literature, positive investment cash flow sensitivity is attributed to either asymmetric information induced financing constraints or the agency costs of free cash flow. Using data from a sample of 68 manufacturing firms listed on the South African JSE, this paper contributes to the literature by investigating the source of investment cash flow sensitivity. We have found that asymmetric information explains the positive investment cash flow sensitivity better than agency costs. Furthermore, asymmetric information has been observed to be more pronounced in low-dividend-paying firms and small firms. Despite South Africa's having a developed financial system by international standards, small firms are seen to be financially constrained. We attribute the absence of investment cash flow sensitivity due to agency costs to good corporate governance of South African listed firms. Thus the paper provides further evidence in support of the proposition in the literature that the source of investment cash flow sensitivity may depend on the institutional setting of a country, such as its corporate governance.
Key words: investment cash flow sensitivity, asymmetric information, agency costs, South Africa, GMM
JEL: G15, 31, 32
1 Introduction
The influence of cash flow on firms' investment spending has been documented as far back as the 1950s and 1960s (see Meyer & Kuh, 1957; Donaldson, 1961). However, the seminal contribution in this literature is provided by Fazzari, Hubbard and Petersen (1988; 2000). These authors demonstrated that cash flow has a positive and significant effect on a firm's investment spending and that investment cash flow sensitivity is higher in financially constrained firms than in less financially constrained firms. This has been corroborated by other authors, who have persistently documented the same positive and significant result (see Hoshi, Kashyap & Scharfstein, 1991; Oliner & Rudebusch, 1992; Vogt, 1994; Gilchrist & Himmelberg, 1995; Hadlock, 1998; Degryse & De Jong, 2006). In contrast, Kaplan and Zingales (1997; 2000) observed that less constrained firms displayed higher cash flow sensitivity to investment than more constrained firms while Clearly, Povel & Raith (2007) recorded a U-shaped investment cash flow sensitivity. This nonmonotonic behaviour was also observed by Guariglia (2008), Hadlock and Pierce (2010) andHovakimian (2009).
In the literature, the first explanation for a positive relationship between cash flow and investment spending is asymmetric information between the firm insiders and external capital providers. Myers and Majluf (1984) modelled this issue formally. In their model, firm insiders (managers and owners) aim to transfer wealth from external capital providers to existing shareholders. To achieve this goal, they withhold information about the value of the firm from capital market participants. In the presence of such information asymmetry, external capital providers add a premium to the finance they provide to firms. This raises the cost of external finance relative to internal finance and forces firms to rely on internal sources (cash flow) to finance investment. The lack of external finance creates a financing gap (constraint), and as a result firms forgo many positive net present value (NPV) projects (i.e. they under-invest). Asymmetric information therefore leads to financing constraints and is one explanation for the positive influence of internal finance on firm investment.
The second explanation relates to the agency costs of a firm's free cash flow (i.e. the cash that remains available to investors after paying the costs of doing business). Jensen (1986) modelled this issue formally and argues that if corporate governance practices are weak and valuable investment opportunities are absent, managers can waste a firm's free cash flow on unprofitable projects instead of paying the funds to shareholders in the form of dividends or repurchase shares. Managers might act in this manner because their objective is in conflict with shareholders' wealth maximisation objective. They might prefer growth of the firm to value maximisation because their pecuniary and non-pecuniary benefits are tied to firm size. With this scenario, they would invest the firm's free cash flow in negative NPV projects, resulting in an overinvestment problem. Like asymmetric information, agency costs of this nature may be one explanation for the positive influence of internal finance on firm investment.
Certain governance mechanisms have been suggested in the literature to reduce free cash flows and the associated agency costs. These include the use of debt finance and the payment of dividends (see Jensen, 1986; Easterbrook, 1984).Through regular repayment of interest, debt finance disciplines managers and protects the wastage of free cash flows. Paying out the free cash flows as dividends also helps to align the interests of managers with those of shareholders.
Empirically, a number of studies have been conducted to verify the source of investment cash flow sensitivity in different countries. These include the research by Vogt (1994) and Hadlock (1998) in the USA, and the study by Degryse and De Jong (2006) in the Netherlands. Vogt (1994) found that both asymmetric information and agency costs are important in explaining firm investment behaviour but found agency cost explanations to be more dominant. The same agency cost dominance result was found by Degryse and De Jong (2006) and they attribute the result to the specific governance environment facing firms in the Netherlands. On the other hand, Hadlock (1998) found asymmetric information to be a dominant reason for the observed investment cash flow sensitivity. Most past studies have been conducted on the assumption that asymmetric information is the primary cause of investment cash flow sensitivity and Hadlock's (1998) result is consistent with this. Hadlock (1998) even criticised Vogt's (1994) result on the grounds of inconsistency. These differing results show that the specific institutional environment (governance and financial systems) determines which theory will be found to be dominant in explaining positive investment cash flow sensitivity.
It is against these mixed results in the literature that we examine the source of investment cash flow sensitivity in the South African environment. South Africa is unique in several respects. First, the country has a better governance system by international standards (see World Economic Forum, 2014/15 report). Hence, we could hypothesize that agency costs may not be a primary explanation for positive investment cash flow sensitivity. Second, the country has a well-developed financial system, which suggests that financing constraints may not be severe. This would weaken the role of asymmetric information in explaining positive investment cash flow sensitivity. These characteristics of the South African institutional environment make it an ideal laboratory in which to investigate the issue.
The rest of the paper is structured as follows. Section 2 reviews the relevant literature on the subject matter. It also discusses the South African institutional environment (corporate governance and financial system) to provide an adequate context for the study. Section 3 describes the source of the data and the methodology employed. Section 4 presents the results and discusses them, and section 5 concludes the paper
2 Literature review
One implication of Modigliani & Miller's hypothesis (1958) that the investment decision of firms is independent of their financing decision is that internal and external finance are regarded as substitutes for each other. However, the hypothesis was framed under the assumption of perfect capital markets in which firms do not face constraints in raising external finance. In reality, raising external finance is costly to firms and hence cannot easily replace internal finance. In other words, firms will be financially constrained and may be dependent on internal finance. Early literature by Donaldson (1961) and Pinegar & Wilbricht (1989), for example, shows that internal finance is the primary source of firms' investment capital.
The Modigliani & Miller (1958) proposition has also been challenged from the perspective of arguments that demonstrate the existence of asymmetric information and agency costs. Fazzari et al. (1988; 2000) have demonstrated that the existence of asymmetric information and agency costs affects the sensitivity of investment cash flow in a particular manner. Their conclusions have been generally supported by various other studies (Bond, Harhof & Van Reenen, 1999; Carpenter, Fazzari & Petersen, 1994; Nickell & Nicolitsas, 1999). They have also observed that low-dividend-paying firms are financially constrained because of asymmetric information and hence they rely on internal finance to fund their investment. Hadlock (1998) found support for the asymmetric information theory. Empirically, evidence on the relevance of agency costs is mixed, with Oliner and Rudebusch (1992), Carpenter (1995), Devereux and Schiantarelli (1990), Strong and Meyer (1990), Hoshi et al. (1991), Hubbard, Kashyap & Whited (1995) failing to find evidence in support of this theory, and Vogt (1994) and Degryse and De Jong (2006) finding such evidence.
In order to study which theory, asymmetric information or agency costs, explains the relationship between investment and cash flow, researchers have studied the interaction of cash flow with Tobin's Q in regressions (see Vogt, 1994; Degryse & De Jong, 2006; Hoshi et al., 1991). Some exceptions are Hadlock (1998) and Oliner and Rudebusch (1992), who used the interaction of cash flow with insider shareholding to explain the two theories. Tobin's Q is simply measured by the market value of the firm in relation to its book value and indicates the profitability of future investment opportunities. Firms with high Q values (higher profitability of future investment opportunities) are assumed to face asymmetric information and an underinvestment problem (Myers & Majluf, 1984). Their financial resources are viewed as insufficient to finance all the available positive NPV projects. In contrast, firms with low Q values (lower profitability of future investment opportunities) are assumed to face agency costs and the overinvestment problem. They are considered to have more financial resources than are needed for the available positive NPV projects. Thus managers may have an incentive to waste the firm's financial resources in value-destroying projects.
Under the agency cost theory, firms will pay low dividends just to exploit the free cash flow whereas under the asymmetric information scenario they pay low dividends to conserve cash. Vogt (1994) found that the low-dividend-paying firms have significantly higher cash flow coefficients than the medium- and high-dividend-paying firms, a result that is consistent with either the agency cost or asymmetric information theory. However, further econometric tests lend support to the agency cost theory. Degryse and De Jong (2006), who used a sample of Dutch firms, also found results consistent with the agency cost theory. In addition, they found that bank debt is one of the governance mechanisms that help to reduce the agency costs of free cash flows.
While studies similar to the one by Fazzari et al. (1988; 2000) conclude that investment cash flow sensitivity for financially constrained firms is higher than in less financially constrained firms, there are other studies that reach a contrary conclusion. For instance, Kaplan and Zingales (1997; 2000), who extensively challenged and questioned the validity of the measure of financial constraints and the positive relationship between investment and cash flow used by Fazzari et al. (1988), observed that least constrained firms displayed a higher sensitivity of cash flow to investment than more financially constrained firms. This has been supported in other studies (see Chang, Tan, Wong & Zhang, 2007; Cleary, 1999; Erickson & Whited, 2000). The contradictory conclusions in empirical studies have been attributed to the lack of a precise proxy for financial constraints by Clearly, Povel and Raith (2007), whose research showed a U-shaped (nonmonotonic) relationship between investment and cash flow due to the interaction between the cost and revenue effect of investment. This non-monotonic investment-cash flow relationship has also been observed by Firth, Malatesta, Xin & Xu (2012) for China's listed firms, Guariglia (2008) for UK firms, and by Hadlock and Pierce (2010) and Hovakimian (2009) for US manufacturing firms.
It is noteworthy that studies (including this study) on investment cash flow sensitivity (ICFS) have focused only on manufacturing firms because of their relatively smooth investment schedules and visible fixed investment compared to other sectors (Allayanis & Mozumdar 2004; Rousseau & Kim, 2008; Hayashi & Inoue, 1991). This is a limitation of the study in that conclusions cannot be generalised to other sectors of the South African economy.
Since studies have also alluded to the influence of the institutional environment on the source of investment-cash flow sensitivity (e.g. Degryse & De Jong, 2006), a review of the governance environment of the unit of study is necessary. South Africa, whose governance is largely AngloSaxon based, has made significant corporate governance reforms since the end of apartheid in 1994 in the form of King Report I (1994), King Report II (2002) and King Report III (2009). King Report I adopted an Anglo-American style of a unitary board of directors (consisting of executive and non-executive directors), who are primarily accountable to shareholders with a voluntary compliance and disclosure regime. King Report II further incorporated historical socio-economic racial inequalities which were South African-specific realities in both the pre- and post-apartheid periods. Thus, as opposed to the Anglo-American approach, the King reports incrementally adopted an inclusive approach incorporating both shareholders and stakeholders, thus making South African corporate governance a hybrid model (Ntim, Opong, Danbolt & Thomas, 2012).
Scholars have observed that the post-apartheid South African corporate setting is uniquely characterised by concentrated ownership, weak enforcement of corporate regulations, high levels of institutional ownership and weak shareholder activism, as well as distinctive features relating to the greater need to meet affirmative action and stakeholder corporate governance provisions, such as black economic empowerment (Armstrong, Segal & Davis, 2005; Ntim, 2009). In particular, concentrated ownership renders the market for corporate control weak (Haniffa & Hudaib, 2006), which can impact negatively on the willingness of corporations to engage in voluntary compliance and disclosure, thereby limiting the ability of a voluntary code to improve corporate governance standards.
The Institute of International Finance (IIF, 2007) Report assessing corporate governance implementation and practices in emerging markets shows that while South Africa appears to have a sound and well-developed corporate governance framework in the form of the King Code, scant research has been done to ascertain the actual levels of voluntary compliance among listed firms. Research by Ntim et al. (2012) has shown substantial variation among South African firms on the degree of voluntary compliance with the King II Code. Nevertheless, the 2013-2014 Report of the World Economic Forum shows that South Africa ranks highest for rigorous auditing and reporting standards, efficacy of corporate boards, and the protection of minority shareholders' interests. However, despite the fact that South Africa has a good corporate governance code, its implementation by companies has not been extensively researched.
3 Data and methodology
3.1 Data
Firm-level financial data for the years 2005-2013 was obtained from the Bureau van Dijk's Orbis financial database. We selected manufacturing firms because of the relatively smooth investment schedules of these firms compared to other sectors such as the construction or services sectors (Allayanis & Mozumdar, 2004; Rousseau & Kim, 2008; Hayashi & Inoue, 1991). Another reason of secondary importance for selecting manufacturing firms was to make it possible to compare our result with previous studies which also relied on manufacturing samples.
The sampling process proceeded as follows. A total of 68 listed manufacturing firms were selected from a total of 81 JSE-listed manufacturing firms included in the Orbis financial database on the basis of availability of data. Consistent with the research tradition in the field of investment cash flow sensitivity, the following data cleaning strategies were followed. First, firms that were engaged in significant merger and acquisition (M & A) and divestiture activities during the period under study were removed. The growth rate of assets was calculated and if a firm-year observation was found to have a growth rate that exceeded 85 per cent; it was removed from the dataset. We removed data of this kind because firm growth as a result M & A and divesting activities is not normal. Second, all firm-level variables, which were used in the econometric model, were winsorised at the 1 per cent and 99 per cent percentile, i.e. values below and above these percentiles were capped at these percentiles. This procedure was employed to reduce the potential impact of outliers on parameter estimates. Third, those firms-year observations with negative equity values were dropped because data of this kind fall outside the usual pattern.
The usable sample of 68 firms had an average of 5.5 years' data, making the total firm-year observations 377. Use of the Generalized Method of Moments (GMM) estimation technique further reduced the number of firm-year observations to 294.
3.2 Estimation model
The following model of investment, adapted from the standard approach in the literature, was employed (see Hoshi et al., 1991; Vogt, 1994; Degryse and De Jong, 2006). Investment is estimated as a function of its own lag, sales, cash flow, Tobin's Q and interaction of cash flow and Q.

Where I is investment measured as the difference between net property, plant and equipment at the end and beginning of the period plus depreciation; K is the capital stock or net property, plant and equipment; S is sales; CF is cash flow measured as net income plus depreciation; Q is Tobin's Q measured as the ratio of market value of equity to book value of equity; f represents firm fixed effects; dtrepresents time dummies. Time dummies are added because firm-level investment is influenced by macroeconomic factors such as the business cycle. Finally, eitis the usual error term.
In the standard approach, Tobin's Q is measured as the ratio of the market value of assets to replacement cost of assets (Lindenberg & Ross, 1981). Because of data insufficiency, we adopted the approach of Klapper and Love (2004), who used the approximate Tobin's Q, namely, the ratio of the market value of assets to the book value of assets. In essence, this measure can be reduced to the market value of equity to book value of equity as the market value and book value of debt are assumed to be the same.
The estimation model in equation (1) was extended in a number of ways. First, cash flow was interacted with subsamples of Q (defined as low Q, medium Q and high Q) to check the robustness of the result. Second, cash flow was interacted with the subsamples of firms with different dividend pay-out levels to check whether the low-dividend-paying firms are the ones that show the greatest investment cash flow sensitivity. Third, cash flow was interacted with firm size as firm size has implications for the two theories - asymmetric information theory and agency cost theory. The agency cost theory will hold if cash flow coefficients are high for large firms whereas the asymmetric information explanation will hold if the cash flow coefficients of small firms are high. Fourth, triple interaction terms of cash flow, Q and dividend pay-out level subsamples were created. The purpose of this analysis is to see in which subsample of dividend-paying firms either theory will hold true. The expectation regarding each theory is that the result will hold in low-dividend-paying firms. Fifth, as in the fourth case, triple interaction terms of cash flow, Q and firm size subsamples were created, the purpose being to examine the firm sizes at which each theory holds true. The expectation is that the agency cost theory will hold true in large firms and the asymmetric information theory will hold true in small firms.
Dummy variables for subsamples of Q, dividend pay-out levels and firm size are created as follows. First, all these variables are split using quartile values. Second, a dummy variable is created for the data spanning the different quartile values. The quartile-based classification of firms is used by several authors in the literature. For instance, Hoshi et al. (1991) split Tobin's Q into two parts using the median (the second quartile); Vogt (1994) split Tobin's Q into four parts; Degryse and De Jong (2006) split Tobin's Q into two parts using Q1 (the first quartile), with values below Q1 rated as low Q firms and those above Q1 rated as high Q firms. They do this to maintain adequate sample size and heterogeneity within the two groups.
For our research, we split Tobin's Q and dividend pay-out levels into three parts using Q1 (the first quartile) and Q3 (the third quartile); firm size was split into two parts using Q2 (the median). We followed this approach in splitting the sample by considering the distribution of each variable with the goal of achieving adequate sample size and heterogeneity in the subsamples. Tobin's Q and dividend-paying firms below Q1 are judged as low Q and low-dividend-paying firms. Those between Q1 and Q3 are considered medium Q and medium-dividend-paying firms. Those above Q3 are rated as high Q and low-dividend-paying firms. For firm size, those below Q2 are classified as small firms and those above the median as large firms. The quartile values of the different variables are as follows. For Tobin's Q, Q1 is 0.77 and Q3 is 2.32, for dividend pay-out levels the values are 0 and 0.28 respectively. The median firm size as measured by assets is USD 206.87. Despite using the ad hoc quartile-based classification which is dependent on the available data, we acknowledge that there are theoretical and logical means of classifying firms. For instance, with respect to Tobin's Q, the theoretically valid cut-off point for classifying firms as high and low Q could logically be a Q value of 1. However, this classification may not be meaningful if the mean Q is substantially different from 1 and the data are not normally distributed. We were therefore forced to use our own classification scheme, which is dependent on the available data. We followed a scheme that generates sufficient sample size and heterogeneity across the groups.
After the variables had been split by quartile values, a dummy variable was created as follows. For a low Q dummy, the code 1 is assigned if the Q values are below Q1, otherwise the value is zero. For a medium Q dummy, the code 1 is assigned if the Q values are between Q1 and Q3, otherwise the value is zero. For the high Q dummy, the code 1 is assigned if the Q values are greater than Q3, otherwise the value is zero. The same procedure is used to create dummies for dividend pay-out levels and firm size variables. After this procedure, the various dummy variables of Q, dividend pay-out levels and firm size were interacted with cash flow.
As to the estimation technique, the Generalized Method of Moments (GMM) system of estimators proposed by Blundell and Bond (2000) was employed. Such estimators control for fixed effects through first differencing, taking into account heteroskedasticity and autocorrelation and the presence of endogenous variables. To address the issues of heteroskedasticity, cluster robust standard errors were used. Endogeneity was addressed by using the two lags of the endogenous right-hand side variables in equation [1] as instruments. Lagged investment, cash flow and the various cash flow interaction terms were treated as endogenous variables. The endogeneity of cash flow arises from the fact that increased investment can increase a firm's cash flows (i.e. the simultaneity problem) in addition to the standard causality of cash flow to investment. The Sargan test of over identifying restriction is used to test for instrument validity. The Autoregressive (AR) of order two, AR (2), test is used to check for autocorrelations in first difference errors.
4 Results and discussions
4.1 Descriptive statistics
Table 1 below presents summary statistics.
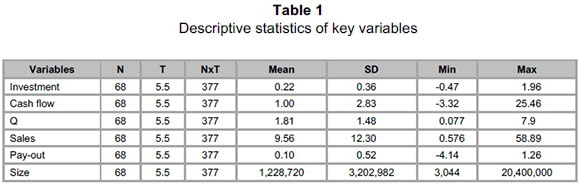
Some firms show negative investment, which indicates divestment and other firms invest twice from their existing capital stock. There are some firms with negative cash flows, an indicator of short-term financial difficulty, but there are some with exceptionally high internal cash flow. The average Q value is 1.81, which leans more towards high Q firms, if 1is used as the theoretically valid cut-off point.
This could be an indication that South African manufacturing firms are in the high Q range, which suggests that asymmetric information explanations may possibly be relevant. There are some firms with negative dividend pay-out levels, indicating payment of dividends even when the firm is making a loss. On the other hand, there are some firms that pay more than their current net income as dividends. The firm size standard deviation shows that firms with sufficient variation in size (both small and large firms) are included in the sample.
4.2 Econometric results
Before the results were interpreted, the model adequacy was examined. The Wald statistics was significant, which indicates that all the included variables jointly explain the investment behaviour of the manufacturing firms. The Sargan test was insignificant, which indicates that the instruments are valid. The AR(2) test was also insignificant, indicating that there is no autocorrelation in the first difference residuals and thus no specification problem in the model. Year dummies are included in the model to capture investment dynamics, but most of these dummies are insignificant except for the years 2009 and 2010, which are significant in some models. In general, no sensible interpretation is produced by the inclusion of year dummies.
Table 2 below shows the econometric results for different levels of Tobin's Q.
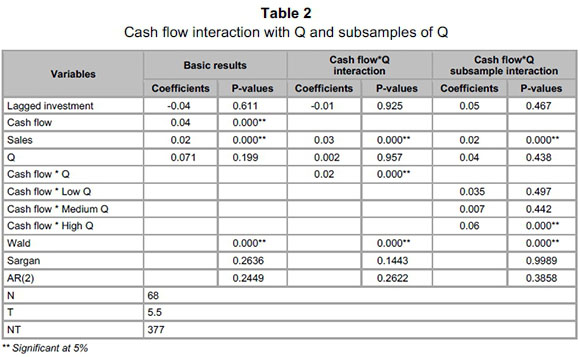
Basic result: This model estimates investment as a function of its own lag, cash flow, sales and Tobin's Q. Lagged investment is not significant, which indicates that there is no persistence in the investment decision of firms. Current year investment does not depend on what happened in the previous year. Cash flow is positive and significant, indicating financing constraints due to asymmetric information (Fazzari et al., 1988) or that the firm managers are wasting the firm's free cash flow (Vogt, 1994; Degryse & De Jong, 2006). The true source of such positive investment cash flow sensitivity will be explored in later sections. The sale of goods has a positive and significant coefficient, which is an indication that the demand for firms' products is one driving force behind investment. Surprisingly, Tobin's Q is not a significant determinant of investment spending in South African manufacturing firms.
Cash flow* Q interaction: Our result shows a positive and significant coefficient for the interaction of cash flow with Tobin's Q. This indicates that the higher the Q, the higher the investment cash flow sensitivity. This also means that higher investment cash flow sensitivity is observed in firms with higher Q values. This evidence is consistent with asymmetric information as the source of investment cash flow sensitivity. High Q firms offer much investment opportunity; they are young and growing firms with possible information opaqueness. As a result, they face greater challenges in raising finance from capital markets. In the end they will be financially constrained and rely on internal cash flows to finance their investment. This result is consistent with the findings of Hadlock (1998) on mixed US firms but contradictory to those of Vogt (1994) for US manufacturing firms and Degryse and De Jong (2006) for Dutch firms. The latter authors found agency costs to be the source of investment cash flow sensitivity. The fact that these findings are contradictory to agency cost explanations makes sense in the light of the better corporate governance practices observed in South African firms. The institutional set-up in the country may have a bearing on the observed investment cash flow relationship.
The finding that asymmetric information is the source of investment cash flow sensitivity implies that South African manufacturing firms are financially constrained. At a glance, this seems odd as the country has one of the most sophisticated financial systems by international standards. But the reality may be that the financial system is serving only a few firms in good standing.
Cash flow* Q subsample interaction: Extreme values of Q may influence both the sign and the significance of the parameter estimates of cash flow interaction with the continuous Q variable. As in Vogt (1994), we interacted cash flow with subsamples of Q. This approach can also be used as a robustness check. The result shows that the cash flow interaction with high Q firms is positive and significant whereas the interaction of cash flow with either low Q or medium Q is not. Thus only high Q firms show positive and significant investment cash flow sensitivity. This again confirms that asymmetric information is the source of investment cash flow sensitivity.
Table 3 below presents the econometric results in which cash flow is interacted with firm subsamples according to dividend pay-out levels and firm size.
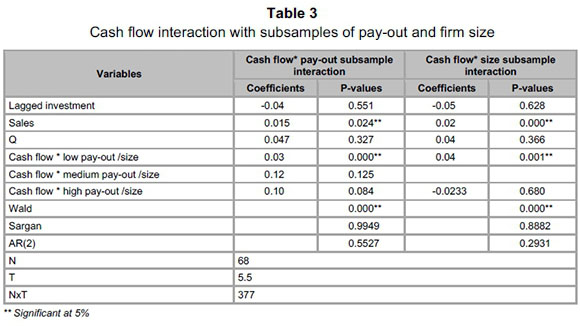
Cash flow* pay-out subsample interaction: The purpose of this analysis is to know which dividend-paying firms show higher investment cash flow sensitivity. Under both asymmetric information and agency cost theories, low-dividend-paying firms are expected to show higher investment cash flow sensitivity, but for different reasons. With regard to asymmetric information theory, firms pay low dividends because they are financially constrained. They need to conserve cash to finance their investment expenditures. With regard to agency cost theory, firms pay low dividends because managers may intend to waste the free cash flows.
Our result shows that only the cash flow interaction with low-dividend-paying firms is positive and significant. This is consistent with either theory. But since we found the asymmetric information explanation to be valid in the previous subsections, we can deduce that the firms pay low dividends to conserve cash instead of wasting cash in value-destroying projects.
Cash flow* firm size subsample interaction: This is another test for the source of investment cash flow sensitivity, namely, to determine whether it is a result of asymmetric information or agency costs. The extant literature indicates that large firms suffer from agency costs as a result of diverse ownership structure (Devereux & Schiantarelli, 1990) whereas small firms suffer from asymmetric information (Vogt, 1994). Our result shows that the cash flow interaction with small firms is positive and significant whereas the interaction with large firms is not. This is consistent with the asymmetric information explanation.
Table 4 below presents econometric results of the cash flow interaction with Q and firm subsamples according to dividend pay-out levels and firm size.
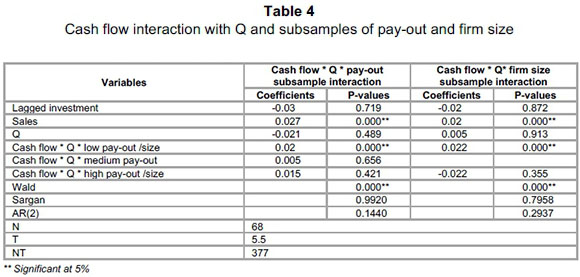
Cash flow* Q * pay-out subsample interaction: This test was conducted to check the robustness of findings. The interaction of cash flow and Q confirms the asymmetric information explanation whereas the interaction of cash flow and dividend pay-out levels shows that low-dividend-paying firms have higher and significant investment cash flow sensitivity. Our result again shows that low-dividend-paying firms have a positive and significant coefficient. This is evidence of the presence of asymmetric information problems in these firms.
Cash flow* Q * firm size subsample interaction: Like the result for the previous interaction term of cash flow with size, the current result is significant with small firms. This result is again consistent with the theory that asymmetric information is the source of investment cash flow sensitivity.
Discussion: All our findings on the interaction of cash flow with Q, dividend pay-out levels and firm size consistently indicate that the source of positive investment cash flow sensitivity observed in South African manufacturing firms is asymmetric information induced financing constraints rather than agency cost problems. The presence of asymmetric information is observed in high Q, low-dividend-paying and small firms. This result is in contrast with the evidence found in developed economies, where agency costs are the primary explanation for positive investment cash flow sensitivity. The puzzling issue is that South Africa has a developed financial system which is comparable to those of advanced economies, but many firms are still financially constrained. This may be the result of the financial system's favouring only a few large firms. In fact, the South African economy has an oligopolistic market structure where a few large firms dominate the economy.
5 Concluding remarks
This paper addressed the source of investment cash flow sensitivity in South African listed manufacturing firms. Knowing the source of this sensitivity has implications for improving the efficiency of firm-level investment.Two theoretical explanations are discussed in the literature on this issue. One is asymmetric information induced financing constraints and the second one is the agency cost of free cash flows. South Africa's specific situation makes this research an important agenda to pursue. South Africa has one of the best corporate governance regimes by international standards and hence agency costs are not expected to be the source of investment cash flow sensitivity. Predictably, our findings show that asymmetric information is the source of positive investment cash flow sensitivity in South African manufacturing firms and this problem has been observed in high Tobin's Q, low-dividend-paying and small firms. The implication of our results is that asymmetric information creates financing constraints for firms. The other implication is that the source of investment cash flow sensitivity may depend on the institutional setting of a country. South Africa, which has a world-class corporate governance regime, does not suffer from the agency cost problems observed in developed countries from prior research. However, the results may not be generalisable to all sectors of the economy as the study was limited to manufacturing firms.
References
ALLAYANNIS, G. & MOZUMDAR, A. 2004. The impact of negative cash flows and influential observations on investment cash flows estimates. Journal of Banking and Finance, 28(5):901-930. [ Links ]
ARMSTRONG, P., SEGAL, N. & DAVIS, B. 2005. Corporate governance in South Africa: A pioneer in Africa. The South African Institute of International Affairs (SAIIA): Global Best Practice Report No 1. [ Links ]
BLUNDELL, R. & BOND, S. 2000. GMM estimation with persistent data: An application to production functions. Econometric Reviews, 19(3):321-340. [ Links ]
BOND, S., HARHOF, D. & VAN REENEN, J. 1999. Investment, R & D and financial constraints in Britain and Germany. Institute for Fiscal Studies Discussion Paper 99(5). [ Links ]
CARPENTER, R.E. 1995. Finance constraints or free cash flows? Empírica, 22(3):185-209. [ Links ]
CARPENTER, R., FAZZARI, S. & PETERSEN, B. 1994. Inventory (dis)investment, internal finance fluctuations, and the business cycle. Brookings Papers in Economic Activity, 2:75-122. [ Links ]
CHANG, X., TAN, T., WONG, G. & ZHANG, H. 2007. The effects of financial constraints on corporate policies in Australia. Accounting and Finance, 47(1):85-108. [ Links ]
CLEARY, S. 1999. The relationship between firm investment and financial status. Journal of Finance, 54 (2):673-692. [ Links ]
CLEARLY, S., POVEL, P. & RAITH, M. 2007. The U-shaped investment curve: Theory and evidence. Journal of Financial and Quantitative Analysis, 42:1-40. [ Links ]
DEGRYSE, H. & DE JONG, A. 2006. Investment and internal finance: Asymmetric information or managerial discretion? International Journal of Industrial Organization, 24(1):125-147. [ Links ]
DEVEREUX, M. & SCHIANTARELLI, F. 1990. Investment, financial factors, and cash flow: Evidence from UK panel data. In: Asymmetric information, corporate finance, and investment, 279-306 (ed.) Hubbard R.G., University of Chicago Press and NBER. [ Links ]
DONALDSON, G. 1961. Corporate debt capacity: A study of corporate debt policy and the determination of corporate debt capacity. Harvard University, Graduate School of Business Administration, Boston, MA. [ Links ]
EASTERBROOK, F. 1984.Two agency-cost explanations of dividends. American Economic Review, 74(4): 650-659. [ Links ]
ERICKSON, T. & WHITED, T. 2000. Measurement error and the relationship between investment and Q. Journal of Political Economy, 19(4):1027-1057. [ Links ]
FAZZARI, S.M., HUBBARD, R.G. & PETERSEN, B.C. 1988. Financing constraints and corporate investment. Brookings Papers on Economic Activity, 1988(1):141-195. [ Links ]
FAZZARI, S.M., HUBBARD, R.G. & PETERSEN, B.C. 2000. Investment-cash flow sensitivities are useful: A comment on Kaplan and Zingales. Quarterly Journal of Economics, 115:695-705. [ Links ]
FIRTH, M., MALATESTA, P., XIN, Q. & XU, L. 2012. Corporate investment, government control, and financing channels: Evidence from China's listed companies. Journal of Corporate Finance, 18(3):433-450. [ Links ]
GILCHRIST, S. & HIMMELBERG, C.P. 1995.Evidence on the role of cash flow in reduced-form investment equations. Journal of Monetary Economics, 36(3):541-572. [ Links ]
GUARIGLIA, A. 2008. Internal financial constraints, external financial constraints, and investment choice: Evidence from a panel of UK firms. Journal of Banking and Finance, 32 (9):1795-1809. [ Links ]
HADLOCK, C.J. 1998. Ownership, liquidity, and investment. Rand Journal of Economics, 29(3):487-508. [ Links ]
HADLOCK, C. & PIERCE, J. 2010. New evidence on measuring financial constraints: Moving beyond the KZ index. Review of Financial Studies, 35(5): 1909-1940. [ Links ]
HANIFFA, R. & HUDAIB, M. 2006. Corporate governance structure and performance of Malaysian listed companies. Journal of Business, Finance and Accounting, 33 (7-8):1034-62. [ Links ]
HAYASHI, F. & INOUE, T. 1991. The relation between firm growth and Q with multiple capital goods: Theory and evidence from panel data on Japanese Firms. Econometrica, 59: 731-754. [ Links ]
HOSHI, T., KASHYAP, A.K. & SCHARFSTEIN, D. 1991. Corporate structure, liquidity, and investment: Evidence from Japanese industrial groups. Quarterly Journal of Economics, 106(1):33-60. [ Links ]
HOVAKIMIAN, G. 2009. Determinants of investment cash flow sensitivity. Financial Management, 38(1):161-183. [ Links ]
HUBBARD, R.G., KASHYAP, A.K. & WHITED, T.M. 1995. Internal finance and firm investment. Journal of Money, Credit and Banking, 27:683-701. [ Links ]
INSTITUTE OF INTERNATIONAL FINANCE (IIF) 2007. Corporate governance in South Africa: An investor perspective. Johannesburg: Institute of International Finance Inc. [ Links ]
JENSEN, M.C. 1986. Agency costs of free cash flow, corporate finance, and takeovers. American Economic Review, 76(2):323-329. [ Links ]
KAPLAN, S. & ZINGALES, L. 1997. Do investment-cash flow sensitivities provide useful measures of financing constraints? Quarterly Journal of Economics, 112(1):169-215. [ Links ]
KAPLAN, S. & ZINGALES, L. 2000. Investment-cash flow sensitivities are not valid measures of financing constraints. Quarterly Journal of Economics, 115(2):707-712. [ Links ]
KLAPPER, L.F. & LOVE, I. 2004.Corporate governance, investor protection and performance in emerging markets. Journal of Corporate Finance, 10(5):703-728. [ Links ]
LINDENBERG, E. & ROSS, S. 1981. Tobin's Q ratio and industrial organization. Journal of Business, 54(1):1-32. [ Links ]
MEYER, J.R. & KUH, E. 1957. The investment decision: An empirical study. Boston, MA: Harvard University Press. [ Links ]
MODIGLIANI, F. & MILLER, M. 1958.The cost of capital, corporation finance, and the theory of investment. American Economic Review, 48(3):261-297. [ Links ]
MYERS, S.C. & MAJLUF, N. 1984. Corporate financing and investment decisions when firms have information that investors do not have. Journal of Financial Economics, 13(2):187-221. [ Links ]
NICKELL, S. & NICOLITSAS, D. 1999. How does financial pressure affect firms? European Economic Review, 43(8):1435-1456. [ Links ]
NTIM, C.G. 2009. Internal corporate governance and firm financial performance: Evidence from South African listed firms. PhD dissertation, University of Glasgow, Glasgow. [ Links ]
NTIM, C.G., OPONG, K.K., DANBOLT, J. & THOMAS, D.A. 2012.Voluntary corporate governance disclosures by post-apartheid South African corporations. Journal of Applied Accounting Research, 13(2):122-144. [ Links ]
OLINER, S.D. & RUDEBUSCH, G.D. 1992. Sources of the financing hierarchy for business investment. The Review of Economics and Statistics, 74(4):643-654. [ Links ]
PINEGAR, J.M. & WILBRICHT, L. 1989. What managers think of capital structure theory: A survey. Financial Management, 18(4):82-91. [ Links ]
ROUSSEAU, P.L. & KIM, J.H. 2008. A flight to Q? Firm investment and financing in Korea before and after 1997 financial crises. Journal of Banking and Finance, 32(7):1416-1429. [ Links ]
STRONG, J.S. & MEYER, J.R. 1990. Sustaining investment, discretionary investment, and valuation: A residual funds study of the paper industry. In Asymmetric Information, Corporate Finance, and Investment, 127-148 (ed.) Hubbard, R.G. Chicago, IL: University of Chicago Press. [ Links ]
VOGT, S.C. 1994. The cash flow/investment relationship: Evidence from U.S. manufacturing firms. Financial Management, 23(2):3-20. [ Links ]
WORLD ECONOMIC FORUM (2014). The global competitiveness report 2014-2015. Geneva: World Economic Forum. [ Links ]
Accepted: March 2016

