


Servicios Personalizados
Articulo
 Inglés (pdf)
 Articulo en XML
 Referencias del artículo
Indicadores

Links relacionados
-
 Citado por Google
 -
 Similares en Google
Compartir

 Permalink
South African Journal of Economic and Management Sciences
versión On-line ISSN 2222-3436
versión impresa ISSN 1015-8812
S. Afr. j. econ. manag. sci. vol.19 no.3 Pretoria 2016
http://dx.doi.org/10.17159/2222-3436/2016/v19n3a4
ARTICLES
Art Investment in South Africa: Portfolio diversification and art market efficiency
Ferdi Botha; Jen Snowball; Brett Scott
Department of Economics & Economic History Rhodes University
ABSTRACT
Art has been suggested as a good way to diversify investment portfolios during times of financial uncertainty. The argument is that art exhibits different risk and return characteristics to conventional investments in other asset classes. The new Citadel art price index offered the opportunity to test this theory in the South African context. Moreover, this paper tests whether art prices are efficient. The Citadel index uses the hedonic regression method with observations drawn from the top 100, 50 and 20 artists by sales volume, giving approximately 29 503 total auction observations. The Index consists of quarterly data from the period 2000Q1 to 2013Q3. A vector autoregression of the art price index, Johannesburg stock exchange all-share index, house price index, and South African government bond index were used. Results show that, when there are increased returns on the stock market in a preceding period and wealth increases, there is a change in the Citadel art price index in the same direction. No significant difference was found between the house price index and the art price index, or between the art and government bond price indices. The art market is also found to be inefficient, thereby exacerbating the risk of investing in art. Overall, the South African art market does not offer the opportunity to diversify portfolios dominated by either property, bonds, or shares.
Key words: diversification, financial instability, art investment, wealth, Citadel art price index
JEL: Z11, G10
1 Introduction
Portfolio diversification is widely accepted as an effective strategy to reduce the risk of investment for both businesses and households (Teresiene & Paskevicius, 2009; Hagin, 2003) - a strategy also emphasised in South African media reports (Greeley, 2013; Kerrigan, 2013). One such proposed investment option is fine art, which was found to be an effective portfolio diversification strategy in Australia during the financial crisis (Higgs, 2012).
The art market is unlike any other market, from its price discovery and risk and returns to the effect of a consumption component on investment demand, and may thus offer an opportunity for such diversification. When deciding where to invest, comparing conventional assets such as bonds and equities can be done easily, as information on their prices and returns is readily available. Art, on the other hand has very little intrinsic value and its value can change depending on individuals' preferences (Goetzmann, Renneboog, & Spaenjers, 2009:2). In addition to being an investment, art may also have a consumption value component in the form of a "utility dividend" - the pleasure, and perhaps prestige, that is derived from art ownership (Mandel, 2009).
Frey and Eichenberger (1995) argue that media reports have given the impression that art investment offers high returns. The rapid increase of art prices in the 1980s and 2000s along with recent art price records being broken all fuel this idea (Renneboog & Spaenjers, 2013). However, due to the inelastic supply and luxury good status of fine art, prices can vary greatly depending on taste and current fashions. Demand for art, and the willingness to spend by the wealthy, are thus the main determinants of art market activity (Goetzmann et al., 2009; Ait-Sahalia, Parker &Yogo, 2004).
In South Africa, the investment company, Citadel, released an art price index in 2011 to provide more information to investors and give them the ability to compare art investment to other kinds of investment. The index covers the period from 2000 to 2013. South Africa's local art market is small compared to the world market but has seen some substantial growth in the past few years, especially with the establishments of new art fairs and galleries. It has a modest number of famous artists that have realised international fame and substantial commercial success, but this does not mean that there are not lucrative opportunities for investment. This paper seeks to discover whether art is a good way to diversify an investment portfolio by analysing the Citadel art price index in relation to movement of the FTSE/JSE All share index, the ABSA house price index, and the South African government bond index. In addition, given the structure of art markets and the higher risk implications of insider information often present on reserve prices (David, Oosterlinck & Szafarz, 2013), the paper also explores whether South African art prices are efficient.
2 Art and investment: Theory of the art market
Art indices are released around the world so that the anomalies that exist in art markets along with investment behaviour can be better understood. When observing the art market one is struck by two major difficulties: firstly the diversity of products offered, and secondly the lack of trading, which means that trends become difficult to predict (Renneboog & Spaenjers, 2013:2). However there are methods that scholars have adopted to overcome these problems. With a hedonic regression, artworks are "valued for their utility-bearing characteristics" and therefore have the ability to control for quality changes between different works through "attributing implicit prices to specific value-adding characteristics" (Renneboog & Spaenjers, 2013:6). From there the implicit prices of the identifying characteristics are estimated and translated into dummy variables that will help explain the eventual price (Fase, 1996:651). The implicit prices of these characteristics are used to estimate regression coefficients and are "deducted from the effective price of a painting" with the difference averaged annually to create the price of an "ordinary" painting (Fase, 1996:652).
The prices of these ordinary paintings are then captured along with the addition of a time dummy which produces the hedonic price index (Fase, 1996:652). The most challenging part of creating a hedonic price index is identifying which characteristics will have the greatest impression on the price (Renneboog & Spaenjers, 2013:6). The most commonly used characteristics are easy to measure and easy to observe, for example, the artist, medium, size and the auction house the work was sold from while the living status and signature of the artist have been known to be used where appropriate (Renneboog & Spaenjers, 2013:6).
The accuracy of each individual characteristic is important. A study by Higgs and Worthington (2005:122) shows that price was increased if the artist was deceased, if it was a larger work, whether works were in acrylic or oils, and if the work was sold at Christies or Sotheby's. Lower prices were associated with small etchings or charcoal works created by living artists sold at smaller auction houses (Higgs & Worthington, 2005:122).
The advantages of the hedonic method are that differences in prices between paintings and price movements are easily distinguished and all auction data available is used (Fase, 1996:652). The disadvantages are the assumption that a few characteristics, which do not include talent or artistic quality, are able to capture such large variability in a fixed component such as price and that these characteristics "do not vary systematically over time" (Ashenfelter & Graddy, 2003:767).
Such indices allow for art to be compared to other conventional investments. When comparing art to conventional assets there are two main indicators that investors will consider - the risk of investing and the return that the investment promises. Risk is the uncertainty about the return an investor will receive on an asset, while return measures how well a person has done by holding that asset. Risk can thus be defined as the probability that the expected return is different from the actual return (Howells & Bain, 2008; Mishkin, 2010). In this case, risk can be estimated by measuring the volatility of returns over the period (where a riskier asset is defined as one where there is a wide dispersion of returns around the mean). An analysis of the variance or standard deviation of the different asset classes thus gives an indication of risk, while mean values show what the investor can expect to earn over time.
However, there are problems when comparing the risk and return on art to conventional assets. Firstly, art has both an investment and consumption component to it. Secondly, as Frey and Eichenberger (1995:209) identified, transaction costs, taxation, financial comparisons and data problems are major drawbacks in studies on risk and return in the art market. These problems mean that the accuracy of comparisons between art and other investment vehicles can bequestioned.
Frey and Eichenberger (1995:209) showed that the majority of studies use data from auctions, as these data are easily accessible and reliable while disregarding other sales from galleries and collectors that may also have important impacts on price movements (Frey & Eichenberger, 1995:209). These missed sales can have a substantial effect on returns. Most studies also disregard high auction fees and transaction costs due to their variability and the difficulty in calculating them, but because of their size, they play a significant role in returns (Frey & Eichenberger, 1995:209). Previous studies have also not taken taxes into account when calculating returns while taxes vary greatly between periods and countries (Frey & Eichenberger, 1995:209).
However, art and art prices, particularly price data from auctions, offer a number of challenges. In an efficient market, prices reflect all available information, making future returns unpredictable. However, as David et al. (2013) point out, art returns calculated from an index of art auction prices certainly do not reflect all available information. This is because the seller fixes a reserve price, which only the seller and the auctioneer know. If the art work does not reach the reserve price, the work is reported as unsold and this information is not incorporated into the index. Using a large database with more than a million observations, David et al. (2013) use four tests to assess the weak form of efficiency in the art market. Results show that the art market is not even weakly efficient, since net returns are highly auto-correlated. Thus, "it is structurally impossible for auction prices to be efficient" (David et al., 2013:24). Potential investors in the art market thus need to be aware of this bias, which benefits those with insider information on reserve prices.
Risk and return on art investment is also atypical in that art has both an investment and consumption component to it. Art is a hybrid of consumption and investment (Mandel, 2009:1657), which makes it difficult to compare the return on standard financial assets to the return on art, since the difference in return may be capturing the value that the owner receives from owning an asset that is also a consumption good (Throsby, 1994:6).
People that purchase art fall into three categories or motives in terms of their purchasing decisions: intrinsic motives (the derivation of aesthetic value from the artwork); as a signal of wealth; for investment purposes; or some combination of these (Mandel, 2009:1653). With reference to intrinsic value, it is difficult to predict varying taste and therefore consumption decisions. The income and wealth of the person who desires the artwork would be the only constraint to the consumption decision (Goetzmann, 1993:1375). Art as a signal of wealth suggests that demand could be seen as a form of conspicuous consumption, or to create a sense of cultural accomplishment through the purchase of artworks, which means that the purchase of the artwork has nothing to do with the intrinsic value of that good (Mandel, 2009:1656; Shipman, 2004:279; Braun & Wicklund, 1989:162). Art purchasing may thus not always conform to consumption theory, which assumes a fully informed and rational economic agent.
The last motive, purchase for investment, also does not follow conventional investment motivation. The fact that art has the potential for resale and that price can fluctuate over time means that art has some of the same features as financial assets, in that it can be used to protect against inflation, as a source of capital gain and a store of wealth (Throsby, 1994:4). However, the way that artworks derive their value is different to other financial investments as art is a durable consumption good as well. Mandel (2009:1654) states that the demand for an artwork as a financial asset will fulfil the need for savings while also proposing that art carries a "utility dividend" which increases the value of art as an asset. Stocks represent a claim on the asset that provides a monetary return to the owner over a period, while an artwork provides a monetary return at the end of the ownership period as well as providing aesthetic value and social prestige to its owner (Goetzmann, 1993:1375). An important impact of this characteristic is that "pure collectors" are insensitive to risk, whereas "pure speculators" are likely to be much more sensitive to risk and may leave the market during periods of price volatility (Boyer, 2011).
Another aspect of an artwork's price within financial markets that distinguishes it from other financial assets is that the supply is fixed (Fase, 1996:650), which means that the price is fully determined by demand (Fase, 1996:650). Therefore at the given price of an artwork the buyer will face a trade-off: "the utility of giving up consumption to buy a piece of art exactly equals its expected conspicuous consumption benefit plus capital return next period" (Mandel, 2009:1657). Thus an art asset's payoff will be increased by the utility dividend and art investors will not need to be compensated by as much in financial terms as conventional financial assets (Mandel, 2009:1662).
Goetzmann et al. (2009:8) conducted a study that sought to discover whether there was a relationship between equity markets and art markets and whether this relationship affected prices and activity in the art market. For their analysis they created an art price index from 1765-2007 of which 1,468 were observed repeat sales. They built an index of British stock price returns for the period that covered dividend return, total return and capital appreciation, which was then compared to the art market returns. Results showed that there is a strong relationship between art and equity markets and that art prices are driven by capital gains and losses (Goetzmann et al., 2009:16). This finding is supported by Chanel's (1995:527) work: "It would appear, then, that financial markets react quickly to economic shocks, and that the profits generated on these markets may be invested in art." These results thus demonstrate that when wealth increases, especially that of the wealthy, the price of art can be expected to increase, creating the possibility of increased art market activity and an art boom (Goetzmann et al., 2009:16).
A similar study on the US art market (Boyer, 2011) supported the finding. In the concurrent time period, Boyer (2011) found that there was a negative relationship between stock market performance and the art price index. She suggests that this may support the "diversity hypothesis", that when stocks perform well, people invest less in art. However, when the stock market index is lagged by two months, its relationship with the art price index is positive.
Mei and Moses (2002) used a repeat sales regression to calculate an index of 4896 sales pairs from 1950 to 2000 for the American art market. Their results showed that the art investment offered better returns than corporate or government bonds, and was less volatile. However, Renneboog and Spaenjers (2013) used a hedonic regression compiled by using more than 10 000 artists, including 1.1 million transactions. They compared the index to other markets for the period 1951 to 2007. Their results showed that art did not perform as well as stocks (S&P 500 and the GDF global equity index) and that the reward to risk ratio was higher for stocks than for art. The art index did however have a better reward to risk ratio than government bond indices.
As is the finding of a number of other studies, David (2014) argues that, except under very specific circumstances, art does not provide a "safe haven" for investment during times of crisis. She constructed an art price index for the French art market during, and just after the WW1 period (1911-1925). She finds that, in terms of risk weighted return, gold, real-estate, bonds and stocks, outperformed art.
Frey and Eichenberger (1995) argue that, rather than comparing art investment to bonds and equities, they should be compared to assets like land and property, which are closer substitutes due to similar liquidity issues, holding periods and, in many countries, benefit from special tax treatment.
3 Data and method
The four variables used in this paper arethe FTSE/JSE all share index, the Citadel art price index, the Absa house price index, and the South African government bond index. Data for the all share index and the bond index were obtained from the South African Reserve Bank website. The Absa house price index was obtained directly from Absa Bank. Similarly, the Citadel art price index was obtained directly from Citadel. One of the main reasons for the release of the Citadel art price index was an identification of the need to help improve investors' search for assets that provided the ability "to improve risk-adjusted returns and to diversify their financial portfolios" (Citadel, 2011:4). Citadel thus adopted a hedonic regression as they believed it gave their index the ability to overcome two key diafficulties when evaluating the art market: the diversity of artworks and the infrequency of trading (Citadel, 2011).
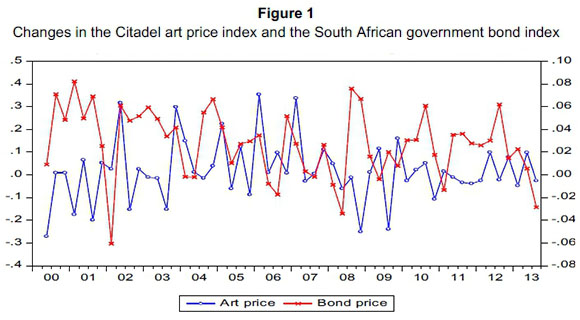
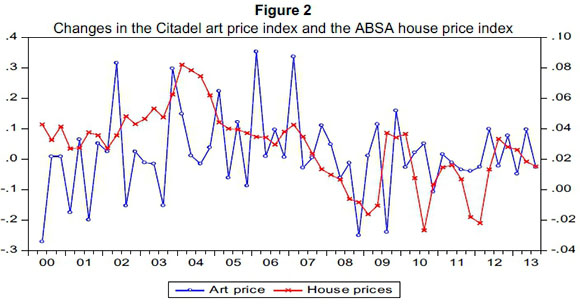
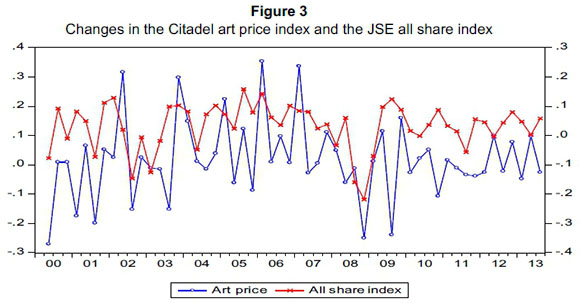
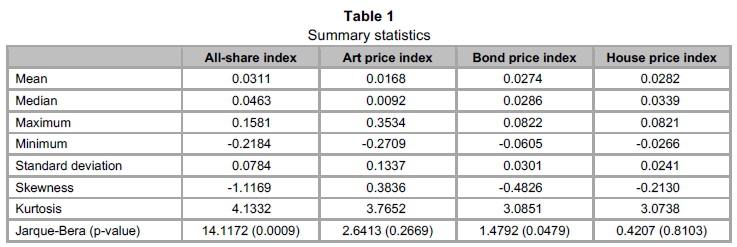
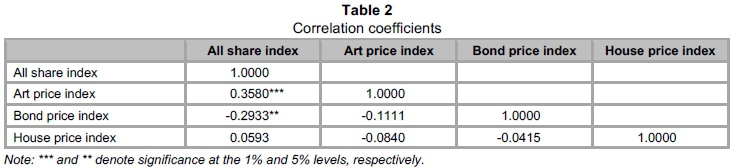
Citadel's observations start from 2000 and the sample was drawn from the top 100, 50 and 20 artists by sales volume, argued to be an appropriate outline of the general market (Citadel, 2011:10). The top 100 included 17 997 auction sales representing 61 per cent of total trades and 87 per cent of total sales revenue (Citadel, 2011:10), giving approximately 29 503 total auction observations. All data are quoted quarterly from the period 2000Q1 to 2013Q3. This period was chosen due to the availability of the art price index for this period. The logged return values of the series are presented in figures 1 to 3. The graphs indicate that the art price index is a lot more volatile relative to the other asset classes. Furthermore, art prices fell sharply during the global financial crisis, and changes in the all-share index tend to lead changes in the art price index slightly. Table 1 reports some basic descriptive statistics of the four indices. While the mean return is highest for the all-share index, the art price index is the most volatile of the various asset classes. Thus, investing in art appears to be the riskiest option. Table 2 contains correlation coefficients between the variables of interest. The share prices and art prices are significantly positively correlated, thereby suggesting little value for investing in art as opposed to shares.
This paper estimates a simple recursive vector autoregression (VAR) of the art price index, the Absa house price index, the South African government bond index, and JSE all share index. In addition, a dummy is included to control for the global financial crisis of 2008. This dummy is set to one for the period 2008Q3 to 2012Q4, and zero otherwise. This period was selected to coincide with a sharp fall in long-term government bond yields in the US and European Union (2008Q3) and the later reversal of such yields (2012Q4). Flowing from the VAR results, additional analyses include variance decomposition, impulse responses, and Granger causality tests. Variance and standard deviations are also used to comment on volatility, as an indicator of risk. In order to comment on the efficiency of art returns, this paper follows the approach of David et al. (2013) by using the net return on art for this purpose, defined as the art return minus the risk-free rate that is proxied by the 3-month TB rate.
Three approaches are adopted to test for weak efficiency, namely the Ljung-Box g-statistic to test for first-order autocorrelation, the Lo and MacKinlay (1988) variance-ratio test examining the null hypothesis of a random walk, and the BDS test with bootstrapped probabilities for return independence (Brock et al., 1996). The Ljung-Box g-statistic, rejection of the null hypothesis of no first-order autocorrelation (i.e. H0: g = 0) would imply significant first-order autocorrelation of returns and hence market inefficiency. The BDS test explores whether art returns are independently and identically distributed. Rejection of the null hypothesis would imply that returns are not independent (Brock et al., 1996). The variance ratio test is concerned with whether "the variance of the price difference of order q equals q times the variance of the first difference" (David et al., 2013:24). Consistent with David et al. (2013), the test is computed for 2 < q < 9.
4 Results
The Akaike (AIC) and Schwarz (SIC) lag length information criteria suggested the use of one lag as appropriate for the VAR, the results of which are reported in Table 2. Results show that the lagged all share index within the art price index equation is positive and statistically significant, indicating that the art price index rises by about 0.67 per cent for each percentage increase in the all share index.
The lagged house price index is positively but not significantly related to the art price index. This also confirms expectations by Frey and Eichenberger (1995) that art investment may be more like illiquid land and property investments. The lagged government bond index, moreover, is negatively related to the art price index. Though investment in art could thus potentially offer an effective portfolio diversification strategy for portfolios dominated by South African government bonds, the relationship is not statistically significant.
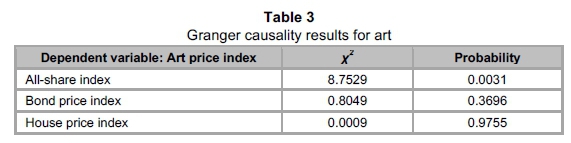
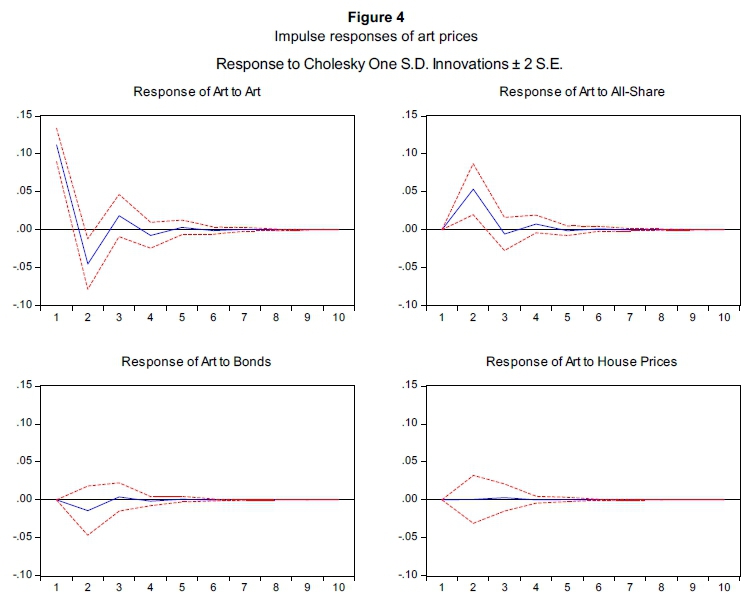
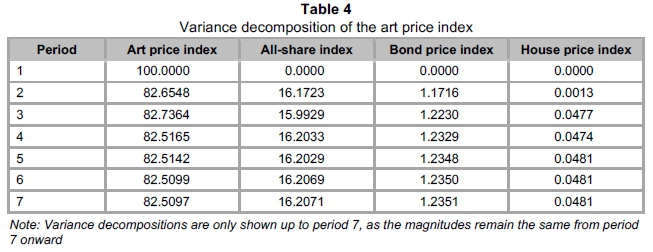
Impulse responses (Figure 4) show that art prices react positively to a shock in the all-share index, which dies out after roughly five quarters. Of note is that the contemporaneous impact of the all-share index on the art index is statistically significant for about two quarters. A Granger causality test further reveals that changes in the all-share index Granger cause changes in the art price index (p < 0.01), but bond- and house prices do not Granger cause changes in the art price index (Table 3). In addition, variance decomposition analysis showed that, after seven quarters, the art price index explains roughly 82 per cent of its own variance, while the all-share index explains about 16 per cent of the variation in art prices (Table 4).
As a whole, therefore, when there are increased returns on the stock markets in the preceding period and wealth increases, there is a change in the Citadel art price index in the same direction. This finding is consistent with Goetzmann et al. (2009:8), who reported that there is a strong relationship between art and equity markets and that art price changes are driven by capital gains and losses. Since art is a luxury good it would be expected that, when people become wealthier they invest in art as a means of savings, or as a status good (Braun & Wickland, 1989:163).
Regarding the weak efficiency of net returns on art, the g-statistic of 48.3 (p < 0.001) indicates significant first-order autocorrelation. For all values of q between 2 and 9, the variance ratios are significantly different from one, with p-values ranging from 0.0050 to 0.0473, thereby rejecting the random walk hypothesis. Finally, the BDS test suggests that the net art returns are not independent, as the null of return independence is strongly rejected (p < 0.001). These findings therefore indicate that, similar to the findings of David et al. (2013), the art market is not efficient.
5 Conclusion
This paper set out to test whether art is a good way to diversify an investment portfolio, by analysing the changes in the Citadel art price index in relation to the movement of the FSTE/JSE All Share Index, the Absa house price index, and the South African government bond index. Results show that, when there are increased returns on the stock markets in the preceding period and wealth increases, there is a change in the Citadel art price index in the same direction. As found in other studies (Goetzmann et al., 2009; Braun & Wickland, 1989) this seems to indicate that growing wealth as a result of higher returns on the FTSE/JSE results in more investment in art. Art does thus not seem to offer a good way to reduce risk in an investment portfolio dominated by shares. Although the art price index is negatively related to the South African government bond price index, thereby suggesting that art offers a way of diversifying a bond portfolio, the relationship is not significant. Of the four asset classes, investing in art seems to be the most risky, followed by shares. The riskiness of art as investment choice is also reinforced by the fact that the art market is found to be inefficient.
Some limitations are worth noting. First, the Citadel art price index only includes auction data and thus can create a biased view of the art market. By not including gallery sales within the index, the index leaves out a large portion of the art market (Frey & Eichenberger, 1995). Secondly, as dividends are not included in the calculation of the FTSE/JSE all share index; a large portion of return on investment is thus excluded. Avenues for future research could include acquiring sales data from galleries to provide a more comprehensive overview of the South African art market. Being able to compare the South African gallery system to the auction system may enable an analysis on the efficiency of the local auction system.
Acknowledgements
The paper benefited from the comments of an anonymous referee. An earlier version of this paper was published as Economic Research Southern Africa (ERSA) Working Paper No. 537 under the title "Art investment as a portfolio diversification strategy in South Africa." The financial support of ERSA is acknowledged.
References
AIT-SAHALIA, Y., PARKER, J.A. & YOGO, M. 2004. Luxury goods and the equity premium. Journal of Finance, 59(6):2959-3004. [ Links ]
ASHENFELTER, O. & GRADDY, K. 2003. Auctions and the price of art. Journal of Economic Literature, 41(3):763-776. [ Links ]
BOYER, C. 2011. The market for fine art and the economy. Journal of Wealth Management, 13(4):77-83. [ Links ]
BRAUN, O.L. & WICKLUND, R.A. 1989. Psychological antecedents of conspicuous consumption. Journal of Economic Psychology, 10(2):161-163. [ Links ]
BROCK, W., DECHERT, D., SHEINKMAN, J. & LEBARON, B. 1996. A test for independence based on the correlation dimension. Econometric Reviews, 15(3):197-235. [ Links ]
CHANEL, O. 1995. Is art market behaviour predictable? European Economic Review, 39(3):519-527. [ Links ]
CITADEL, 2011. Constructing an art price index for South Africa. Available at: http://www.citadelartpriceindex.co.za/ENG/SiteCollectionImages/Reports/CitadelArtPriceIndex_FullReport2011.pdf [accessed April 2013]. [ Links ]
DAVID, G. 2014. Is art really a safe haven? Evidence from the French art market during WW1. Centre Emile Bernheim (CEB) Working Paper 14/025. Available at: https://dipot.ulb.ac.be/dspace/bitstream/2013/176148/1/wp14025.pdf [accessed December 2014]. [ Links ]
DAVID, G., OOSTERLINCK, K. & SZAFARZ, A. 2013. Art market inefficiency. Economics Letters, 121:23-25. [ Links ]
FASE, M.M.G. 1996. Purchase of art: Consumption and investment. De Economist, 144(4):649-652. [ Links ]
FREY, B.S. & EICHENBERGER, R. 1995. On the return of art investment return analyses. Journal of Cultural Economics, 19(3):207-213. [ Links ]
GOETZMANN, W.N. 1993. Accounting for taste: Art and the financial markets over three centuries. American Economic Review, 83(5):1370-1376. [ Links ]
GOETZMANN, W.N., RENNEBOOG, L. & SPAENJERS, C. 2009. Art and money. NBER Working Paper No. 15502. Massachusetts: National Bureau of Economic Research. [ Links ]
GREELEY, B. 2013. U.S. homeowners are repeating their mistakes. BusinessWeek. Available at: http://www.businessweek.com/articles/2013-02-14/u-dot-s-dot-homeowners-are-repeating-their-mistakes [accessed October 2013]. [ Links ]
HAGIN, R. L. 2003. Investment management: Portfolio diversification, risk, and timing. Wiley Finance, Vol 235, Wiley Publishers. [ Links ]
HIGGS, H. 2012. Australian art market prices during the global financial crisis and two earlier decades. Australian Economic Papers, 51(4):189-209. [ Links ]
HIGGS, H. & WORTHINGTON, A. 2005. Financial returns and price determinants in the Australian art market, 1973-2003. Economic Record, 81(253):113-122. [ Links ]
HOWELLS, P.G. & BAIN, K., 2008. The economics of money, banking andfinance: A European text. London: Pearson Education. [ Links ]
KERRIGAN, I. 2013. Business owners need to think about diversifying their investments. Seattle Business Magazine. Available at: http://seattlebusinessmag.com/business-corners/family-business/business-owners-need-think-about-diversifying-their-investments [accessed October 2013]. [ Links ]
LO, A.W. & MACKINLAY, A.C. 1988. Stock market prices do not follow random walks: Evidence from a simple specification test. Review of Financial Studies, 1:41-66. [ Links ]
MANDEL, B.R. 2009. Art as an investment and conspicuous consumption good. American Economic Review, 99(4):1653-1662. [ Links ]
MEI, J. & MOSES, M. 2002. Art as an investment and the underperformance of masterpieces. American Economic Review, 92(5):1656-1668. [ Links ]
MISHKIN, F.S. 2010. The behaviour of interest rates. In: The economics of money, banking andfinancial markets (9th ed.) Boston, United States of America: Pearson:91-92. [ Links ]
RENNEBOOG, L. & SPAENJERS, C. 2013. Buying beauty: On prices and returns in the art market. Management Science, 59:36-53. [ Links ]
SHIPMAN, A. 2004. Lauding the leisure class: Symbolic content and conspicuous consumption. Review of Social Economy, 62(3):277-289. [ Links ]
TERESIENE, D. & PASKEVICIUS, T. 2009. Portfolio construction and management during the period of financial crisis. Economics and Management, 14:195-201. [ Links ]
THROSBY, D. 1994. The production and consumption of the Arts: A view of cultural economics. Journal of Economic Literature, 32(1):1-29. [ Links ]
Accepted: February 2016

