


Services on Demand
Article
 English (pdf)
 Article in xml format
 Article references
Indicators

Related links
-
 Cited by Google
 -
 Similars in Google
Share

 Permalink
South African Journal of Economic and Management Sciences
On-line version ISSN 2222-3436
Print version ISSN 1015-8812
S. Afr. j. econ. manag. sci. vol.19 n.2 Pretoria 2016
http://dx.doi.org/10.17159/2222-3436/2016/v19n2a9
ARTICLES
An estimation of the impact of the 2012 platinum-sector strike on the South African economy
Johannes C. Jordaan
Bureau of Market Research, University of South Africa
ABSTRACT
A Leontief-type economic-impact model for 2012 is used to estimate the potential impacts, in percentage terms, of the 2012 platinum-sector strike on the South African economy. Although it is impossible to incorporate and calculate all the potential impacts, such a model can provide an estimation based on sound statistics and methodologies. Understanding the potential, wider economic impacts of strike action can lead to valuable insights for policymakers, businesses and workers. This will hopefully result in improved policies, as well as enriched negotiations to find solutions to deadlocks in wage negotiations before such deadlocks progress to strike action. Data from the Department of Labour (DoL) shows that 103,155 workers participated in the strike in the metal-ores sector during 2012, and company annual reports indicate that this strike action lasted seven weeks on average. Estimates show that the monetary value of ounces lost by the platinum-related mining industry as a result of lost production during the strike periods amounted to R10.6 billion. Two scenarios are estimated that result in a gross domestic product (GDP) loss for 2012 of 0.53 per cent or R16.5 billion (Scenario 1 ), and of 0.49 per cent or R15.5 billion (Scenario 2). This implies that GDP growth could have been 3 per cent for Scenario 1 and 2.97 per cent for Scenario 2, instead of the actual GDP growth of 2.47 per cent. Exports could have been R9.05 billion higher for Scenario 1 and R8.4 billion higher for Scenario 2. The current-account deficit for 2012 could have been reduced to 4.93 per cent of GDP for Scenario 1 and to 4.9 per cent for Scenario 2, as against the actual deficit of 5.23 per cent. Tax income could have been R3.8 billion higher for Scenario 1 and R3.6 billion higher for Scenario 2. As a result, the government's budget deficit could have been reduced to 5.13 per cent instead of 5.26 per cent. Expressing employment opportunities lost in terms of annual employment opportunities lost as a result of lost activity shows that this represents almost 25,000 employment opportunities for Scenario 1 and almost 23,300 such opportunities for Scenario 2.
Key words: South Africa, strikes, unemployment, economic impact
JEL: J50, 68, O11
1 Introduction
Given South Africa's high unemployment rate of around 25 per cent, according to the narrow definition of "unemployment" (Statistics South Africa, 2014), there is a desperate need for the South African economy to create and grow employment opportunities. This implies that close to five million active job seekers are not being utilised in the economy. With such a high unemployment rate, strikes by workers are even more worrying, especially if such strikes also impact on the rest of the economy. The South African Constitution as well as labour legislation protect the right to form unions and to strike. However, strike action reduces not only striking workers' income and production or service delivery, but also has a negative impact on the economy as a whole and on general confidence. Understanding the potential, wider economic impacts of strike action can provide valuable insights for policymakers, businesses, workers and trade unions to resort to strike action only as the very last resort. The present research will hopefully result in improved policies, as well as enriched negotiations regarding the adverse impacts of strikes so that solutions to deadlocks in wage negotiations can be pursued before such deadlocks progress to strike action. The research question, therefore, is whether the 2012 platinum-sector strike had a significant impact on the South Africa economy.
The next section of this paper provides the background to the research, followed by the statement of the problem and a discussion of the economic-impact model used. This is followed by a literature review and the background to strike-related data in South Africa. The importance of the mining industry is highlighted in Section 6, and the estimated results are given and discussed in Section 7. Policy implications are discussed in Section 8, which section is followed by the conclusion.
2 Background
According to the World Economic Forum's (WEF) Global competitiveness report 2013-2014, South Africa was rated among the worst with regard to labour-related factors. These ratings are produced from surveys that include 148 countries. Although South Africa received an overall rating of 53, labour-related factors received very poor ratings. For instance, cooperation in labour-employer relations received a rating of 148, flexibility of wage determination a rating of 144, hiring-and-firing practices a rating of 147, pay and productivity a rating of 142, and overall labour market efficiency a rating of 116. These ratings have also been confirmed by other organisations. According to the IMD World Competitiveness Center, worker motivation in companies in South Africa was the fifth-lowest out of 60 countries measured, and availability of skilled labour was ranked last. South Africa was ranked third-last in respect of the implementation of apprenticeships, and the education system was ranked last in meeting the needs of a competitive economy (IMD World Competitiveness Center, 2014).
South Africa also performed poorly with respect to a number of fundamental supply-side factors that are needed to create a quality workforce. These included quality of mathematics and science education (148th), quality of the education system (146th), and quality of primary education (133rd). Similar trends are also presented in other international surveys. For example, the overall level of statistical capacity of South Africa, as indicated by data from the World Bank's development indicators, shows that South Africa dropped from 91.1 in 2007 to 74.4 in 2014 (in terms of an index rating of 100).
To further emphasise this, as part of the WEF's Executive Survey conducted in 2014, respondents were asked to indicate the most problematic factors with regard to doing business (the list had a total of 16 factors that had to be ranked from most to least problematic). In the case of South Africa, an inadequately educated workforce (19.7 per cent of responses) was ranked the most problematic, followed by restrictive labour relations (18.5 per cent), inefficient government bureaucracy (16.4 per cent), corruption (9 per cent), policy instability (6.1 per cent), and poor work ethics of the national labour force (3.7 per cent).
One of the factors contributing to these poor labour-related rankings was strike action. Wilkinson and Chiumia (2013) mention, for example, that the South African spring is also sometimes called "strike season" owing to the regular occurrence of strikes during this period. However, according to Bhorat, Naidoo and Yu (2014), strike action in South Africa is not remarkably different from similar activity in other comparable emerging countries.
South Africa experienced a significant public-sector strike in 2010 in which, according to data from the Department of Labour (DoL, 2011), 1,071,003 public, administration and defence employees were involved, with 18,866,531 work hours lost. However, it does not seem as if this strike had as big a negative impact on economic growth when compared with strike action in the mining, manufacturing and transport sectors. Frequent strike action since 2012, particularly in the mining sector, has given rise to the perception that the actions of the country's labour unions have the potential to lead to wider social unrest. This has led some to argue that strike action may be an indicator of greater challenges with regard to South Africa's macroeconomic policy framework and broader institutions. This has also been reflected in the downgrading of South Africa's long-term foreign and local currency credit ratings by Fitch and by Standard & Poor's (Bhorat et al., 2014).
According to the African Rainbow Minerals (ARM) mining company, investors have also voiced concerns about the security of their investments in the mining industry. This was especially the case after reports about nationalisation, excessive taxes, labour unrest, and the tragic events at Marikana in 2012 (ARM, 2013; DoL, 2012). It should be noted that recurring industrial disputes are an indication of the failure of social dialogue between the parties involved. However, persistent inequalities remain at the root of labour problems, and government policies seem ineffective in meaningfully improving education and skills levels needed to benefit the poor socio-economically.
Even if there are sound reasons for strike action and even if strikes in South Africa are not remarkably different from that in similar emerging markets, as claimed by Bhorat et al. (2014), such action still impacts negatively on the economy. Without any intervention with respect to the unresolved and underlying factors, it is also envisaged that protected and unprotected industrial action will continue to occur and that, as a result of this, the economy will continue to be negatively affected. This, in itself, creates a vicious circle where the economic growth, investment, confidence and tax income needed to uplift communities are not fully realised as a result of strike action. Consequently, there is a need to better understand the impact of strike action on the economy so that measures can be taken before such action takes place.
3 Statement of the problem
Strike action can have a devastating impact on an economy and its people. It is not only the striking sector that is impacted, but also other connected sectors in the economy. However, calculating the full economic impact of strike action is very difficult, if not impossible. Apart from the direct losses in terms of production or services, lower dividends for shareholders, and less labour income for workers, the economy is negatively affected by a number of other indirect impacts that are not easily quantifiable. These include impacts due to exchange-rate fluctuations and depreciation as a result of strike action and lost production, impacts on inflation due to increasing unit labour costs (and exchange-rate depreciations), potentially higher interest rates due to the higher inflation, etc. Such impacts can also result in a loss of confidence that may lead to lower consumption, lower investment, lower production and lower future growth. Other indirect impacts include higher indebtedness of workers, as they cannot service their debt if they do not earn an income, loss of assets due to sequestration or blacklisting as a result of workers not being able to service their commitments, and, in the end, a lower standard of living.
Although it is impossible to incorporate all the potential impacts when calculating economic impacts, estimation techniques can provide a "best-guess" calculation based on sound statistics and methodologies. Such estimated impacts of labour strikes are also important for policymakers, labour unions and businesses, for they allow such bodies to understand the potential impacts, thereby informing their decisions or enabling them to make policy adjustments. Estimated impacts can also assist economists and analysts to better understand the potential impacts and advise their clients accordingly or assist, for example, in arriving at more accurate annual GDP forecasts.
4 Economic-impact modelling and the selection of models
Typical economic models that can be used to perform economic-impact assessments include econometric systems based on supply-side or demand-side (Keynesian) equations. Other models include dynamic stochastic general equilibrium (DSGE) models, computable general equilibrium (CGE) models, dynamic computable general equilibrium (DCGE) models or Leontief-type models. The latter three models are all based on social accounting matrices (SAMs).
An SAM provides the underlying data that shows the inter-industry relationships that exist within an economy for a specific year. Such a model utilises the accounting relationships to measure the economic activity generated by a change in expenditure, investment or industry output (see the Appendix hereto). Economic-impact analysis is not a precise type of analysis, in that it reflects (amalgamated) industry relationships and not individual or firm-specific relationships.
Although the results produced by CGE and DCGE models can be more precise, the Leontieftype model can be seen as a limiting case of a CGE model in view of the assumption of constant returns to scale. A Leontief-type model is therefore essentially a resource-allocation model which responds to shocks through quantity adjustments and not through price adjustments, as is the case, for example, with CGE models themselves. As a result, the latter models do not incorporate market behaviour and there are no relative prices in these models. The estimation of indirect and induced effects with the aid of the Leontief-type model is also more appropriate in the short run, given the fixed structure of the model. Consequently, only short-term impacts will be analysed in this study. However, according to Poole (1999), the model still manages to provide a surprisingly useful and reliable portrait of the anatomy of production relationships in the economy.
The constant returns to scale Leontief model used in this study is based on a 2012 SAM that was constructed using the 2012 supply and use tables obtained from Statistics South Africa. The National Accounting Matrix (NAM) format and SAM structure have been obtained from a 2009 SAM developed by Davies and Thurlow (2011). Reserve Bank data was also used to populate the NAM.
5 Strike-related data for South Africa
Workers' propensity to strike is obtained from a country's strike intensity, which is measured by the number of strikes per 1,000 workers. This is an easy measurable indicator across countries and sectors. According to Bhorat et al. (2014), striking workers in South Africa constituted 1.1 per cent of all workers in 2003, 7 per cent in 2007, and only 2 per cent in 2011. When comparing strike intensity internationally, only 2.8 per cent of South African workers were involved in strike action in the period 1998 to 2008, a strike intensity similar to that of countries such as Australia, Denmark and Iceland. South Africa has a lesser strike intensity than economies such as those of Italy (6.6 per cent of workers), Spain (7.3 per cent of workers) and Argentina (30.7 per cent of workers). The researchers also found that the average percentage of workdays lost per year in South Africa owing to strikes (3.77 per cent) was lower (during the period 1999-2008) when compared with Brazil (46.4 per cent), India (8 per cent), Nigeria (10.9 per cent), Turkey (19.77 per cent) and the Unites States of America (9.5 per cent) - that is, when considering a selected group of countries. They concluded that their data would seem to suggest that strike action in South Africa was not remarkably different from similar activity in other similar emerging countries. However, Toyota South Africa's chief executive officer argues, for example, that it is important to break the cycle of protracted strike action that results in South Africa's automotive industry being known as an unreliable industry with the world economy. He mentions that, while strike action occurs worldwide, labour action lasting four to eight weeks that brings an entire industry to a standstill is "unheard of (Venter, 2014).
Although the strike intensity and the average percentage of workdays lost due to strikes may not be remarkably different, strike activity seems to have increased since 2008 and has also become more violent. Strike intensity is also not necessarily a good indicator of potential impact on the economy. A strike in the production-related sectors (agriculture, mining and manufacturing) may potentially have a much larger impact on GDP, compared with a strike in the services industry, given the linkages to other sectors and the export earnings lost during the strike.
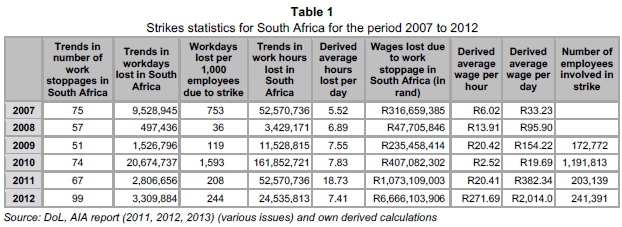
The DoL is responsible for compiling and releasing annual strike data, and does so by way of the annual industrial action (AIA) reports. Such data includes, among others, trends in the number of work stoppages in South Africa, trends in workdays and work hours lost in South Africa due to strikes, workdays lost per 1,000 employees due to strikes, wages lost due to work stoppages, and sectors impacted by strikes. Using this data, the average strike intensity from 2010 to 2012 increased to 3.54 per cent, and the average percentage of workdays lost per year due to strikes increased to 5.76 per cent.
Table 1 shows the strike statistics for South Africa from 2007 to 2012 as given by the DoL. What these statistics reveal is that a total of 3.3 million workdays, 24.5 million work hours and R6.67 billion in wages were lost in 2012. However, although these reports contain valuable information, when examining the data more closely, certain inconsistencies become apparent (e.g. when calculating average hours lost per day, the average wage per day and the average wage per hour). For example, according to the data, striking workers worked 18.73 hours per day on average in 2011, while striking workers earned only R2.52 per hour (R19.69 per day) in 2010 compared with striking workers who earned R271.69 per hour (R2,014 per day) in 2012. When enquiring about the results, the present researcher was informed by the DoL that caution should be exercised when considering wages lost due to work stoppages, and that the LRA 9.2 forms require employers to estimate and indicate the wages lost due to company strikes. Given the inconsistencies, these figures are questionable and information must therefore be carefully selected.
In view of the inconsistencies indicated, statistics need to be cross-checked with other data sources in order to test the validity. Average wages per sector can, for example, be calculated using data from Statistics South Africa. Using, for instance, the December 2012 quarterly employment statistics (QES) from Statistics South Africa (2013b), workers in South Africa earn R14,386 per month on average. Multiplying this by the 3.3 million workdays lost in 2012, and an annual number of 260 workdays, results in a total amount lost due to stoppages of R2.2 billion, R4.47 billion lower compared with the R6.66 billion estimated by the DoL. Given that miners earned only R5,656.6 per month1 on average, this implies that either the number of days or the number of employees is incorrect.
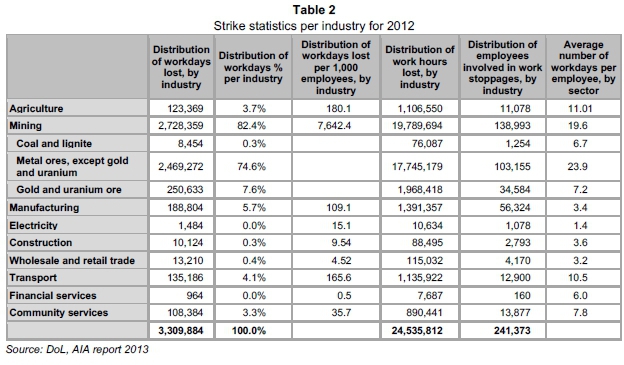
Table 2 shows the strike statistics per industry for 2012, with a disaggregation of the mining industry. Metal ores, mainly platinum, accounted for 74.6 per cent of the strikes in 2012 – if measured according to workdays lost. According to these statistics, an estimated total of 2.47 million workdays were lost in the metal ores (mainly platinum) mining industry, involving 103,155 employees.
6 Importance of the mining industry in South Africa
Mining is a very important sector for South Africa, and although its share was only 8.6 per cent of GDP in 2012 (at current prices) and 7.06 per cent with respect to total compensation of employees, it accounted for 33.9 per cent of total exports (Stats SA, 2014a). Gold accounted for the largest share of exports at 8.7 per cent (R71.05 billion), with platinum's share being 7.9 per cent (R65.05 billion) during 2012 (DTI: Trade data). Prolonged strikes in any of these sectors will thus have a significant impact on the economy.
Monthly export sales and volume of mining production are shown in Figure 1. Sales and exports reveal a very close correlation that points to a large percentage of mined ounces being exported. Sales and export data show a clear collapse during the international financial crisis in 2009 after monthly sales had reached a peak of RIO.3 billion in June 2008. The reduction in volumes mined and in sales of platinum-group metals (PGMs) due to the strike action in 2012 is clearly visible from the data.
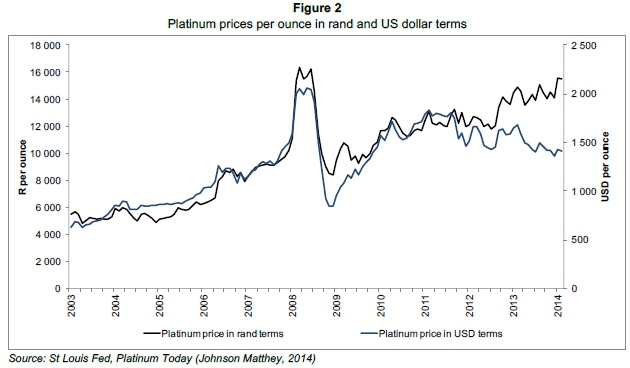
Platinum prices per ounce in rand and United States dollar (USD) terms are shown in Figure 2. These prices reached a height in rand terms of R 16,3 85 per ounce in March 2008, but almost halved to R8,438 per ounce in December 2008 as a result of lower demand due to the international financial crisis. Platinum prices showed a volatile recovery during 2009 and 2010, with prices in rand terms revealing a steady increase owing to currency depreciation and almost reaching the heights of early 2008.
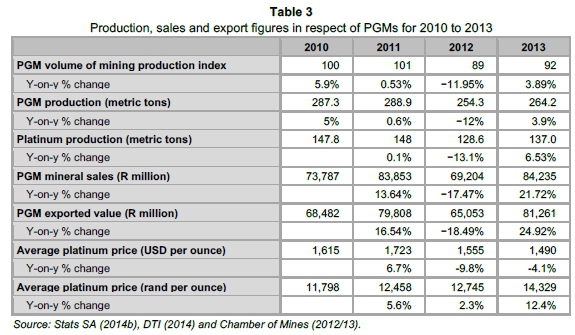
Data from the Chamber of Mines shows that the production of PGMs was 12 per cent lower in 2012 compared with 2011 (Table 3). This is a reduction of 34.6 metric tons or 1,112,415.8 troy ounces. Sales of PGMs amounted to R69.2 billion in 2012 compared with R84.2 billion in 2013 and R83.9 billion in 2011. This indicates the lower revenue for 2012, which, on average, was about R14.5 billion lower compared with 2011 and 2013, or about RIO.9 billion lower if adjusted by the platinum price increases in 2013. Exports were 18.5 per cent lower in 2012 compared with 2011. A total of R65.1 billion in PGM was exported in 2012 compared with R81.3 billion in 2013 and R79.8 billion in 2011. The price of platinum in rand terms was only 2.3 per cent higher in 2012 compared with 2011 (an average of R12,745 per ounce in 2012 compared with R12,458 an ounce in 2011). Platinum prices in rand terms were 12.4 per cent higher in 2013, mainly as a result of the depreciation of the rand.
Estimates of the amount of PGM ounces lost during the strike activity of 2012 differ. According to the annual report of the Chamber of Mines (2012/13), about 750,000 ounces of platinum output were lost in 2012 due to legal and illegal strike action, safely stoppages and mine closures. However, Sucden Financial (2014) states that data from the Chamber of Mines shows that 544,121 ounces of platinum output were lost during the 2012 strikes.
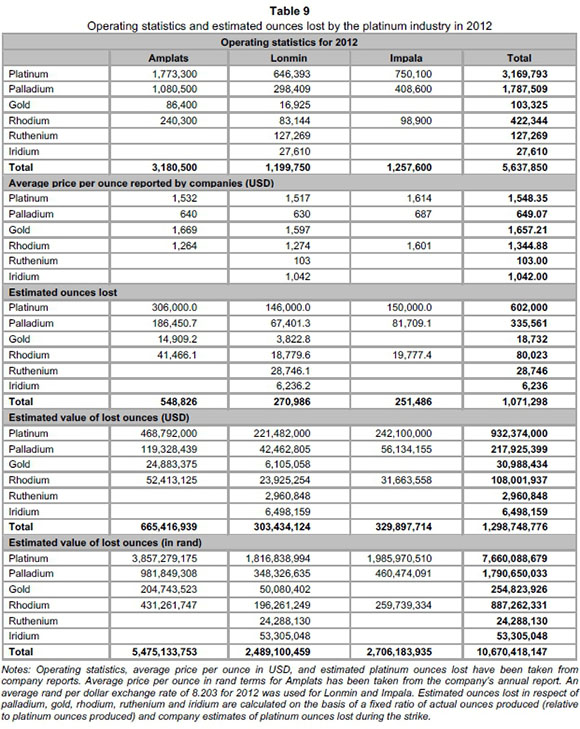
Estimates from the platinum-mining companies affected by the strikes in 2012, and which reported on the impact of the strikes, are shown in Table 4. According to the annual reports of Anglo American Platinum (Amplats), Lonmin and Impala Platinum, estimated losses with regard to platinum production amounted to 602,000 ounces. The companies did not report on losses in respect of other PGMs, but, by using data from their annual reports (see Appendix hereto), it is estimated that almost 469,300 ounces of output of other PGMs were lost. This results in a total estimated amount of R10.6 billion of ounces lost as a result of the strikes. Such amount is less when compared with the R10.9 billion calculated on the basis of the adjusted production statistics, but it can be regarded as more accurate in that it is reflected in the annual reports. As a result, this amount is used in the economic-impact model to estimate the potential direct impact.2
Although the mineworkers' strike was mainly an attempt to obtain higher real wages, mineworkers do not earn the lowest wages in South Africa. According to the 2012 Labour market dynamics survey (Stats SA, 2013a), the largest percentage of non-ferrous metal ore mineworkers (22.5 per cent of these workers) earned a monthly wage of between R6,001 and R8,000. This can be compared with the average monthly wage for the largest percentage of employees in South Africa who earned between R1,001 and R1,500 (17.8 per cent of all workers).
Research by Bohlmann, Dixon, Rimmer and Van Heerden (2014) estimates that the 2014 platinum strike (which continued for five months) decreased real GDP growth by at least 0.7 per cent. The authors used a dynamic CGE model for their research which shows that the strike could have long-lasting negative impacts on the South African economy, especially as a result of lower investment.
7 Estimated economic impact of the 2012 strike in the platinum sector
The results are based on the estimated R10.6 billion3 lost production of equivalent refined ounces during the seven-week strike in 2012. The economic-impact model is "shocked" with the estimated loss in production in respect of "other mining"4. Two scenarios are generated: the first scenario shows the unadjusted results, while, in the second scenario, an adjustment has been made in the remuneration of employees in view of the fact that not all employees participated in the strikes and, as a result, a portion of the wages still had to be paid even though the mines were closed. The model shows the following impacts:
7.1 GDP and industry impact
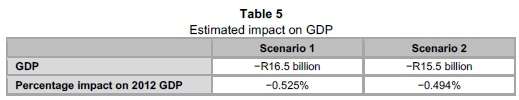
The GDP for the first scenario shows an estimated reduction as a result of the strike action of 0.525 per cent or R16.495 billion (the GDP in 2012 was R3.138 trillion). Such impact is calculated using the value-added approach. This implies that the GDP growth for 2012 could have been 3.0 per cent instead of the 2.47 per cent following the 3.6 per cent GDP growth in 2011.
Scenario 2 shows a reduction in GDP of R15.505 billion (0.494 per cent of the 2012 GDP). This scenario implies that the GDP growth for 2012 could have been 2.97 per cent instead of the actual 2.47 per cent.
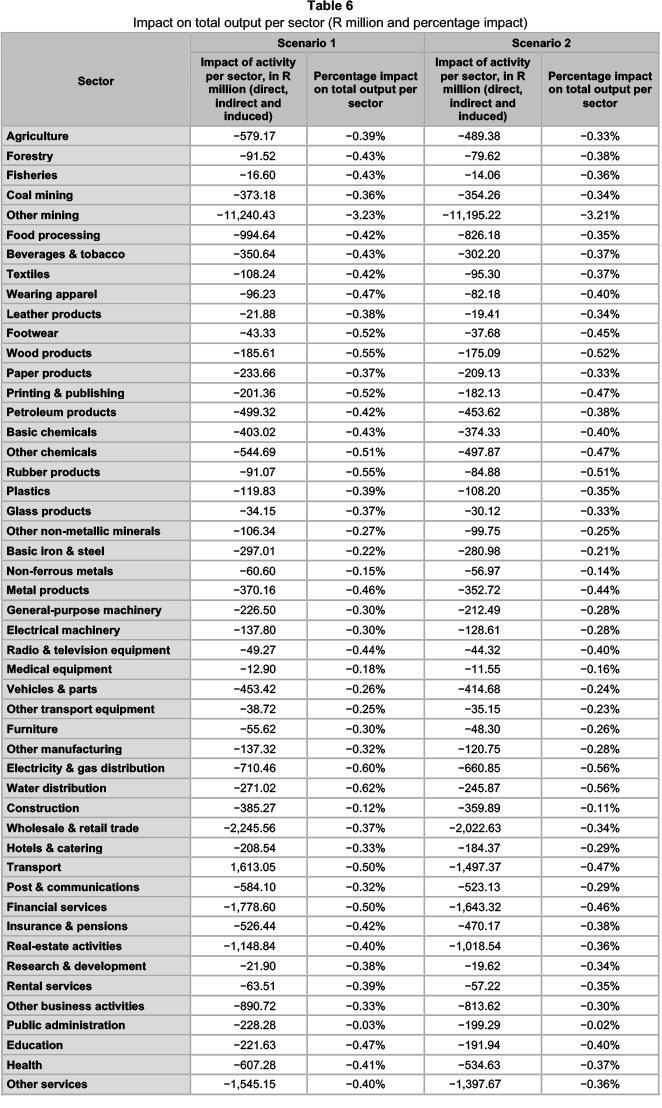
Apart from the mining sector that was directly impacted, all other sectors in the economy were also impacted as a result of interdependencies in the economy. The wholesale and retail trade showed the biggest rand value loss (R2.25 billion in Scenario 1 and R2.02 billion in Scenario 2), followed by financial services (R1.80 billion in Scenario 1 and R1.64 billion in Scenario 2), transport (R1.61 billion for Scenario 1 and R1.50 billion for Scenario 2), other services (R1.55 billion for Scenario 1 and R1.40 billion for Scenario 2), and real-estate activities (R1.15 billion for Scenario 1 and R1.0 billion for Scenario 2).
The largest percentage decrease in the sectors (excluding the mining sector) occurred with respect to water distribution (0.62 per cent for Scenario 1 and 0.56 per cent for Scenario 2), electricity and gas (0.6 per cent for Scenario 1 and 0.56 per cent for Scenario 2), rubber products (0.55 per cent for Scenario 1 and 0.51 per cent for Scenario 2), and wood products (0.55 per cent for Scenario 1 and 0.52 per cent for Scenario 2). The smallest estimated percentage impact was on public administration (0.03 per cent for Scenario 1 and 0.02 per cent for Scenario 2).
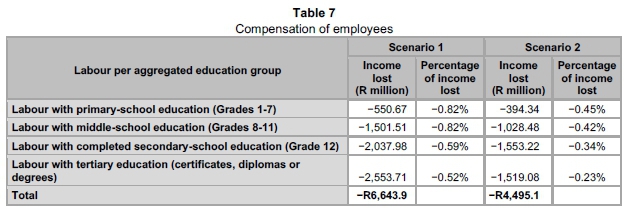
7.2 Compensation of employees, and private-sector consumption expenditure
Compensation of employees in Scenario 1 shows a decrease of R6.6 billion that is very close to the estimate of the DoL. Scenario 2 shows a decrease of R4.5 billion after a reduction of the direct impact. Scenario 2 has been adjusted, given that the modelled results for Scenario 1 are potentially overstating the impact on compensation of employees, as the structure of the model "assumes" that all wages are not being paid (i.e. are not being paid to mine management, to any other non-striking workers, or to any of the direct or indirect suppliers given the multiplier impact in the economy). In reality, the mines still have to pay the salaries of non-striking workers/management, even though production is not taking place. The wage bill of the multiplier effect will depend on a number of factors, including the duration of the strikes and whether suppliers have other sources of income or access to finance so that they can still pay their workers during times of strike action (further adjustments have not been made, apart from the adjustment in respect of direct wages that the mines will still pay).5
Final consumption expenditure by households shows an estimated decrease of R7.97 billion for Scenario 1 and R7.02 billion for Scenario 2. This implies that growth in consumption expenditure in 2012, following the 4.9 per cent growth in 2011, could have been 4.2 per cent for Scenario 1 or 4.1 per cent for Scenario 2 instead of the actual 3.6 per cent.
7.3 Gross fixed capital formation (GFCF)
GFCF shows a reduction of R2.79 billion for Scenario 1 and R3.18 billion for Scenario 2. The GFCF for Scenario 2 is lower owing to the lower gross operating surplus in Scenario 2.
This implies that the total 2012 GFCF of R593.39 billion, as reported by the Reserve Bank, could have been 0.47 per cent higher for Scenario 1 and 0.54 per cent higher for Scenario 2. Furthermore, future capital investments in mining and other sectors could potentially be impacted by strike action that will result in lower economic growth and lower employment creation in future periods. This impact on future investment has not been estimated in this study.
7.4 Balance of trade
If the strike-related production had not been lost, PGM companies could have decided to increase their stock, sell the ounces domestically or export the ounces produced. If we assume that all PGM inventories are exported and we add inventories to exports, the total additional export earnings could have been R9.05 billion for Scenario 1 and R8.41 billion for Scenario 2. The modelled imports as a result of the strike are reduced by R463.3 million for Scenario 1 and by R426 million for Scenario 2. This implies that the current-account deficit for 2012 could have been reduced to a deficit of 4.93 per cent of GDP, compared with the actual 5.23 per cent, for Scenario 1 (a deficit of R154.9 billion instead of R164.4 billion, taking the potential increase in GDP into consideration when calculating the percentage impact) and to a deficit of 4.94 per cent for Scenario 2. This could have resulted in a stronger exchange rate and lower inflation, while interest rates could have been kept lower for longer - all factors that would have impacted the economy and which are not included in this estimation.
7.5 Impact on the government budget deficit, and tax impacts
While the modelled results show that government consumption expenditure is only reduced by R545.7 million, government income is reduced by R3.8 billion. This is calculated on the basis of a reduction in direct taxes (corporate and personal income taxes) of R2.4 billion, in activity taxes (taxes less subsidies in respect of production) of R194.4 million, and in sales tax (taxes less subsidies on products) of just over R1 billion. This implies that the budget deficit could have been 5.13 per cent instead of 5.26 per cent (using Reserve Bank data). What this essentially means is that the cost of government borrowing is higher, which will place a further burden on taxpayers.
Government income is reduced by R3.6 billion in Scenario 2 (the government budget could have been 5.14 per cent instead of 5.26 per cent).
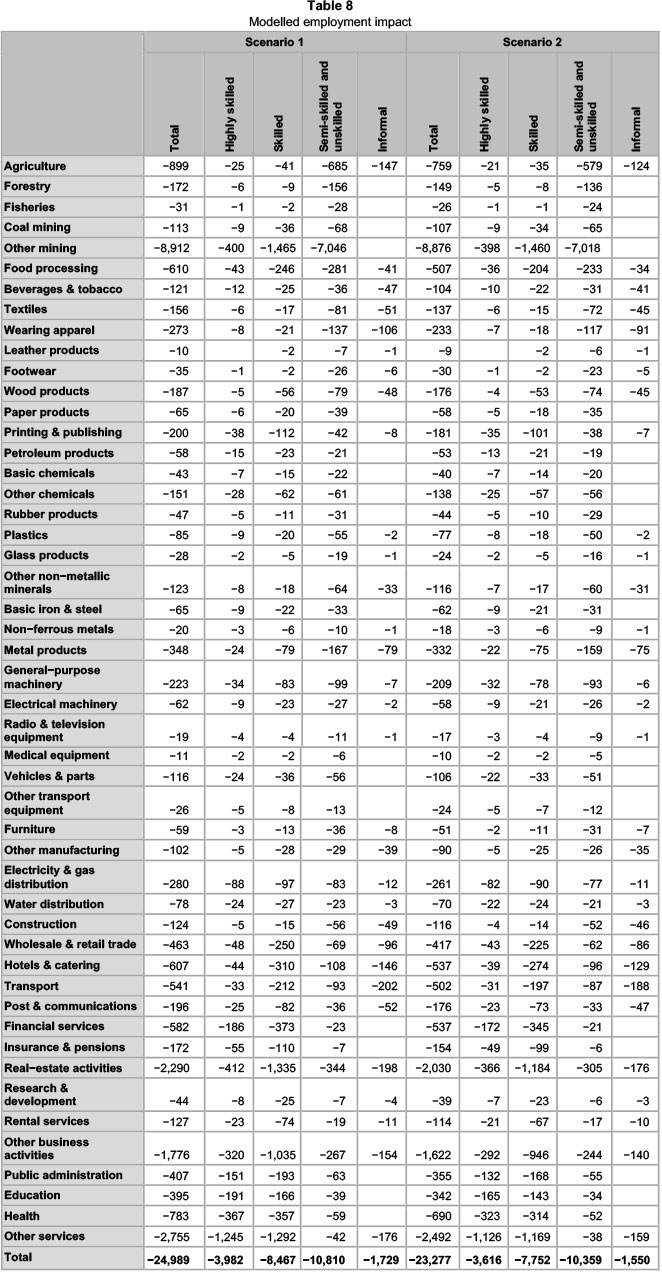
7.6 Employment impact
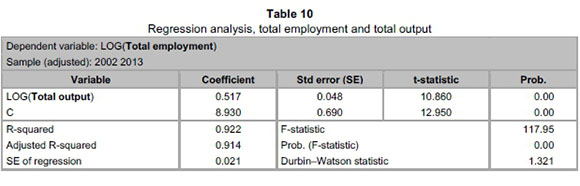
Employment impact can be estimated in a number of ways. For example, average employment multipliers per sector (the number of employees per R1 million of output) can be used based on the total output per sector and the total number of employees. However, employment elasticities can be sticky, and, if sufficient time series data are available, coefficients can be estimated per sector or per skills group. The employment coefficient with respect to total output estimated from 2002 to 2013 is shown in the Appendix hereto. This regression analysis shows that, for every 1 per cent increase in the total output, employment only increases by 0.52 per cent. This coefficient was used to adjust the overall indirect employment impact.
A total of 24,989 full-time equivalent jobs per year are estimated to be lost in Scenario 1 due to the impact of the strike action, and 23,277 for Scenario 2. This simulated impact shows just over 8,900 jobs in the "other-mining" sector for Scenario 1 and just under 8,900 for Scenario 2 (on the basis of the 103,155 employees involved in strikes in the "Metal ores, except gold and uranium" sector that lasted for about seven months). Although this number of jobs is not lost, the work that could have been done is lost to the economy. This provides a strong warning of the danger of strike action and of the potential impact on other non-related workers.
8 Policy and policy implications
Strike action does not only limit production in strike-related sectors, but also results in unwanted impacts on the rest of the economy. Although the causes of strike action constitute a research topic on its own and will therefore not be addressed in the present research, low wages, harsh working conditions, poor living conditions, overindebtedness, consumer price increases, and unions are at the core of such action. Given this, it is no surprise that labour-related factors in South Africa are among the worst-ranked factors in surveys, including the WEF's Global competitiveness report. To achieve inclusive growth, it is imperative that these aspects are addressed.
Improvements in the general level of education and skills are needed to create long-term sustainable growth that will enable higher wages and a higher probability of employment. However, short-term labour problems also need to be addressed. A worrying factor is also that the next generation of workers is being failed by the education and skills development systems in place. Consequently, they are being deprived of opportunities to improve themselves through human-capital development. Babson (2014), for example, notes that, from 2008 to 2012, about two-thirds of the unemployed lacked a matric qualification, while about one-third had such a qualification, but no more. During the fourth quarter of 2012, a total of 71.1 per cent, or 3.2 million of the unemployed, were between the ages of 15 and 34.6
Although there is little evidence by way of research to show that labour legislation creates rigidities which prevent firms from hiring or firing workers (Kerr, Wittenberg & Arrow, 2014), some researchers argue that restrictive labour laws make it too expensive to employ large numbers of unskilled workers (Bernstein, 2011). Banerjee et al. (2007) found a persistent union wage differential, suggesting that unions are propping up wages for union members, thereby posing additional challenges for the unemployed. Bernstein (2014) argues that the most urgent policy challenges revolve round high levels of unemployment, the regulation of the labour market, the role of unions, the shortage of skills, and the education system. In view of this, and the recent impacts of strike action in South Africa, drastic measures are needed. Bernstein (2014) proposes that the solutions include the relaxation of labour laws - which hinder entry into the labour market, especially for young people - and the introduction of an open-migration regime for skilled migrants (among others). The current role of labour unions also needs to be re-evaluated. Although labour unions are important in looking after the interests of employees, it is time that government takes a stand and demonstrates that it is serious about creating the millions of jobs needed. Unions' demands for higher wages have resulted in job losses. Moreover their infighting for "market share" indicates that they only serve themselves and the interests of their own members, instead of supporting the country's goal of higher economic growth and employment creation.
Management is also responsible for the employee-employer relationships, given that it is in control of running the business. Although many factors, including economic conditions and policies, are beyond management's control, a number of factors are within their control, for example how remuneration is paid so as to provide incentives for workers to enable them to receive higher levels of income, produce at higher productivity levels, and to share in profits. Why must a mineworker, for instance, only receive a fixed monthly salary and not a share in the profits if commodity prices increase or if production targets are met? Better incentives for workers can lead to improved commitment and improved production. Such incentives can, for example, entail all workers being given share options if they have worked for a certain period of time, where certain conditions such as profit targets are met, or if they are not striking (in the case of listed or larger companies). Bonuses and performance-driven targets can also account for a much larger share of workers' potential income - if workers work hard and the company makes good profits, workers should be able to share in the profits. However, if workers do not perform or they neglect their responsibilities, they should not share in any bonuses or profits and there need to be consequences such as dismissal.
9 Concluding remarks
In this paper it has been shown how a SAM-based Leontief economic-impact model can be used to estimate the potential impacts of strikes in the platinum-mining industry during 2012. Two scenarios were developed, one based on the structure of the model and a second in which adjustments were made to the compensation of employees and to gross operating surplus. The research question was whether the 2012 platinum-sector strike had a significant impact on the South African economy.
The main results are as follows:
• The estimated number of ounces of PGMs lost as a result of strike activity was 1.07 million, made up of 602,000 ounces of platinum and 469,298 ounces of other PGMs, with a total value of R10.6 billion.
• The GDP shows a reduction of 0.525 per cent or R16.495 billion for Scenario 1 and a reduction of 0.494 per cent for Scenario 2, implying that the GDP growth for 2012 could have been 3 per cent, instead of the 2.47 per cent, based on Scenario 1 and 2.97 per cent based on Scenario 2. The magnitude of these impacts is similar to the estimated impacts for the 2014 platinum-mining strike calculated by Bohlmann et al. (2014).
• In value terms, the connected sectors that show the biggest impact include the wholesale and retail trade, financial services, transport, and other services. Water, electricity and rubber products show the biggest impact in percentage terms.
• Compensation of employees shows a reduction of R6.6 billion for Scenario 1 and R4.5 billion for Scenario 2.
• Gross operating surplus shows a reduction of R8.4 billion in Scenario 1 and R9.8 billion for Scenario 2.
• Final consumption expenditure is estimated to be R7.97 billion lower for Scenario 1 and R7.02 billion lower for Scenario 2.
• GFCF shows a reduction of R2.8 billion for Scenario 1 and R3.2 billion for Scenario 2.
• The current-account deficit could have been reduced to 4.93 per cent of GDP, instead of the realised 5.23 per cent for 2012, under Scenario 1 and to 4.94 per cent for Scenario 2.
• The government budget deficit could have been reduced to 5.13 per cent, instead of the actual 5.26 per cent for 2012, given the additional tax income (Scenario 1), or could have been reduced to 5.14 per cent (Scenario 2).
• Employment, if expressed over a year, and given the lost production, represents a modelled loss of almost 25,000 full-time equivalent opportunities for Scenario 1 and almost 23,300 for Scenario 2. This implies that, for every worker who went on strike, his/her own job and that of at least one other person were put in jeopardy.
Given the unintended consequences of strike action that results in lower GDP, lower consumption, lower tax income, larger trade deficits, a loss in income, and potential job losses, it is time to re-evaluate the benefits of strike action, given the direct and indirect costs. Understanding the potential, wider economic impacts of strike action can provide valuable insights for policymakers, businesses, workers, and trade unions so that they pursue strike action only as the very last resort. This research will hopefully result in improved policies, as well as enriched negotiations that take into account the adverse impacts of strikes so that solutions to deadlocks in wage negotiations can be pursued before deadlocks progress to strike action.
References
AFRICAN RAINBOW MINERALS. 2013. Integrated annual report 2012. [ Links ]
ANGLO AMERICAN PLATINUM. 2012. Annual Report 2012: Reviewing the portfolio with the future in mind. Available at: www.angloamericanplatinum.com/ [accessed May 2014]. [ Links ]
BABSON, A. 2014. Developing possibilities for South African youth: Beyond limited education choices? The Annals of the American Academy, AAPSS, 652, March. [ Links ]
BANERJEE, A., GALIANI, S., LEVINSOHN, J., MCLAREN, Z. & WOOLARD, I. 2007. Why has unemployment risen in the new South Africa? NBER working paper 13167. June 2007. [ Links ]
BERNSTEIN, A. 2011. A fresh look at unemployment: A conversation among experts. Centre for Development and Enterprise (CDE). [ Links ]
BERNSTEIN, A. 2014. South Africa's key challenges: Tough choices and new directions. The Annals of the American Academy, AAPSS, 652, March. [ Links ]
BHANA, N. 1997. The effect of industrial strikes on the value of shares listed on the Johannesburg Stock Exchange. Investment Analyst Journal, 44, Summer:43-49. [ Links ]
BHORAT, H., NAIDOO, K & YU, D. 2014. Trade unions in an emerging economy: The case of South Africa. World Institute for Development Economics Research (WIDER), Working paper 2014/55. [ Links ]
BOHLMANN, H.R., DIXON, P.B., RIMMER, M.T. & VAN HEERDEN, J.H. 2014. The impact of the 2014 platinum mining strike in South Africa: An economy-wide analysis. ERSA working paper 47, November. [ Links ]
CHAMBER OF MINES OF SOUTH AFRICA. Annual report 2012/13. Putting South Africa first. [ Links ]
DAVIES, R. & THURLOW, J. 2011. A 2009 social accounting matrixfor South Africa: Version 1.2. World Institute for Development Economics Research, United Nations University. Helsinki, Finland. [ Links ]
DEPARTMENT OF LABOUR (DoL). 2011. Annual industrial action report 2010. Republic of South Africa. [ Links ]
DEPARTMENT OF LABOUR (DoL). 2012. Annual industrial action report 2011. Republic of South Africa. [ Links ]
DEPARTMENT OF LABOUR (DoL). 2013. Annual industrial action report 2012. Republic of South Africa. [ Links ]
DEPARTMENT OF TRADE AND INVESTMENT (DTI). Trade statistics. Available at: http://tradestats.thedti.gov.za/ReportFolders/reportFolders.aspx [accessed May 2014]. [ Links ]
EC, IMF, OECD, UN & WORLD BANK. 2008. Systems of National Accounts. European Commission, International Monetary Fund, Organisation for Economic Co-operation and Development, United Nations and World Bank. New York. Dec. 2009. [ Links ]
FEDERAL RESERVE BANK OF ST. LOUIS. FRED economic data. Available at: https://research.stlouisfed.org/fred2/ [accessed May 2014]. [ Links ]
IMD World Competitiveness Center. 2014. IMD world talent report 2014. Available at: http://www.imd.org/uupload/imd.website/wcc/NewTalentReport/WCC%20World%20TalentREPORT_FINAL.pdf [accessed May 2014]. [ Links ]
IMPALA PLATINUM HOLDINGS LTD (IMPLATS). Integrated annual report 2012. Available at: www.implats.co.za [accessed May 2014]. [ Links ]
JENSEN, I. 2001. The Leontief open production model or input-output analysis. Available at: http://online.redwoods.cc.ca.us/instruct/darnold/laproj/fall2001/iris/lapaper.pdf [accessed October 2011]. [ Links ]
JOHNSON MATTHEY. 2014. Platinum Today. Available at: http://www.platinum.matthey.com/ [accessed May 2014]. [ Links ]
KERR, A., WITTENBERG, M. & ARROW, J. 2014. Job creation and deconstruction in South Africa. South African Journal of Economics, 82:1. [ Links ]
LONMIN PLC. 2012. Annual report and accounts, for the year ended 30 September 2012. Available at: www.lonmin.com [accessed May 2014]. [ Links ]
LONMIN PLC. 2013. Annual report and accounts, for the year ended 30 September 2013. Available at: www.lonmin.com [accessed May 2014]. [ Links ]
POOLE, E. 1999. A guide to using the input-output model of Statistics Canada. Statistics Canada, National Accounts and Analytical Studies, System of National Accounts, Input-Output Division. [ Links ]
QUANTEC. 2014. Easydata. Available at: http://www.quantec.co.za/ [accessed September 2014]. [ Links ]
STATISTICS SOUTH AFRICA (Stats SA). 2005. Constructing a social accounting matrix: Comparisons across eleven countries. Discussion document, February 2005. Available at: http://www.statssa.gov.za/publications/DiscussSAM/DiscussSAM.pdf [accessed June 2013]. [ Links ]
STATISTICS SOUTH AFRICA (Stats SA). 2013a. Labour market dynamics. Data from SuperWEB. Available at: http://interactive.StatsSA.gov.za/superweb/login.do [accessed September 2014]. [ Links ]
STATISTICS SOUTH AFRICA (Stats SA). 2013b. Quarterly employment statistics, December 2012. Statistical release P0277, 19 March 2013. [ Links ]
STATISTICS SOUTH AFRICA (Stats SA). 2014a. Quarterly labour force survey, 1st quarter 2013. Statistical release P0277, 5 May 2014. [ Links ]
STATISTICS SOUTH AFRICA (Stats SA). 2014b. Mining: Production and sales, May 2014. Statistical release P2041, 13 May 2014. [ Links ]
SUCDEN FINANCIAL. 2014. Quarterly metals report. April 2014. Available at: www.sucdenfinancial.com/metals [accessed May 2014]. [ Links ]
VENTER, I. 2014. Increasing local truck content will be difficult, cautions Van Zyl. Engineering News, 29 August 2014. [ Links ]
WILKINSON, K. & CHIUMIA, S. 2013. Are most estimates of what strikes cost the AS economy accurate? Probably not. Take them with a big pinch of salt. Africa Check, 18 September 2013. Available at: http://africacheck.org/reports/are-most-estimates-of-what-strikes-cost-the-sa-economy-accurate-probably-not-take-them-with-a-big-pinch-of-salt/ [accessed May 2014]. [ Links ]
WORLD ECONOMIC FORM. 2013. The global competitiveness report, 2013-2014. Available at: http://www3.weforum.org/docs/WEF_GlobalCompetitivenessReport_2013-14.pdf [accessed May 2014]. [ Links ]
Accepted: February 2016
1 See endnote 6.
2 The annual reports of other large platinum mines were researched, but no strikes took place during the period under review, or no references to the impact of strikes were made. These include the annual reports of Royal Bafokeng, Wesizwe Platinum, Northam Platinum, Aquarius Platinum Limited, and African Rainbow Minerals (ARM).
3 Average platinum inflation in rand terms for 2012 was 2.3 per cent higher, but that for both palladium and rhodium were lower. Part of the strike took place in February and March 2012, with the other part occurring from August to November 2012. As a result, no inflationary adjustments have been made to the data.
4 This includes platinum-group metals (PGMs) (Standard industrial classification code 2424).
5 An adjustment has been made based on an estimated number of 103,155 mineworkers (as given by the Department of Labour (DoL)), as well as on a weighted average mineworker's salary calculated at R5,656.6 per month which results in a total direct amount of salary income lost during the seven-week strike of R1.02 billion (using data from the Labour market dynamics survey (Stats SA, 2013a)). The net difference between this figure and the estimated wage bill in order to mine R10.7 billion ounces of PGMs has been used to increase the compensation of employees in Scenario 2 and to decrease the gross operating surplus.
6 Based on data from the Labour market dynamics survey (Stats SA, 2013a).
Appendix
1.1 The model
A SAM for 2012 was constructed that contains a combination of Statistics South Africa data (2012 supply and use tables (SUT) and household data) and Reserve Bank national accounts data.
The 1993 United Nations system of national accounts (SNA) defines a SAM as a means of presenting the SNA in a matrix format that elaborates on the linkages between supply and use tables and institutional sector accounts. In this respect, a SAM contains data on production activities, intermediate inputs, primary factors, commodities, households, and institutions such as enterprises, the government and the rest of the world. It also has the advantage that it links data for economic and social fields together in one matrix and that data from various sources can be collected, incorporated, reconciled and "linked" in one matrix or in satellite accounts (Stats SA, 2005).
An economic-impact model is built based on the 2012 SAM, and a fixed-structure, Leontief inverse matrix is used. The basic Leontief methodology (SNA, 2008:512; Jensen 2001) shows
that:

where demand is equal to total production minus the production needed by other industries as inputs. In this equation, D = Demand vector (how much in, for example, rand terms of each type of output is demanded by consumers and the rest of the world), X = Production vector (for internal and external demand), and AX = Production needed by other industries as inputs (total amount of products needed in production), with A being the technology matrix or technical coefficient matrix (which shows how much output from each industry a given industry requires to produce R1 of its own output). The goal of a Leontief-based economic-impact model is to solve X for this equation, that is, find the total production for each of several type of goods and services needed to satisfy a certain demand.
A matrix that is multiplied by an identity matrix is equal to itself, that is, IX = X. This results in:

Factoring out an X in both terms on the right-hand side results in:

To solve X, both sides are multiplied by (I - A)-1:

A matrix multiplied by its inverse is equal to an identity matrix (I - A)-1 (I - A) = I, and substituting I with (I - A)-1 (I - A) results in:

And since IX = X as stated above, X can be substituted for:

This provides the equation to solve the total production needed to satisfy an economy with a known demand vector D and a known technology matrix A in:

1.2 Operating statistics and estimated ounces loss
1.3 Regression analysis, total employment and total output

