


Services on Demand
Article
 English (pdf)
 Article in xml format
 Article references
Indicators

Related links
-
 Cited by Google
 -
 Similars in Google
Share

 Permalink
South African Journal of Economic and Management Sciences
On-line version ISSN 2222-3436
Print version ISSN 1015-8812
S. Afr. j. econ. manag. sci. vol.19 n.2 Pretoria 2016
http://dx.doi.org/10.17159/2222-3436/2016/v19n2a6
ARTICLES
Can South Africa sustain and diversify its exports?
Marianne Matthee1; Ernst Idsardi; Waldo Krugell
School of Economics, North-West University
ABSTRACT
The aim of this paper is to examine the diversification of South Africa's exports over the period 1994 to 2012. A decomposition of export growth shows that exports of non-fuel primary commodities as well as medium-skill and technology-intensive manufactured products increased. The largest decrease was in the export of resource-intensive manufactures. These changes reflect South Africa's endowment of relatively low levels of physical and human capital. The analysis shows that export products that are further from the country's comparative advantage, make smaller contributions to growth in the intensive margin. It clearly shows the challenge of sustainably diversifying the export basket.
Key words: exports, intensive margin, diversification, structural transformation, South Africa
1 Introduction
A vast empirical literature exists that shows the contribution of export diversification to economic growth. It is important to note that export diversification is especially beneficial for developing countries, as it involves a country having a varied export production structure that includes not only new, but also higher value products (Amin Gutierrez de Pineres & Ferrantino, 1997; IMF, 2014). This enables countries to offset uncertainty, be less susceptible to commodity shocks and price fluctuations, and to experience positive spillovers that come from trade in higher skilled, high technology goods (Naudé, Bosker & Matthee, 2010; Reis & Farole, 2012). For example, Ancharez and Pfister (2013) suggest that it was the diversified nature of the Mauritian and Tanzanian economies that enabled them to recover quickly from the global financial crisis. It is, therefore, not surprising that export diversification is frequently suggested in developing countries' government policies as a driver for economic growth.
Before continuing, it is important to clarify the different types of export diversification. The IMF (2014:10) defines extensive export diversification as an increase in the number of products exported or the number of trading partners. Intensive export diversification, on the other hand, involves the shares of export volumes across existing export products or partners. Here, intensive diversification occurs when a more balanced export portfolio is exported. In other words, having an export mix that includes more dynamic and higher productivity activities (this implies more manufacturing, higher valued services and fewer natural resource-type activities) is desirable.
Export diversification is closely linked to structural transformation of the economy. Again, the IMF (2014:11) provides a succinct definition - "structural transformation is the reallocation of resources across different sectors and products over time. Development typically involves a shift to higher productivity". This involves changing factor endowments to achieve diversification in terms of a more balanced production structure that includes exports from different sectors. Sustaining a more balanced export mix is a challenge that many developing countries face. A trade guide by the WTO and UNCTAD (2012) explains that the median export spell length for a developing country is approximately two years and that a great deal of "churning" occurs. This means that new exporters struggle to survive. Therefore export growth within these countries comes from existing exporters exporting products that are already exported (to existing trade partners) at higher volumes or higher prices (which is called the intensive margin) (Türkcan, 2014). This emphasises the importance of sustainability by having the right type of expansion within the intensive margin, i.e. exporting more high-skill-intensive or high-value-added products.
South Africa provides a good example of a developing country that has identified the export sector as a means to achieve higher and more inclusive growth (Purfield, Farole & Fernando. 2014). Although the country has undergone significant changes (democratising and liberalising trade in 1994), its export performance is still poor compared to its peers (Hausmann & Klinger. 2006). Furthermore, the majority of export growth (around 77 per cent) is generated through the intensive margin (Matthee et al, 2015).2 Figure 1 illustrates that South Africa's export growth has lagged behind compared to most country groupings as well as global exports in the period from 1994 to 2012. For a significant period, the country's growth in exports was also lower than that of developed countries, which traditionally show lower growth rates than South Africa. Furthermore, compared to the growth in exports of its low- and middle-income and Sub-Saharan peers, South Africa's performance was dismal. In comparison to the other BRICS countries (not shown in the graph), the growth in the country's exports since 1994 has also been much lower.
Hausmann and Klinger (2006) ascribed South Africa's poor export performance to the country's lagging structural transformation that has resulted in an overreliance on commodities to achieve export growth. They show that South Africa's export portfolio has been relatively unsophisticated since 1975 when considering the country's level of income. This has put a limitation on the growth of GDP and exports in general. In fact, the fuel, metals and minerals sectors contributed half of the export value between 2007 and 2012 and this made up 90 per cent of export growth over this time period (Purifield et al, 2014). Figure 2 provides a picture of the change in the broad structure of South Africa's exports since 1994. Extractive industries' share of exports has increased and was 48 per cent in 2012 (compared to 33 per cent in 1994), with manufacturing at only 19 per cent.
However, not all is bad news; the recent report by the World Bank (see Purifield et al, 2014) on South Africa's export competitiveness, highlights the fact that South Africa has a strong manufacturing base and that it does involve technological knowledge. There has been a shift towards medium and high technology sectors with the best performing sectors being industrial machinery and transport equipment. This brings forth a corresponding demand for high skills and capital investment. However, compared to its emerging market peers, South Africa's non-mineral export growth over the period 1994 to 2012 is below par.
In an analysis of the factor endowment content of South Africa's export basket, the World Bank report reveals that exports are concentrated in products with human capital and physical capital beyond the country's endowment capabilities, indicating a clear mismatch (Purifield et al, 2014). Added to this, Fedderke (2014), in an empirical analysis of South Africa's unbalanced growth structure, shows that South Africa's manufacturing sector is declining in terms of value added and employment. This prompts the question: how sustainable are these types of higher valued (non- mineral) exported products?
It is here where our paper contributes to the limited literature on the dynamics of South African exports. We further explore the issue of export sustainability by decomposing the intensive margin export growth from 1994 to 2012. To do this, we consider changes (increases, decreases and extinctions) in export relationships between 1994 and 2012 and begin by applying Basu's (forthcoming) skills and technology classification to determine the composition of South Africa's exported products. Next, we shed some light on the sustainability of South Africa's exports using the revealed factor intensity indices compiled by Shirotori, Tumurchudur and Cadot. (2010).
Our results show how South Africa's composition of exports and trade patterns has changed over the period 1994 to 2012. The largest increase was in non-fuel primary commodities (38 per cent), with the second largest increase being medium-skill- and technology-intensive manufactures (22 per cent). The largest decrease was in the resource-intensive manufactures (50 per cent). Low-and high-skill and technology manufactures display persistence as the percentages of increases and decreases do not vary significantly. The factor intensity results show that South Africa's endowment levels in terms of human and physical capital are relatively low and that movements in the intensive margin are to some extent determined by the levels in human and physical capital endowments. Any increases require pushing the boundaries of human and physical capital endowment. Moreover, our correlation results emphasise that the further away an exported product is from the country's endowment point, the smaller its contribution to increases in the intensive margin will be. Similarly, larger distances from the endowment point result in larger decreases (and extinctions) within the intensive margin.
The article is structured as follows: section 2 provides a brief literature overview on a historical perspective of South Africa's export structure; section 3 provides the method and data; and section 4 contains the empirical analysis and results. Finally, section 5 concludes the article with a summary and recommendations.
2 South Africa's export structure: A historical perspective
In order to understand the dynamics of South Africa's export structure, it is important to consider the evolution of South Africa's trade since the beginning of the 20th century, as demonstrated by Bell, Farrell and Cassim (1999). The authors identified a number of phases in which South Africa's export mix changed. The first half of the 1900s was characterised by a very strong dominance of gold and diamonds in exports. Subsequently, industrialisation took place and the manufacture of value-added goods increased. The ratio of imports to domestic supply fell significantly. Over the period 1956/57, exports became more diversified. The share of primary products in total exports fell and manufactures increased from eight per cent to 26 per cent (Bell et al., 1999). Furthermore, over the period 1926/27 to 1956/57, the exports of the downstream metal products group of industries grew more rapidly than those of the natural resource-based sectors.
The period 1956 through to 1972 saw first a resurgence and then a decline in gold exports. As gold exports slowed from 1965, there was faster growth in manufactured exports, but the growth rate of total exports declined (Bell et al., 1999). During this time, exports of natural resource-based manufactures grew strongly and by 1980 accounted for nearly 47 per cent of manufactured exports. Bell et al. (1999:12) concluded that the rate of growth of exports from the metal products group of sectors decreased from eight per cent per annum over the period 1960 to 1970 to only 2.4 per cent per annum in 1972-80. Their share of total manufactured exports fell from approximately 18 per cent in 1972 to 12 per cent in 1980. They ascribed this to a variation in the real exchange rate that caused the competitiveness of non-commodity manufactured exports to worsen when the competitiveness of natural resource-based manufactured exports improved.
The early 1980s were characterised by an economic crisis, debt shock, a shift to export-orientated industrialisation and the eventual opening up of the economy. The period 1985 to 1990 saw much faster growth in downstream metal product exports compared to natural resource-based manufactured exports. The slow growth in the world economy between 1990 and 1993 saw no growth in total exports, but the downstream metal products group of industries showed some growth and increased their share of total manufactured exports. Bell et al. (1999:18) concluded that the period 1985 through to 1993 was marked by significant diversification of South Africa's manufactured exports towards more downstream sectors. They argued that there was a substantial and persistent improvement in the competitiveness of downstream manufactured exports that were "apparently beginning to include the exports of high technology products " (Bell et al., 1999:21).
Edwards and Alves (2006) continued the story of South Africa's export structure through their study of the level and composition of manufacturing exports following the opening up of the economy in 1994. They applied a technology-based product classification to examine the performance of supply-dynamic products. Exports were classified as primary products, resource-based manufactures, low-technology manufactures, medium-technology manufactures and high-technology manufactures. They argued that the more skills and technology are involved in the production process, the more growth will be driven by productivity gains. They then compared annual average growth rates of these exports from South Africa to the exports of countries in the Asia-Pacific region and a "resource group" of 25 countries with similar shares of natural resource-dependent products in total exports to South Africa in the late 1980s.
The results show broad structural shifts in the pattern of exports for the world and for South Africa. Much of the overall growth in exports was in middle-income economies and that within high-technology and medium-technology products. The share of high-technology products in world trade rose significantly. A similar shift occurred in South Africa: manufacturing exports as a share of total exports increased and within manufacturing exports the share of resource-based products declined. There was a significant increase in medium-technology exports attributed to the Motor Industry Development Programme. However, primary exports plus agro- and minerals-based manufactures still accounted for more than 60 per cent of total exports in 2002 (Edwards & Alves, 2006). In addition, the results showed the troubling result that South Africa's world market share of exports declined during the 1990s. Manufacturing export growth was slower than the average of middle-income countries and of the countries in the resources group. Overall, it made for a poor performance. Edwards and Alves (2006:482) concluded that the ability to diversify exports is constrained by the comparative advantage in resource-based products; but even in this area, South Africa's performance was weak.
Finally, Edwards and Lawrence (2008) extended the analysis above with a detailed analysis of South African trade performance and trade policy. They distinguished between non-gold commodities and non-commodities exports. The non-gold commodities include primary commodities and manufactured goods that have a relatively high share of primary commodity inputs in final sales. The non-commodities are exports of other manufactured products as well as services (Edwards & Lawrence, 2008:588). They highlighted the historically poor export performance described above, the decline of non-gold commodities and growth of non-commodity exports. For the more recent period, 2000 to 2005, they found that export volume growth was slow. Automotive exports drove the growth in non-commodity exports.
Edwards and Lawrence (2008) also examined changes in market shares and two periods emerged from their findings. Over the period 1970 to 1983, South Africa lost market shares and this was attributed to slower growth in world trade in commodities, a poor geographic distribution of export markets and declining competitiveness. Over the period 1985 to 2000, South Africa again lost market shares, but the cause was mainly the dependence on primary commodities. Annual growth in manufactured exports was strong, in part reflecting the growth in automotive exports. They concluded that, recently, growth has been constrained by the pattern of specialisation.
In summary, South Africa's large resource endowments and subsequent comparative advantage make it difficult to change its export composition, especially during periods with high commodity prices (or commodity booms). Resource exports usually increase whenever commodity prices increase, and while diversification has always occurred, it tends to be neglected during these periods. Conversely, during periods of commodity busts, diversification moved to the fore.
3 Method and data
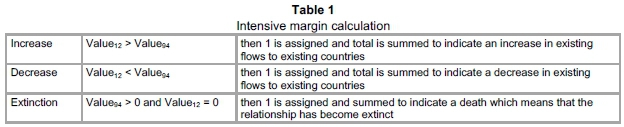
3.1 Intensive margin calculation
Firms (and countries) either establish new export relationships or maintain existing ones. An export relationship is a trade flow and can be defined as the export of product j from country (firm) k to country (firm) i (see Besedes & Prusa, 2011). Export growth therefore occurs through these export relationships, and can be either along the intensive or extensive margin. Decomposing export relationships in the intensive margin reveals whether the relationship has increased, intensified or deepened (according to Besedes & Prusa, 2011); decreased or weakened; or become extinct. The extensive margin involves the formation of new export relationships (export discoveries) (Brenton & Newfarmer, 2009).
In order to determine the changes along the intensive margin (using the UN COMTRADE database), we calculate values for three categories; namely increases, decreases and extinctions. This is done by calculating how the values of existing exports changed between 1994 and 2014. For example, if a product had a value of USD 900 in 1994 and the same product had a value of USD 1100 in 2012, then it is calculated as an increase to the value of USD 200. We also assign dummy values in order to count the number of increases etc. Table 1 summarises the specification for the three categories.
3.2 Skills and technology intensity
The composition of a country's exports in terms of embedded technological and skills capabilities tell a great deal about its economic development path. This is supported by Basu and Das (2011) who found that higher quality exports could help to increase the per capita GDP in developing countries. The basis of their empirical analysis consisted of a classification of products into different levels of skills and technological intensity. Basu (forthcoming) has developed this categorisation at HS6 level, which comprises six groupings, namely:
i non-fuel primary commodities (e.g. maize, lead ores);
ii resource-intensive manufactures (e.g. leather handbags, wallpaper, ceramic tiles);
iii low-skill- and technology-intensive manufactures (e.g. window frames, motorboats);
iv medium-skill- and technology-intensive manufacture (e.g. hydraulic turbines, hairdryers);
v high-skill- and technology-intensive manufactures (e.g. mobile phones, aircraft); and
vi unclassified products (e.g. petroleum, monetary gold).
South Africa's intensive margins are decomposed according to this classification in order to analyse the structural transformation in its export patterns for the period 1994 to 2012. This decomposition reflects the value share of each product grouping in total increases, decreases and extinctions.
3.3 Revealed factor intensities
The patterns of trade and process of export diversification have received renewed attention lately. Hausmann and Klinger (2006) argue that a product's proximity to existing comparative advantages is one of the most important determinants of whether that country will develop a core competency in the production of that product. This relates to the factor endowment as an explanation of trade patterns as postulated by the Hecksher-Ohlin theory. Shirotori et al. (2010) used this concept to develop a measure of revealed factor intensities of export products. This measure is based on the principle that if a specific product is predominantly exported by countries endowed with a certain combination of human and physical capital, this product has a revealed intensity of these factors. Please refer to Shirotori et al. (2010) for a complete overview of the methodology.
Shirotori et al. developed three indices of factor intensity at product-level: namely, "revealed human capital intensity" (RHCI); "revealed physical capital intensity" (RCI); and "revealed natural resource intensity" (RNRI). The former two will be used in this study to analyse the factor content within South Africa's intensive margin. Furthermore, the distance between the products within the intensive margin and the country's endowments with regard to human and physical capital is investigated. This is done to reveal whether South Africa's level of comparative advantage in these factors determines the patterns within the intensive margin. This relationship is also empirically tested by estimating the Spearman's rho correlation coefficient (see Table 4).


4 Composition of South Africa's intensive margin
Firstly, a broad overview of the dynamics within the intensive margin over the period is provided in Table 2. The results here exclude all transactions below US$10 000. The World Bank's (2012) Exporter Dynamics Database suggests that the median export value for South African exporters is US$29 000. Therefore, based on this and on the calculations in Table 1, a cut-off value of US$10 000 will not exclude the median exporter, but will exclude the really small export flows (or any measurement errors that occurred).
The following sections discuss the results according to the skills and technology classifications and factor intensities.
4.1 Skills- and technology-intensity
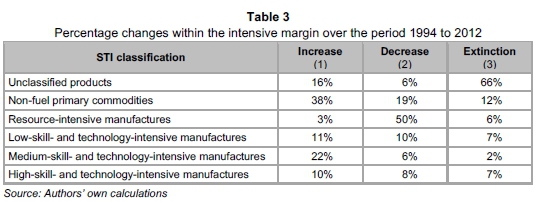
The shares of the product groupings in the different intensive margins (i.e. increase, decrease and extinction) are analysed for all product classifications as well as for a set of selected countries and regions. Table 3 presents the intensive margin dynamics per Skills and Technology Intensity (STI) classification, as discussed in section 3.2, over the period 1994 to 2012.
Table 3 summarises the dynamics in South Africa's intensive margin over the period 1994 to 2012. Products exported over this period are classified according to categories of exports that reflect different factor contents to show whether or not the country has attained a more balanced export mix since its integration in the global economy, and also in the process of structural transformation.
The results show the percentage of product categories where the export relationship value increased from 1994 to 2012 (see column 1 of Table 3). The largest percentage increase (38 per cent) stems from the non-fuel primary commodity category. This mainly consisted of the exports of iron, chromium and manganese ores. Also notable is the increase in medium-skill and technology-intensive manufactures (22 per cent). This product group consists of a large variety of products, but is dominated by the exports of automobiles, filtering/purifying machinery and acyclic hydrocarbons. In terms of the export relationships whose value decreased over this specific period (see column 2 of Table 3), a decrease in resource-or labour-intensive manufactures is by far the largest contributor. Delving more deeply into this decrease, we see that it is mainly attributed to a decrease in the exports of raw diamonds. However, the remainder of the decrease is due to weaker exports in textile and textile articles, paper/pulp-related products and leather-related products. Finally, the classification of the products that were exported in 1994 but not in 2012 (see column 3 of Table 3) shows a large percentage (66 per cent) of unclassified products. This high level of extinction within this specific group is mainly attributed to one single product; namely HS9999AA UN Special Code (65 per cent). Most probably due to confidentiality issues, the exact nature of this product is not published in trade statistics. The level of extinction within the unclassified product was the highest for the EU-7. Another product grouping that experienced relatively high levels of extinctions was non-fuel primary commodities. This was mainly attributed to export relations involving maize, copper mattes and coniferous woods that failed to be sustainable.
Considering that this type of classification reveals information about the quality of the export basket, it is important also to consider the low- and high-skill and technology-intensive manufactures. The percentages of these two categories remain fairly level, which indicates persistence in the exports of these types of products.
The implication of these results is that there appears to be a polarisation in terms of South Africa's export basket or mix. The export mix has become more balanced with a large increase in medium-skill and technology-intensive manufactures. However, this increase is accompanied by an even larger increase in non-fuel primary commodities, which brings the balanced mix into question. Manufactures that utilise low and unskilled labour found in resource-intensive manufactures, appear to have decreased dramatically, which resulted in the polarised mix we find in 2012. In a study on South Africa's export competitiveness and structure during the 1990s, Edwards and Schöer (2001) found a low percentage of unskilled labour-intensive products (20 per cent of total exports) in comparison with the levels of technology and human capital intensive exports (50 per cent of total exports). Agricultural and mineral-intensive industries contributed 30 per cent of total exports. Over the period, Edwards and Schöer indicated that their results conflicted with other studies, i.e. that the contributions of unskilled labour-intensive and technology-intensive products have both risen, whereas those of resource-intensive, mineral-intensive and human capital-intensive exports have declined. Our article extends the period through a similar analysis, and shows a return to dependence on resource-intensive industries.
In a similar vein to Edwards and Schöer (2001), we also consider South Africa's export composition from a geographical perspective, but with more detail. Figure 3 shows the skills- and technology-decomposition for increases in the intensive margin per country/region. China dominated imports of non-fuel primary commodities from South Africa, with the EU also importing the largest percentage of products in this category (41 per cent). The share in growth of medium- and high-skill- and technology-intensive manufactures was especially high for exports destined for the USA (52 per cent) and Sub-Saharan Africa (SSA) (35 per cent).

Figure 4 shows the composition of the decreases within South Africa's intensive margin per country/region over the period 1994 to 2012. China imported 74 per cent less low-skill and technology-intensive products. The exports of these products to the USA also declined by 30 per cent. The export of resource-intensive manufactures to the EU dropped the most (42 per cent) and to SSA (20 per cent). The decrease to the EU and SSA was predominantly caused by a drop in exports of precious stones and paper-related products, respectively. High-skill- and technology exports to the USA decreased the most, with a percentage of 37. This decrease is largely in titanium oxides.

The decomposition of South Africa's extinctions in the intensive margin for the period 1994 to 2012 is depicted in Figure 5. Approximately 36 per cent of resource-intensive manufactures were exported to China in 1994, but not in 2012. The largest extinctions were in these paper-related products, wool-related products and leather-related products. Another large extinction (35 per cent) was the exports of low-skill- and technology products to the USA. The largest extinction to the USA comprised iron and steel products. Finally, a large percentage (44 per cent) of high-skilled and technology-intensive manufactures to the EU became extinct (these include chemical products).
From the geographical results, it is evident that South Africa's export relationship with China over the period under investigation was characterised by a significant growth in the share of primary commodities in export growth. Furthermore, exports of especially low-skill- and technology-products to China mostly decreased or became extinct.
Growth within the export relationship with the USA was dominated by medium-skill- and technology products, predominantly automobiles. On the other hand, exports of both low- and high-skill- and technology-intensive products lost a great deal of ground in the USA.
The intensive margin of exports to the EU-7 was characterised by both increases and decreases of primary commodities. This implies significant shifts in export relations in terms of products and destinations within this specific product group. The decline in resource-intensive manufactures to the EU-7 is also remarkable, as is the extinction of a significant proportion of high-skill- and technology-intensive exports.
Exports o the region (SSA) were dominated by growth in medium- and high-skill- and technotlogy-intensive products. These types of products are not manufactured in most of these countries. Decreases and extinctions in export relations with SSA were dominated by both primary commodities and resource-intensive manufactures. This may allude to the nature of the growth experienced by many African countries.
4.2 Factor intensities
Section 3 discussed the product-level revealed factor intensity (RFI) indices as developed by Shirotori et al. (2010). This section analyses the relative "distance" between the RFI of exports within South Africa's intensive margin and the country's factor endowment for both human and physical capital. As South Africa moves into the production of medium- and high-skill- technology manufactures, its demand for higher human and physical capital is increasing. Given the country's endowments in both these factors will it be able to sustain this desired shift? With regard to its human capital endowment, reflected by the average years of schooling, the country ranks 69thglobally (7.9 years). This is 4.8 years lower than Norway, which is ranked second and just above the global average. In terms of physical capital endowment, South Africa is ranked only 74thglobally, placing it in the same range as Namibia and Kazakhstan. Therefore, these endowment levels are relatively low for the 33rd largest economy (World Bank, 2015) and an upper-middle- income country.
The relative "distance" between South Africa's endowment point of human and physical capital and the revealed human capital index (RHCI) as well as the revealed physical capital index (RCI) of its exports may explain the sustainability of export relationships. Export products that are distant from this endowment point require a different mix of human and physical capital than is currently supported by the economy (Reis & Farole, 2012).
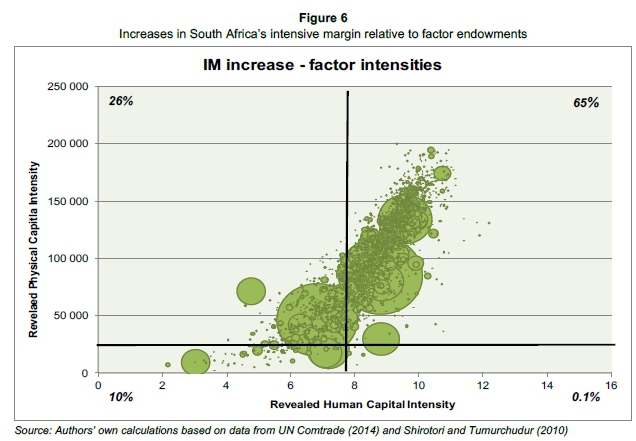
Figure 6 shows the "distance" between the factor content of increases within the intensive margin (a total of 2 154 export products) and the country's endowment point. The percentages reflect the value share of products located in each quadrant. It is evident from the figure that the factor content of most of the increases with the intensive margin (65 per cent) exceeds the country's endowment level.
Using the mean distance as a benchmark, 58 per cent of the export value is located within a relatively small range of the human capital endowment and 83 per cent is located within a relatively short distance to the physical capital endowment. Although the sustainability of a large share of the increase within the intensive margin is under pressure, the deviation is relatively small. As only 11 per cent of the working age population has tertiary education (StatsSA, 2015), the increase in exports of products that embed higher levels of human capital can only be realised by pushing the limits of educational attainment. Comparative advantages in terms of factor endowments underpin success in exporting; however, a range of other factors are also important, e.g. productive capabilities, knowledge, exchange rate volatility, and demand conditions (Reis & Farole, 2012).
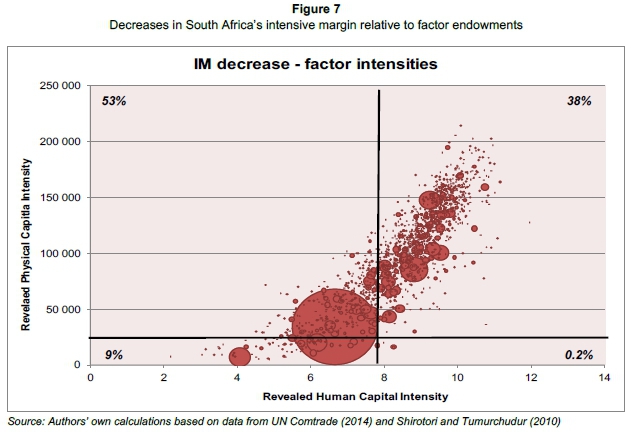
Figure 7 shows the distance between the factor contents of the decreases in the intensive margin (involving 1 492 products) and the country's human and physical capital endowments. The figure shows that most of the decreases are located in the upper-left quadrant (53 per cent). This implies that South Africa was not able to maintain these exports, even though their factor content lies below the country's human capital endowment. Furthermore, 83 per cent of the exports were in relatively short distance to its physical capital endowment. Therefore, other factors hamper the sustainability of these specific export relationships.
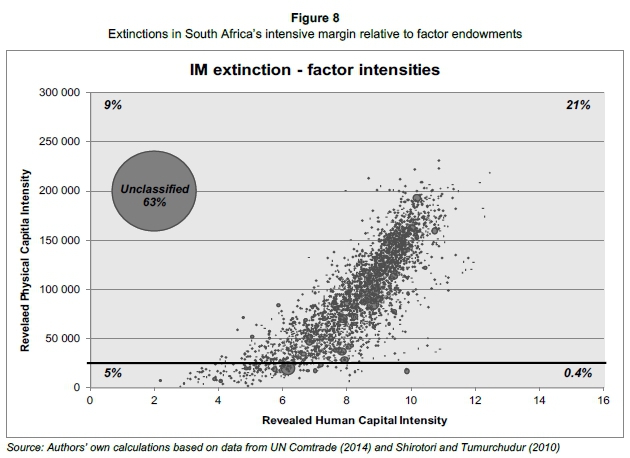
The distance between the factor content of South Africa's extinctions within the intensive margin and its endowment point is shown in Figure 8. As mentioned, the extinctions are dominated by one single and unclassified product, which is depicted in the upper-left quadrant. The figure shows that most of the extinctions are located in the upper-right quadrant (21 per cent). This means that most of the export relations that became extinct are located beyond the country's endowment in both human and physical capital. Therefore, these exports could not be sustained based on the current levels of comparative advantage.
In order to explore the empirical relationship between the intensive margin (IM) and the distance to the country's endowment point for physical- (D_RCI) and human capital (D_RHCI), a correlation analysis was conducted in SPSS 22 (with non-parametric data). The results are presented in Table 4 and these reveal that there are some significant statistical relationships.
Increases within the intensive margin are negatively correlated with the distance between endowment point and factor intensity of physical and human capital. Although the coefficients are relatively small, they are statistically significant. This implies that the further the product is removed from the country's endowment point, the smaller its contribution to increases within the intensive margin will be.
The decreases in the intensive margin are positively correlated with the distance to the country's human and physical capital levels. Since the decreases (as well as extinctions) are measured by negative values, these results are in line with expectations. Therefore, the further removed from the endowment point, the larger the decreases within the intensive margin will be. Products further removed from what can be supported by the economy in terms of human and physical capital are more difficult to sustain. The last column in Table 4 shows that this is also the case for the extinctions within the intensive margin.
The general pattern that arises from this section is that the shifts within the intensive margin are to some degree determined by the relative "distance" to the country's endowment levels in human and physical capital. It was mentioned that other factors do play a role in sustaining and growing exports; however, increasing the levels of human and physical capital endowment will enhance the sustainability of export growth in specifically medium- to high-skill- and technology-intensive manufactures.
5 Discussion and conclusion
Most export growth occurs along the intensive margin: great volumes of the same products to the same markets. For developing countries the challenge is structural transformation and export diversification. This means exporting fewer primary commodities and more manufactured and higher productivity goods for growth and development. Since South Africa's integration into the global economy in 1994, government strategies have emphasised export diversification as a means to drive growth.
This paper decomposed South Africa's exports along the intensive margin. The results show that the largest increase in exports was in non-fuel primary commodities (38 per cent). The second largest increase was in medium-skill-, technology-intensive manufactures (22 per cent). The largest decrease was 50 per cent in resource-intensive manufactures.
It was not the aim of this article to explain these changes, but the decomposition by export markets allows one to draw some conclusions. The growth in the exports of non-fuel primary commodities was driven by Chinese demand. The decreases in the intensive margin can also be ascribed to decreases in Chinese and U.S. demand for low-skill- and technology intensive products from South Africa. The product categories that saw the decreases and extinctions included precious stones, iron and steel products as well as, paper-, wool- and leather-related products. More than a third of the growth in the exports of medium-skill- and high-skill- technology intensive products came from Sub-Saharan Africa. The implications are clear: in the years to come, slower and less resource-intensive growth in the Chinese economy will be to the detriment of South African exports. There may be opportunities in Africa, but they require further diversification into medium- and high-skill products.
The results from the analysis of the factor intensity of exports show that diversification away from South Africa's comparative advantage will prove difficult. The further away an exported product is from the country's endowment point, the smaller its contribution to increases in the intensive margin will be. Products that are further away from the endowment point are also associated with larger decreases and extinctions.
Thus, the conclusions are obvious: exporter firms will find it easier to build on their strengths. Policymakers who want to help to diversify markets, should support exporters of products close to the factor endowment. The analysis shows that this includes products such as meat, bovine leather, vegetable products, soya beans, copper ores and concentrates, industrial fatty alcohols and disodium carbonate.
Further diversification cannot be about assistance or incentives. It invokes the challenge of the structural transformation of the economy. To export more medium-skill- and high-skill-technology-intensive products will require the investments in infrastructure and human capital that everyone is calling for.
References
AMIN GUTIERREZ DE PINERES, S. & FERRANTINO, M. 1997. Export diversification and structural dynamics in the growth process: The case of Chile. Journal of development Economics, 52(2):375-391. [ Links ]
AMITI, M. & FREUND, C. 2008. The anatomy of China's export growth. Policy Research Working Paper no. 4628. World Bank Group: Washington, DC. [ Links ]
AMURGO-PACHERO, A. & PIEROLA, M.D. 2008. Patterns of export diversification in developing countries: Intensive and extensive margins. Policy Research Working Paper no. 4473. WORLD Bank Group: Washington, DC. [ Links ]
ANCHAREZ, V. & PFISTER, A. 2013. Trade as a compass for LDCs structural transformation. Bridges Africa, 2(2). Available at: http://www.ictsd.org/bridges-news/bridges-africa/news/trade-as-a-compass-for-ldcs-structural-transformation [accessed January 2015]. [ Links ]
BASU, S.R. (forthcoming). Retooling trade policy in developing countries: Does technology intensity of exports matter for GDP per capita? Policy Issues in International Trade and Commodities UNCTAD/ ITCD/TAB/57. United Nations, New York and Geneva. [ Links ]
BASU, S.R. & DAS, M. 2011. Export structure and economic performance in developing countries: Evidence from nonparametric methodology (with M. Das). Policy issues in international trade and commodities, UNCTAD/ITCD/TAB/49, United Nations, New York and Geneva. [ Links ]
BELL, T. FARRELL, G. & CASSIM, R. 1999. Competitiveness, international trade and finance in a minerals-rich economy: The case of South Africa. Paper presented at the TIPS annual forum, 19-22 September. Available at: http://www.tips.org.za/files/303.pdf [accessed January 2015]. [ Links ]
BESEDES, T. & PRUSA, T.J. 2011. The role of extensive and intensive margins and export growth. Journal of Development Economics, 96(2):371-379. [ Links ]
BRENTON, P. & NEWFARMER, R. 2009. Watching more than the Discovery channel to diversify exports. In P. Brenton, R. Newfarmer, W. Shaw and P. Walkenhorst (eds.) Breaking into new markets: Emerging lessons for export diversification. World Bank Group: Washington, DC. [ Links ]
EATON, J., ESLAVA, M., KUGLER, M. & TYBOUT, J. 2007. Export dynamics in Colombia: Firm-level evidence. NBER Working Paper no. 13531. National Bureau of Economic Research. [ Links ]
EDWARDS, L. & ALVES, P. 2006. South Africa's export performance: Determinants of export supply. South African Journal of Economics, 74(3):473-500. [ Links ]
EDWARDS, L. & LAWRENCE, R. 2008. South African trade policy matters: Trade performance and trade policy. Economics of Transition, 16(4):585-608. [ Links ]
EDWARDS, L. & SCHÖER, V. 2001. The structure and competitiveness of South African trade. Paper presented at the TIPS annual forum. Available at: http://www.tips.org.za/files/The_Structure_and_Competitiveness_of_South_African_Trade.pdf [accessed January 2015]. [ Links ]
FEDDERKE, J.W. 2014. Exploring unbalanced growth in South Africa: Understanding the sectoral structure of the South African economy. ERSA working paper 468. Available at: http://www.econrsa.org/system/files/publications/working_papers/working_paper_468.pdf [accessed January 2015]. [ Links ]
HAUSMANN, R. & KLINGER, B. 2006. South Africa's export predicament. CID Working Paper no. 129. Available at: http://www.hks.harvard.edu/content/download/69372/1250298/version/1/file/129.pdf [accessed January 2015]. [ Links ]
IMF. 2014. Sustaining long-run growth andmacroeconomic stability in low-income countries - the role of structural transformation and diversification. IMF policy paper. Available at: http://www.imf.org/external/np/pp/eng/2014/030514.pdf [accessed January 2015]. [ Links ]
MATTHEE, M., FAROLE, T., NAUGHTIN, T. & RANKIN, N.A. 2015. South African exporters and the global crisis: intensive margin shock, extensive margin hangover. South African Journal of Economics. Available at: http://onlinelibrary.wiley.com/doi/10.1111/saje.12094/pdf [accessed January 2016]. [ Links ]
NAUDÉ, W.A., BOSKER, M. & MATTHEE, M. 2010. Export Specialization and Local Economic Growth in South Africa. The World Economy, 33(4):552-572. [ Links ]
PURFIELD, C.M., FAROLE, T. & FERNANDO, I. 2014. South Africa economic update: Focus on export competitiveness. South Africa economic update; issue no. 5. Washington, DC; World Bank Group. Available at: http://documents.worldbank.org/curated/en/2014/01/18891973/south-africa-economic-update-focus-export-competitiveness [accessed January 2015]. [ Links ]
REIS, J.G. & FAROLE, T. 2012. Trade competitiveness diagnostic toolkit. World Bank Group: Washington, DC. Available at: http://siteresources.worldbank.org/INTRANETTRADE/Miscellaneous/22955722/ TCDtoolkitvJune2011.pdf [accessed January 2015]. [ Links ]
SHIROTORI, M., TUMURCHUDUR, B. & CADOT, O. 2010. Revealed factor intensity indices at the product level. Available at: http://unctad.org/en/docs/itcdtab46_en.pdf [accessed January 2015]. [ Links ]
STATSSA. 2015. Quarterly labour force survey, Quarter 3 2014. Available at: http://beta2.statssa.gov.za/publications/P0211/P02113rdQuarter2014.pdf [accessed February 2015]. [ Links ]
TURKCAN, K. 2014. Investigating the role of extensive margin, intensive margin, price and quantity components on Turkey's export growth during 1998-2011. MPRA Paper no. 53292. [ Links ]
UN COMTRADE. (2014). United Nations' Commodity Trade Statistics Database [Internet]. [ Links ] Available at: http://wits.worldbank.org/WITS/ [accessed December 2014]. New York, NY: United Nations Statistics Division.
WORLD BANK. 2012. Exporter dynamics database. Available from http://data.worldbank.org/data-catalog/exporter-dynamics-database [accessed December 2014]. [ Links ]
WORLD BANK. 2015. Development indicators of South Africa. Available at: http://databank.worldbank.org/data/views/reports/tableview.aspx [accessed January 2015]. [ Links ]
WTO-UNCTAD. 2012. A practical guide to trade policy analysis. Available at: http://wits.worldbank.org/WITS/docs/wto_unctad12_e.pdf [accessed January 2015]. [ Links ]
Accepted: November 2015
1 This author also acknowledges support from the National Research Foundation of South Africa (Grant Number 90709). Any opinion, finding and conclusion or recommendation expressed in this material is that of the authors and the NRF does not accept any liability in this regard.
Furthermore, the financial assistance of the World Trade Organization (WTO) towards this research is hereby acknowledged. Opinions expressed and conclusions arrived at are those of the authors and should not necessarily be attributed to the WTO.
2 Similar results on the contribution of the intensive margin to export growth can be found in studies on Turkey (Türkcan, 2014), China (Amiti & Freund, 2008), Colombia (Eaton et al., 2007), on a group of countries classified as both developed and developing (Amurgo-Pacheco & Pierola, 2008) and on the manufacturing sector of 46 countries (Besedes & Prusa, 2011).

