


Services on Demand
Article
 English (pdf)
 Article in xml format
 Article references
Indicators

Related links
-
 Cited by Google
 -
 Similars in Google
Share

 Permalink
South African Journal of Economic and Management Sciences
On-line version ISSN 2222-3436
Print version ISSN 1015-8812
S. Afr. j. econ. manag. sci. vol.19 n.2 Pretoria 2016
http://dx.doi.org/10.17159/2222-3436/2016/v19n2a4
ARTICLES
An exploration of the online investor relations (IR) practices of companies listed on the Johannesburg Stock Exchange (JSE)
Leana EsterhuyseI; Christa WingardII
IDepartment of Financial Intelligence, University of South Africa
IIDepartment of Financial Accounting, University of South Africa
ABSTRACT
Prior research has found that having better investor relations (IR) practices contributes towards improved share prices, liquidity of shares and analyst following. The main aim of this study was to determine the extent to which JSE-listed companies comply with international best practice guidelines for IR practices via the company's website. A secondary objective was to arrive at an opinion regarding the stage of internet adoption for IR practices in which JSE-listed companies find themselves, based on Hedlin's (1999) three-stage model. A checklist of 201 items was used to assess the websites of 205 JSE-listed companies from the beginning of July to mid-September 2012. The average online IR score for all 205 companies was found to be disappointing, although the top 100 companies in South Africa performed better than companies in other emerging and developing economies, but worse than companies in advanced economies, where size is probably the main differentiator. Bandwidth is also a constraining factor for online IR quality in South Africa. We conclude that instead of moving towards stage III (HTML, video and audio) of Hedlin's model (1999), JSE-listed companies still seem to find themselves in stage II (paper-equivalent PDF's). This should concern Chief Financial Officers (CFOs), as effective and efficient communication with investors could contribute towards attaining optimal share prices and improved liquidity and analyst following.
Key words: investor relations, voluntary information, integrated reporting, internet bandwidth, websites, PDF, HTML
JEL: G14, 32, M48, O33
1 Introduction
Following the 2008 global financial crisis, the South African Institute of Chartered Accountants (SAICA) surveyed the chief financial officers (CFOs) of the Johannesburg Stock Exchange (JSE's) top 40 companies in 2010 on their views of how their roles and responsibilities have changed. CFOs reported that in 2010, and for the next three years, communication management would be the third most important soft skill after leadership and problem-solving skills (SAICA, 2010:29). 58 per cent of CFOs indicated that they envisaged spending a lot or even most of their time on investor, stakeholder and market liaison and communication over the next three years. Communicating with stakeholders and investors was also repeatedly mentioned as a future challenge (SAICA, 2010:52).
Communication with capital markets has developed into a specialised function named investor relations (IR), liaising closely with the CFOs (Schoonraad, 2003). The Investor Relations Society (IRS, 2013) defines IR activities as "... the communication of information and insight between a company and the investment community. This process enables a full appreciation of the company's business activities, strategy and prospects and allows the market to make an informed judgement about the fair value and appropriate ownership of a company."
An effective IR programme could reduce the company's cost of capital by reducing information asymmetry and increasing the company's visibility and the tradability of its shares (Chang, D'Anna, Watson & Wee, 2008; Hunter & Smith, 2009; Bushee & Miller, 2012; Agarwal, Taffler, Bellotti and Nash, 2015). The company website is one of the channels of communication with the capital market and other interested stakeholders. Hedlin (1999:374) proposes a three-stage model for IR over the internet. During stage I, companies establish a web presence by introducing a website. During stage II, companies begin communicating financial information over the internet, and during stage III, they take advantage of the unique features and possibilities of the internet as a communication channel by including features that are not possible with paper-based reports. It follows that progressing from stage II to stage III would also depend on the bandwidth and internet saturation in a country.
In 2012, the World Economic Forum (WEF) reported that 21 per cent of the population in South Africa were using the internet, compared to 7,8 per cent in 2008 (WEF, 2009:227; 2012:325). The NetIndex of worldwide broadband download speeds indicates that South Africa's average download speed was 1,16 Mbps (megabits per second) in January 2008 versus 3,22 Mbps in June 2012 and 6,34 Mbps in November 2014 (Ookla, 2014). The growth in bandwidth and online users means that companies can reach a wider audience with their online IR programmes. Companies will be able to use bandwidth-intensive technologies such as videos, online conference calls with analysts, webcasts of presentations and interactive stock charting more widely and efficiently as bandwidth capacity increases for both companies and private investors.
The main aim of this study is to determine the extent to which the online IR practices of JSE-listed companies comply with international best practice guidelines. This should be of interest to CFOs as they have indicated that communicating with capital markets is an important skill that has also proved to be a major challenge since the 2008 global financial crisis (SAICA, 2010). Furthermore, studies by Verrechia (1983), Lang and Lundholm (1993), Botosan (1997), Sengupta (1998), Healy, Hutton and Palepu (1999) as well as Frankel, Johnson and Skinner (1999) have found that increased voluntary disclosure reduces the cost of capital of companies since it reduces information asymmetry between management and the owners of the company. A secondary aim is to form an overall opinion of the stage of adoption of the internet for IR practices, as proposed by Hedlin (1999).
In addressing the main research aim, a checklist of usability guidelines for online IR was compiled from Loranger and Nielsen (2009) and the Investor Relations Society (IRS) of the United Kingdom (UK) (2010). The websites of 205 JSE-listed companies of varying size and operating in various industries were reviewed from the beginning of July to mid-September 2012. The review focused on the presence of specific information as well as the technology and usability features on company websites. A composite disclosure score was computed across eleven broad categories, and descriptive statistics were compiled for analysis.
The literature review follows in the section below. The rest of the article discusses the research method used and the results obtained. Finally, conclusions are presented and recommendations made for future research.
2 Literature review
This study finds its theoretical basis in agency theory, information asymmetry and voluntary disclosure. The agency principles originated in the field of law. In terms of agency theory, shareholders (the principals) appoint managers as their agents to manage the company on their behalf. In the agency relationship, the shareholders are at risk that the board of directors (agents) would not act in the best interests of the shareholders. Therefore, the board of directors need to communicate the results of their stewardship actions to the shareholders. Since the shareholders of a large listed company are no longer involved in the day-to-day management of the company, they also lack detailed knowledge of the company's operations, strategies, markets and finances. This gives rise to information asymmetry, which refers to the situation where one party in a transaction or relationship has access to more or better information than the other party.
Akerlof (1970) illustrates how information asymmetry leads to adverse selection. In the securities market, adverse selection means that the under-informed party would only be willing to pay a lower price for a security or share in the present in an attempt to minimise potential losses in the future when they dispose of the share. This discount on the optimal price (that could have been achieved between two fully-informed participants in the capital market) is referred to as the cost of information asymmetry.
Spence (1973) builds on the work of Akerlof by explaining how the better-informed party (management) could incur signalling costs by voluntarily communicating more information to the under-informed parties (i.e. current and potential shareholders and debt providers). The increased signalling reduces the cost of information asymmetry (the discount), thereby increasing the value of the commodity or security. Companies could therefore reduce their cost of capital by minimising investors' uncertainty about the company (i.e. perceived risks) through increased voluntary disclosure about products, strategies, risks and opportunities (Lang & Lundholm, 1993; Botosan, 1997; Sengupta, 1998; Healy et al., 1999; Frankel et al, 1999).
The company's website could be used to signal additional voluntary information to capital markets. Loranger and Nielsen (2009:4) propose that in the "modern world, investors assume that they can go to www.company.comto research a current or potential investment". This holds true especially for private investors who may not have access to the same research resources as institutional investors. Regulations 3.4 to 3.8 of the JSE Listings Requirements (JSE, 2011) prohibit companies and their officials from disclosing information privately (i.e. to selected parties) that may have a material impact on the share price. Regulation 3.46 of the JSE Listings Requirements determines that after publishing announcements via the Stock Exchange News Service (SENS), companies are allowed to post the information on their websites and in the general news media (JSE, 2011). These regulations ensure that private investors, institutional shareholders and analysts all get value-relevant information at the same time.
Various studies were conducted in other parts of the world to determine how companies used their websites to communicate with investors.1 Instruments for measuring online communication practices have also become more elaborate over time in line with the increased demand from users and developing internet technologies. Prior studies in South Africa on the use of company websites for communicating financial information and for other IR activities include those by Lymer, Debreceny, Gray and Rahman (1999) (South Africa and 21 other countries); Roberts (1999), Venter (2002), Loxton (2003), Barak (2004), Nel (2004), Bollen, Hassink and Bozic (2006) (South Africa and five other countries); as well as Nel and Baard (2006) (South Africa and four other African countries).
Nel and Baard (2007) conducted the last available research on online investor communication practices for South Africa and four other African countries during June 2007. Nel and Baard (2007) reviewed the websites of the top 40 companies in South Africa in terms of market capitalisation at 31 December 2005. However, their checklist was limited, containing only eight items for content (representing broad categories rather than specific items) and twelve items for presentation (e.g. if the company presented the information on its IR pages, its own dedicated page or elsewhere on the website). Webpages for company information, annual reports, annual report archives and corporate governance were present for all forty websites. 39 companies had a news page, 38 had corporate governance pages and 37 had a page for shareholder information. Bondholder information was the least represented with only 15 companies making this information available.
The purpose of the studies mentioned above was to describe the extent to which larger South African companies (top 30, 40, 50 or 100) used the internet to communicate financial information. The information on the websites of companies other than the top 100 was not considered. The study of Nel and Baard (2007) addressed neither the internet methodologies (PDF, HTML, webcasts) employed on the websites nor any other usability features.
As pointed out before, bandwidth in South Africa has increased substantially since the previously mentioned studies, allowing for greater incorporation of new technology and increased focus on the usability of the website. Since the publication of the prior studies, Loranger and Nielsen (2009) and the United Kingdom's (UK) Investor Relations Society (IRS, 2010) have released new guidelines for online IR communication practices. It seems as if no further studies have been done on the usability of IR websites in South Africa since 2007. Therefore, the contribution of this study is to close the gap in knowledge of online IR practices in South Africa.
Two factors inform our expectation of the results. Firstly, the WEF (2012:325) ranked South Africa first among 144 countries for strength of auditing and reporting standards, efficacy of corporate boards and regulation of securities exchanges. South Africa was ranked second for the protection of minority shareholders' interests and third for obtaining financing through the local equity market. Secondly, the King III Code, published by the Institute of Directors (the King III Code of Governance for South Africa, IOD, 2009) requires that companies not only report on their financial statements, but also communicate issues relating to corporate governance, risk management, sustainability and integrated reporting. A stakeholder approach is also advocated, which means that companies are not only accountable to their shareholders and debt providers, but also to broader society. The reporting requirements for corporate governance, risk management, sustainability and integrated reporting according to the King III Code overlap to a large degree with the best practice guidelines of the IRS (2010) and Loranger and Nielsen (2009) with regard to the content that should be made available on the websites.
The King III Code applies to entities incorporated and resident in South Africa (IOD, 2009:16) and took effect on 1 March 2010 (IOD, 2009:17). It is part of the JSE Listings Requirements Service Issue 13 on an "apply or explain" basis for financial years commencing on or after 1 March 2010 (JSE, 2010). Ernst and Young's 2012 Excellence in Integrated Reporting Awards bestowed ratings of Top 10, Excellent (17 companies) and Good (29 companies) to companies included in the top 100 JSE-listed companies based on capitalisation on 31 December 2011 (Ernst & Young, 2012:3). Therefore, 56 per cent of the top 100 companies were rated as Good or higher in respect of the quality of their integrated reporting. Audit firm Nkonki (2012) reported that South Africa's top 100 companies are making good progress with implementing the King III Code reporting requirements, either in an extended annual report, separate social responsibility report or an integrated report.
The good ratings by the WEF, Ernst and Young and Nkonki described above, all relate to disclosures that are prescribed and require compliance by the JSE's Listing Requirements. The research question of this paper is therefore whether JSE-listed companies are equally willing to disclose voluntary information in content and manner outside the mandatory reporting formats that is accessible to all users. The WEF ratings and the high level of compliance found by Ernst and Young (2012) and Nkonki (2012) create the expectation that this study would find a high level of compliance with best practices for online IR practices.
Thus, the main research aim was to assess and describe compliance with international best practice guidelines for online IR practices as evidenced by company websites from a large cross-section of JSE-listed companies varying in size and industry. A secondary aim was to evaluate the maturity of online IR practices in South Africa in terms of Hedlin's (1999) three-stage model. The methodology used is described in the next section.
3 Research methodology
3.1 Development of the measurement instrument
The primary data was gathered by reviewing the websites of the selected companies according to a checklist for the presence or absence of certain information items, presentation technologies and usability features. ISO 9241-11 (ISO, 1998) defines usability as "the extent to which a system can be used by specified users to achieve a specified goal with effectiveness, efficiency and satisfaction in a specified context of use". Research by the Nielsen Norman Group (2011) revealed that websites should attract a visitor's attention within ten seconds; otherwise, visitors would leave the site in increasing numbers during the next twenty seconds. Therefore, usability guidelines focus on navigating the user to the desired information swiftly, and on making it easy for the user to view and use information.
We developed a checklist from the second edition of Designing Websites to Maximize Investor Relations Usability - Guidelines for Investor Relations (IR) on Corporate Websites (Loranger & Nielsen, 2009). Loranger and Nielsen compiled their guidelines after analysing 94 websites and observing 63 users (finance professionals and individual investors) in usability studies (Loranger & Nielsen, 2009:4). Six years passed between Loranger and Nielsen's 2003 and 2009 IR usability studies, yet they found in their 2009 study that investors were still viewing or using websites in the same way (Loranger & Nielsen, 2009:7). However, Loranger and Nielsen noted that presentation features such as webcasts for analysts' presentations were much more prevalent than previously (2009:7). This is in line with the development of more complex presentation features as the bandwidth in countries, expanded over time.
To validate Loranger and Nielsen's 2009 guidelines, we compared them to the UK Investor Relations Society's 2010 IR Best Practice - Web guidelines as well as prior literature and found Loranger and Nielsen's 2009 guidelines to be complete and comprehensive, especially with regard to presentation and usability. The 103 guidelines contained in Loranger and Nielsen (2009:29-193) were converted to checklist items to accommodate a "present/not present" answer. For example, guideline 101 (Loranger & Nielsen, 2009:192) requires that for each IR contact the time zone and hours of availability are provided. In the checklist used for our study, the "time zone" and the "hours of availability" became two separate items. The final number of items included in the checklist came to 201. A further incremental contribution of our study is that our extensive measuring instrument is based on guidelines developed by usability experts (Loranger & Nielsen) as well as IR practitioners in the UK (IRS). With the exception of Abdelsalam, Bryant and Street (2007),2 other researchers in the area of internet usage for financial and investor communication, utilised self-developed checklists or other academic researchers' published checklists (the maximum number of items was 76). The comparison will be discussed in more depth in the Results section.
Our checklist items could be divided into three categories: namely, information/content items (e.g. the qualifications of directors); presentation items (e.g. a webcast of the annual general meeting); as well as usability items (e.g. providing the size of PDF files in megabits next to the description of the downloadable PDF file to help the user estimate how long the download will take, depending on their own bandwidth). The final checklist was then converted to an online survey format in LimeSurvey. This afforded the possibility of building certain checks and balances into the checklist to ensure internal consistency, as certain items only opened up if a previous item was indicated as present (e.g. the features of the stock chart only opened up if a stock chart was ticked as being present). Further guidance and hints were also provided in the online checklist next to the items. There were no Likert scale-type questions requiring opinion or interpretation, nor any thematic coding in the conventional sense of qualitative research studies. Surveys could not be submitted unless all required items had been answered.
3.2 Pilot and data gathering
Four post-graduate finance students were used as proxies for private investors. Hodge, Kennedy and Maines (2004), Elliot, Hodge, Kennedy and Pronk (2007), Janvrin, Pinsker and Mascha (2013) as well as Basoglu and Hess (2014) have argued that using graduate business students as proxies for nonprofessional (private) investors is a valid methodological choice. Training on the use of the survey format was provided over three days. Firstly, the website of BASF, an international company that previously won awards from the UK IRS for excellent online IR, was reviewed by all students in a group setting as an example of what good online IR is. Thereafter, the students individually assessed a local company, Kumba Iron Ore, which Ernst and Young rated Excellent for good integrated reporting disclosure practices (2012:3; 2013:5), by means of a hardcopy online survey form. The results were then reviewed together, and the main researcher clarified uncertainties. The students then reviewed a second JSE-listed company with a very limited website on their own to appreciate the difference between an extensive and a perfunctory website. The results were once again reviewed together. Thereafter, the companies in the sample were randomly allocated to the students, and they subsequently reviewed the websites from the beginning of July to mid-September 2012. The specific websites were reviewed by toggling between the company website window and the LimeSurvey window. If the students encountered any uncertainties, they contacted the main researcher. We then accessed the problematic company website together and came to a joint conclusion.
3.3 Coding
The concept of "present on the website" in this study needs clarification. The implementation of the King III Code (IOD, 2009) to financial years beginning on or after 1 March 2010 has resulted in many previously voluntary disclosures now being "mandatory"3. Several of this study's content checklist items can also be described as complying with the spirit of the King III Code requirements for the integrated report. For example, Loranger and Nielsen's guideline, which "acknowledges the challenges your company faces and explains the company's plan to address them" (2009:58) is similar to recommended practice 9.2.4: "The board should ensure that the positive and negative impacts of the company's operations and plans to improve the positives and eradicate or ameliorate the negatives in the financial year ahead are conveyed in the integrated report" (IOD, 2009:50). Audit firms such as Ernst and Young (2012) and Nkonki (2012) report that South Africa's top 100 companies are making good progress with implementing the King III Code's reporting requirements (either in an "extended annual report", separate social responsibility report or an integrated report).
We therefore need to distinguish between disclosing information in the integrated report (or variations thereof) and disclosing information on the IR pages of the website itself. This study does not involve an assessment of the completeness of integrated reporting, but rather the use of the internet as an IR communication channel. While evaluating a website, an item was only ticked present if it was available as a menu item somewhere on the company's website (e.g. "Investment proposition" under the "Investor relations" tab), or if a hyperlink with that (or a similar) name took the user from the IR pages directly to the discussion of the information in the annual or integrated report. The item was not ticked present if it was only found in the annual or integrated report and the user had to use the website's search box to find the information because it was not available elsewhere in the "Investor relations" or "About us" pages. The point of departure for effective IR should therefore be to present information that users will be interested in as "permanent" information on the webpages - separate from financial and other reports available on the website. As a general rule, all the ticked fields were scored as "1" and the absence of an item as "0".
The second focus of the study was on how companies used the presentation features of the internet to communicate with investors (and other stakeholders). This analysis is required to determine whether companies had moved on to stage III of Hedlin's (1999) model, where they use internet features which cannot be incorporated into printed communication material. Certain items, such as video "virtual tours" of operations, interactive stock charts, social media links and links to brokers' consensus forecasts were scored with "2" if present, as these demonstrated additional effort to use the internet's unique capabilities to communicate with investors. This weighting toward technology items is consistent with the weighted disclosure quality index of Bollen et al. (2006) as well as that of Abdelsalam, et al. (2007).
For each company subtotals were calculated for eleven areas,4 after which a total disclosure score (TOTDS%) was expressed as a percentage of the maximum available marks of 244. The checklist results in LimeSurvey were then exported to MS Excel. This eliminated the need to capture each checklist manually in Excel and reduced capture error. After reviewing the data for completeness in MS Excel, it was exported to SPSS software for the statistical analyses.
3.4 Sample
The INET BFA database was used to determine the sample and to collect the stock exchange data. The final sample was compiled in stages. Firstly, a list was extracted of companies listed on the JSE Main Board on 1 June 2012, including their initial listing date, main industry sector and market capitilisation. The population consisted of 338 companies with listed ordinary shares.5 Secondly, the 338 companies were then filtered to include only those companies that had already been listed on 30 June 2002 in order to obtain long-term market data (not reported on in this paper). 188 companies were already listed on 30 June 2002 and were still listed on 1 June 2012. Thirdly, the 188 companies were then ranked from large to small in terms of market capitalisation on 1 June 2012.
Research on internet usage for financial and investor communication in South Africa (Nel & Baard, 2006:3; 2007:3), as well as integrated reporting studies by audit firm Ernst and Young (2012:13), were performed on the top 100 (market capitalisation on 31 December of each year) or higher companies.6 We therefore followed the same methodology by generating a separate rankedlist based on market capitalisation on 31 December 2011. Fourthly, the initial ranked list of 188 companies (listed for ten years or longer) was compared to the second ranked list of all JSE-listed companies in terms of market capitalisation on 31 December 2011.5 87 companies appeared on both lists, which resulted in another 13 companies being added to complete the top 100 based on market capitalisation on 31 December 2011. The combined sample at this stage consisted of 201 companies. Expecting that some companies in the drawn sample might not have accessible websites or which might be excluded for being pure holding companies or dual listed shares (both shares listed in the top 100), the next 12 companies (ranked 100 to 112)7 in terms of market capitalisation on 31 December 2011 were also added to the sample, bringing the total sample to 213 companies.
Fifthly, for the purposes of supplemental analysis of the regression model without industry effect (not reported on in this paper), it was decided to include all companies from one of the nine main sectors of the JSE. Anticipating six independent variables in a regression model, this sector should have at least 60 companies, for the model to be tested reliably. The relatively small number of companies listed on the JSE eliminated many industry sectors. It was decided to combine the Consumer Goods and Consumer Services sectors. A complete list of all the companies in the Consumer Goods and Consumer Services sectors of the JSE on 1 June 2012 was extracted (26 and 42 companies respectively). The augmented sample list of 213 companies was classified by JSE main sector. A comparison led to a further ten companies being added to the selection in order to achieve complete representation of the Consumer Goods and Consumer Services sectors. The sample then totalled 223 companies.
In arriving at the final sample, seven pure investment holding companies and two dual-listed securities were excluded (as the South African share had already been included). Six smaller companies did not have websites, and two websites were unavailable at the time of the analysis. One company was also excluded later as it delisted between when the sample was compiled and when its website was due to be assessed. That left a total of 205 remaining companies whose websites and IR pages were assessed for content, method of presentation and usability (61 per cent of the JSE Main Board population of 338). The total market capitalisation of the selection was R6,3 trillion (R6,3 x 10Λ12), representing 97 per cent of the R6,5 trillion market capitalisation of all listed ordinary equity on the JSE on 1 June 2012 (excluding property income funds). The average market capitalisation of all listed normal equity instruments was R19,3 billion (R19,3 x 10Λ9), while that of the selected sample was R33,1 billion.
3.5 Limitations
A possible limitation of the study is that completed checklists were not verified by a second person as websites, by their very nature, change continually. We did not have the facility to save complete websites as is. It was therefore not possible for a second person to verify the results after the original evaluation of the websites. We contend however that the students acted as proxies for private investors from the general population, who also might have overlooked some information had they participated in the survey.
Our definition of usability prescribed that users should be able to find information quickly and easily. We therefore erred on the side of caution by accepting that an item was not present while in fact it was and could be found by a second person searching for it on the website (which does not meet our requirements for usability). The programmed structure of the online LimeSurvey and the guidance provided on the survey webpage next to each item may also have resulted in limited misinterpretations of items' presence or absence on the website. As mentioned earlier, the survey included neither Likert scale-type questions requiring opinion or interpretation nor thematic coding in the conventional sense of content analysis studies which might have necessitated a second review to ensure consistency of coding.
4 Results and discussion
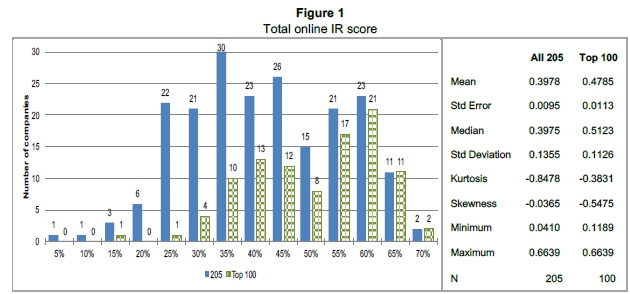
Figure 1 presents the descriptive statistics based on the comprehensive disclosure score for each of the 205 websites analysed as well as the top 100 companies. The mean score for the total selection is 39,78 per cent, with a standard deviation of 13,55 per cent. The graph clearly indicates quite a wide dispersion. The mode for all 205 is located between 30 and 35 per cent and contains 30 companies. The distribution is slightly negatively skewed with a negative kurtosis due to the wide distribution of scores. The mean score for the top 100 companies is higher at 47,85 per cent with a slightly lower standard deviation of 11,26 per cent. The top 100 mode is located between 55 and 60 per cent and contains 21 companies. The shift to higher scores led to an increase in the negative skewness of the top 100 distribution.
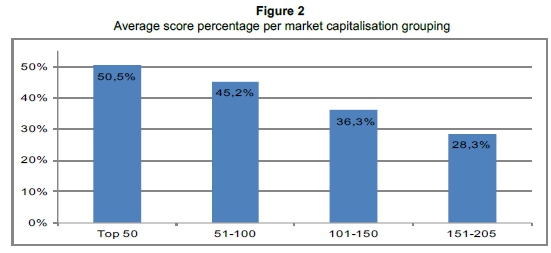
As argued in the literature review section, we expected South African companies to perform well. The overall mean score of 39,78 per cent was therefore disappointing. The lower performance of the South African companies in the current study might be attributable to the fact that we included 205 companies and not only the top 50 or top 100 as in other studies. If we group the scores per market capitalisation on 31 December 2011, the effect is slightly better for the larger companies. Figure 2 indicates that the mean score for the top 50 companies per market capitalisation is 50,5 per cent versus 28,3 per cent for the bottom 55 companies. The companies with smaller market capitalisation do not seem to make an effort to utilise their website to communicate with investors. It is also unsatisfactory that 49 of the top 100 companies scored below 50 per cent with the lowest score reported as 11,89 per cent.
The promising findings of Ernst and Young (2012) and Nkonki (2012) based on the top 100 companies seem to be limited to the integrated report and do not extend to company websites. One possible explanation might be that CFOs and IR departments were focusing on adapting to the integrated reporting requirements of King III Code (IOD, 2009) over the previous two years and neglected the website as a communication channel. One would hope to see synergies from the integrated report flowing to the website in the future as many of the content items (e.g. risks and future plans) in the IR best practice guidelines (1RS, 2010; Loranger & Nielsen, 2009) should in any case be communicated in the integrated report.
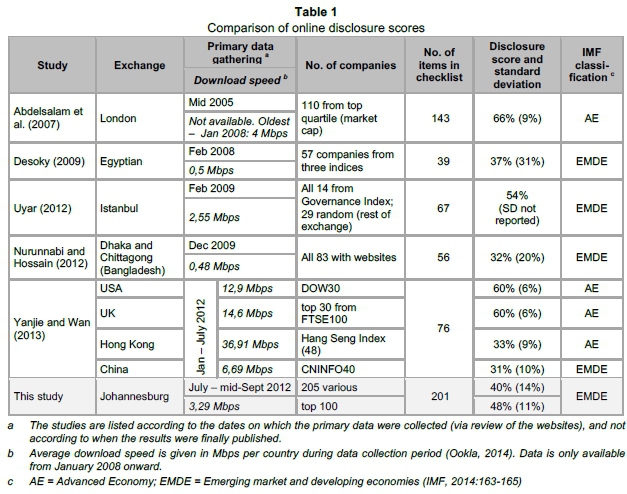
In Table 1 we present this study's total disclosure score together with that of reported studies from other countries that used checklists containing more than 35 items. In terms of comprehensiveness, our checklist has most in common with the study of Abdelsalam et al. (2007) which reported incorporating items from Loranger and Nielsen's earlier guidelines published in 2003, whilst the current study is based on Loranger and Nielsen's 2009 guidelines.
In terms of its financial institutions, South Africa was ranked first in the 2012-2013 Global Competitiveness Index (WEF, 2012:325) for its regulation of securities exchanges together with strength of auditing and reporting standards and efficacy of corporate boards. Soundness of banks and availability of financial services were both ranked second. Financing through the local equity market is ranked third. Given this institutional regime, we would expect a disclosure score of higher than 39,8 per cent and more in line with the UK study of Abdelsalam et al. (2007) as well as the later results of Yanyie and Wan (2013) for the UK and United States of America (USA).
Although the South African top 100 companies' mean score of 47,9 per cent is slightly better than our full sample's score, it is still disconcertingly low, especially since 27 of the top 100 JSE-listed companies are cross-listed on UK, USA or European exchanges (albeit not necessarily in the top 30 or top 100 of those exchanges based on market capitalisation). Being listed on a foreign stock exchange (in addition to the local exchange) was found to be significantly positive for online financial reporting quality by Debreceny, Gray and Rahman (2002), Bollen et al. (2006) and Desoky (2009). Our study's comparatively poorer results are probably related to the size difference of the companies included in each study as prior literature indicates that larger companies are generally better at voluntary disclosures.
When we consider the economic classification of South Africa (IMF, 2014:163-165) as an emerging market and developing economy (EMDE), the average disclosure score of all 205 companies is better than those of all other EMDE countries except Turkey. In general, it also seems that the scores achieved in studies in the emerging markets were lower and displayed greater variability in companies' IR relations. Once again, size in terms of market capitalisation may have an influence since the DOW30 and FTSE100 companies are much larger in terms of market capitalisation than the JSE and other EMDE companies.
Finally, we consider the effect of available bandwidth at the time of the individual surveys. South Africa performed worse than the UK and USA (Yanjie & Wan, 2013). These countries' available bandwidths were almost four times higher than South Africa's in 2012. However, South Africa performed better than some of the developing countries with lower available bandwidth. The NetIndex (Ookla, 2014) has only had comparative bandwidth data publicly available for countries since January 2008. Therefore, we assume that the bandwidth for the UK during mid 2005 should have been lower than the four megabytes per second (Mbps) reported in January 2008. Yet, the average score of the South African top 100 companies (48 per cent) at available bandwidth of 3,29 Mbps is lower than the 66 per cent of the 110 UK companies. Further research is required to establish whether factors apart from size might be driving South African companies' voluntary disclosure behaviour.
We will now explore how companies performed in each of the 11 broad areas of online IR practices as presented in Figure 3. The areas that achieved the best scores were Getting to corporate information (96 per cent) and General usability (76 per cent). Companies were doing well in attracting visitors to their website by having a logical website name and appearing in the top three search results when using a search engine such as Google. Companies were also applying general usability guidelines for their websites such as search boxes, consistent tabs on all pages, etc. The low overall mean score is mostly due to low ratings for the areas of Presentations (19 per cent), Contacting IR (19 per cent), Calendar (31 per cent) and the Share details (33 per cent). These areas also had high standard deviations reflecting a wide dispersion in practices between companies. The top 100 companies performed between nine and eleven per cent better in these areas, but still scored below 50 per cent.
Private investors would be highly interested in the presentation slides or a video of the presentation, yet this was not available for many of the companies. Only a third of companies hosted a video or webcast of any event with or presentation to analysts/investors/shareholders. The top 100 companies fared slightly better at 53 per cent. Usability features such as indicating the length of the video were also not always available. The requirements for the IR calendar of events and details regarding the company's dividend policy, analysts following the company, details of joint listings etc. were also poorly complied with. It is interesting that IR departments themselves were not complying with the best practices requirements for contacting them, especially with regard to assisting overseas investors or analysts to contact local IR officials. Websites mostly contained a general IR contact telephone number and e-mail address only.
Arguably, most visitors to the company website are interested in the financial reports of the company. We were surprised by the low score of 37 per cent in this area. This can mostly be attributed to the fact that companies continue to provide financial reports in PDF rather than in HTML or other electronic formats better suited for the internet. No companies in the sample provided financial reports in extensible business reporting language (XBRL) on their website (although some of the top 100 were part of the XBRL project).8 Although we assessed this guideline, it was not included in the total available marks as it is not currently required in South Africa (as opposed to the USA, where certain forms have to be lodged in XBRL).
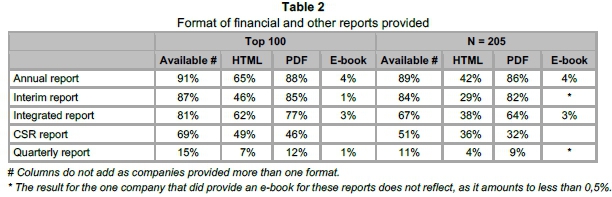
Table 2 presents the different presentation formats companies used for their annual and other reports. As can be expected, most companies provided an annual report (89 per cent) and an interim report (84 per cent). Only two of the 205 companies provided neither an annual nor an integrated report, with one of them at least providing the annual financial statements and commentary. (The other company was incorporated in Zimbabwe and was very small.) We also expected a higher compliance rate (67 per cent) for the integrated report, as it is compulsory to prepare one for financial years starting on or after 1 March 2010. Companies could at least have posted the PDF version, but only 64 per cent of them did so. A possible explanation could be that some companies divided the information required by the integrated report between the annual report and a corporate social responsibility (CSR) report. 51 per cent of companies provided a separate CSR report. Notably, more companies provided an HTML version of this report (36 per cent) rather than a PDF version (32 per cent). Furthermore, 11 per cent of companies provided quarterly reports. Overall, our study found a ratio of approximately 2:1 for PDF to HTML for all 205 companies' reports.
The top 100 companies performed better, especially in providing integrated and CSR reports. Similarly to the full sample, the top 100 companies also provided more CSR reports in HTML than PDF. Analyses of the top 100 companies indicate a higher application of HTML (although PDF still dominates), especially for the integrated report, which is the newer reporting format. The ratio of HTML to PDF reports overall was also much better for the top 100 companies. This is probably due to larger companies having more resources available to invest in the development of the HTML webpages.
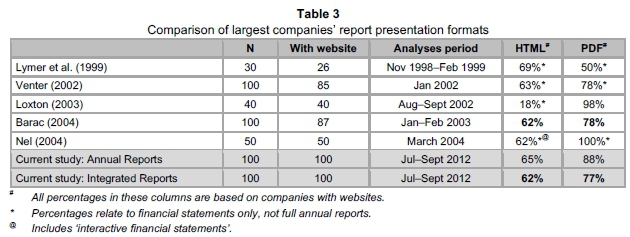
If one compares the annual and integrated report presentation formats for this study with those of previous studies of South African companies, an interesting trend seems to emerge from Table 3. Note that all of the prior studies listed, excluding Barac (2004) and Loxton (2003), referred to financial statements and not to the complete annual report. The latter is a much more comprehensive document and over time has grown to hefty proportions. The earliest research by Lymer et al. (1999) found that HTML was more prevalent than PDF. Their study was based on the top 30 companies and was conducted at a time when the internet was becoming a popular communication tool. 69 per cent of the companies provided financial statements in HTML format. A possible reason for this high rate could be that early adopters of technology were eager to experiment with HTML reports. It would also not have been a huge project to convert the lesser number of pages of the financial statements to HTML.
All subsequent studies have found the opposite, namely that PDF was more prevalent than HTML. The prevalence of HTML has declined slightly over time and has remained in the low sixties. If we compare our study's findings for the top 100 companies' integrated report formats with the annual report formats of Barac (2004:13) conducted over nine and a half years earlier, we find that they are virtually identical. We concluded that despite increases in bandwidth over the past decade, even the larger companies have not yet moved to interactive HTML as their preferred method of presenting reports on the company's website.
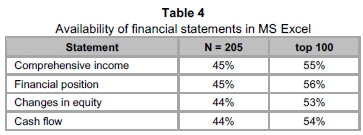
Companies also provided financial statements in downloadable format (Table 4) that enables users to further manipulate the information without re-entering information. Nel (2004:8) found that of the top 50 companies, only 26 per cent provided MS Excel statements. Therefore, the current finding of 44-45 per cent is a huge improvement, given the larger sample. Once again, the top 100 companies scored about ten per cent better in this regard. However, given that most, if not all companies would have their financial statements in spreadsheet format in any case, it is not clear why more companies do not provide users access to information in this user-friendly format.
Hedlin (1999) proposed that as the internet gains acceptance as a channel for IR activities, companies would over time prefer using HTML reports due to the additional features (e.g. hyperlinks) that HTML provides as well as providing material that cannot be replicated in a printed report (e.g. webcasts). The continued observed preference in South Africa of the largest companies for PDF rather than HTML is contrary to expectation, especially as internet bandwidth has increased in the last decade. For the rest of our sample, the preference for PDF is even more pronounced. In respect of webcasts and videos (evidence of stage III) on the websites, the adoption rate is also poor.
Therefore, in respect of our secondary aim, we conclude that the majority of South African companies seem to remain in stage II of Hedlin's (1999) model for adopting the internet for IR practices. An explanation could be that as the sample populations increased, they included smaller market capitalisation companies that do not invest so much in their IR activities. Industry affiliation could also explain differences. The influence of low liquidity of the JSE on companies' voluntary disclosure behaviour should also be considered. Further analysis of this phenomenon is required in future studies.
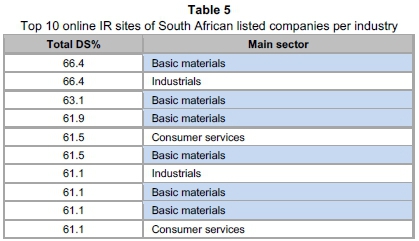
Finally, Table 5 displays the scores and the industry sector of the top 10 performers for online IR in South Africa. The top performers' scores are in a very close range, with some even achieving the same score. The majority of the top ten companies are from the mining sector and are very large in terms of market capitalisation. This agrees with the findings of Ernst and Young (2012:3) in their evaluation of integrated reporting, where mining companies performed very well. Further research needs to be undertaken to determine the extent to which market capitalisation and industry are drivers of the online disclosure behaviour of South African companies.
In summary, we find that some of the larger companies are making an effort to use the unique features of the internet for communicating with investors, but there is still room for improvement. However, in general, compliance with best practices for online IR was poor. Companies are not yet applying the more advanced features available for communicating with investors. Uncertainty surrounding the initial implementation of the integrated report could have caused CFOs and IR departments to delay investment in their IR pages until more clarity was obtained.
5 Conclusion and recommendations for further research
In 2010, JSE-listed companies' CFOs reported that communication management would be the third most important soft skill after leadership and problem solving skills for the three years ahead and that they envisaged spending a lot or even most of their time on investor, stakeholder and market liaison and communication over the next three years (SAICA, 2010:29). Communicating with stakeholders and investors was also repeatedly mentioned by CFOs as future challenges (SAICA, 2010:52). In 2012, the WEF (2012:325) ranked South African companies first for the strength of their auditing and reporting standards, which covers the compulsory reporting of companies. Ernst and Young (2012) and Nkonki (2012) were equally satisfied with the progress made by JSE-listed companies in applying the principles of King III. These accolades created the expectation that voluntary disclosures by South African companies via their website would also comply with international best practice. The NetIndex of worldwide broadband download speeds indicated that South Africa's average download speed improved from 1,16 Mbps in January 2008 to 3,22 Mbps in June 2012 (Ookla, 2014) affording companies the opportunity to use more of the internet's features for communicating with investors.
Our main research aim was therefore to determine how JSE-listed companies were using the increased internet bandwidth available to them to communicate with investors. The companies' websites were measured against international best practice guidelines for online IR. The total average online IR score for all 205 companies was a disappointing 39,8 per cent with a relatively large standard deviation (13 per cent), indicating a wide array of practices. The top 100 companies performed slightly better with an average of 47,9 per cent. When we compared our summary results to those of other international studies, South African companies performed better than companies in other emerging and developing economies, but performed worse than companies in advanced economies, where size is probably the main differentiator.
Accessing the websites as well as general usability was satisfactory, but other features of the websites, such as presentations to shareholders or analysts and contacting the IR department were neglected. PDF annual and integrated reports for the whole sample were almost twice as prevalent as HTML reports. Our secondary objective was to form an opinion on the development stage of online investor relations of JSE-listed companies. Despite advances in internet technologies and available bandwidth, our findings indicate that many companies were still not utilising unique features of the internet for communication, demonstrating that they have not moved towards stage III of Hedlin's (1999) model for online IR practices.
A limitation of the study was the real-time nature of websites. It was not possible to make copies of the websites at the time of assessment, which made the subsequent verification of the findings impossible. However, the structured nature and guidance contained in the checklist in LimeSurvey removed a lot of uncertainty for the fieldworkers. Although the results of the study were based on only 205 companies (of 338 listed on the JSE at the time), these companies represented 97 per cent of the JSE's market capitalisation.
Despite high ratings awarded for compliance with accounting and auditing standards by the WEF (2012), this study finds that South African companies' practices in respect of voluntary disclosure seems to differ from the high-level compliance with mandatory disclosures. In the next phase of the study, determinants of online investor relations practices (which are mostly voluntary) will be investigated. Further research could also be conducted with the CFOs and IR officers in South Africa to elicit their views on the use of the internet as a cost-effective investor communications channel and the extent of resources invested in IR activities. A follow-up study could also be conducted, as bandwidth increases continuously.
This study contributes to the literature on information asymmetry and voluntary disclosures by finding that JSE-listed companies were not yet using the internet to its fullest capacity/extent in communicating with investors, compared to other developed capital markets, despite improvement in the availability of internet technologies in South Africa. It also highlighted that JSE-listed companies are not following guidelines for voluntary disclosure practices as diligently as those for mandatory disclosures. Even the top 100 companies were complying on average with less than half of the guidelines. For the first time, companies outside the top 100 were included in an online IR study. The IR department, under the auspices of the CFO, plays an important role in communicating the company's prospects to investors and shareholders in an effort to reduce information asymmetry. IR practitioners and CFOs in South Africa could benefit from a better understanding of the best practices for online IR.
Acknowledgements
The financial support from the University of South Africa's Masters and Doctoral Support Programme as well as the Academic Qualification Improvement Programme is acknowledged.
References
ABDELSALAM, O.H., BRYANT, S.M. & STREET, D.L. 2007. An examination of the comprehensiveness of corporate internet reporting provided by London-listed companies. Journal of International Accounting Research, 6(2):1-33. [ Links ]
AGARWAL, V., TAFFLER, R.J., BELLOTTI, X. & NASH, E.A. 2015. Investor relations, information asymmetry and market value. Accounting and Business Research, 46(1):31-50. [ Links ]
AKERLOF, G. 1970. The market for lemons: Quality uncertainty and the market mechanism. Quarterly Journal of Economics, 84:485-500. [ Links ]
ASHBAUGH, H., JOHNSTONE, K.M. & WARFIELD, T.D. 1999. Corporate reporting on the internet. Accounting Horizons, 13(3):241-258. [ Links ]
BARAC, K. 2004. Financial reporting on the internet in South Africa. Meditari Accounting Research, 12(1):1-20. [ Links ]
BASOGLU, K.A. & HESS, T.J. 2014. Online business reporting: A signaling theory perspective. Journal of Information systems, 28(2):67-101. [ Links ]
BOLLEN, L., HASSINK, H. & BOZIC, G. 2006. Measuring and explaining the quality of internet investor relations activities: A multinational empirical analysis. International Journal of Accounting Information Systems, 7:273-298. [ Links ]
BOTOSAN, C.A. 1997. Disclosure level and the cost of equity capital. The Accounting Review, 72(3):323-349. [ Links ]
BUSHEE, B.J. & MILLER, G.S. 2012. Investor relations, firm visibility, and investor following. The Accounting Review, 87(3):867-897. [ Links ]
CHANG, M., D'ANNA, G., WATSON, I. & WEE, M. 2008. Does disclosure quality via investor relations affect information asymmetry? Australian Journal of Management, 33:375-400. [ Links ]
CRAVEN, B.M. & MARSTON, C.L. 1999. Financial reporting on the internet by leading UK companies. The European Accounting Review, 8(2):321-333. [ Links ]
DEBRECENY, R., GRAY, G. L. & RAHMAN, A. 2002. The determinants of internet financial reporting. Journal of Accounting and Public Policy, 21:371-394. [ Links ]
DELLER, D., STUBENRATH, M. & WEBER, C. 1999. A survey on the use of the internet for investor relations in the USA, the UK and Germany. The European Accounting Review, 8(2):351-364. [ Links ]
DESOKY, A.M. 2009. Company characteristics as determinants of internet financial reporting in emerging markets: The case of Egypt. Accounting in Emerging Economies, 9:31-71. [ Links ]
ELLIOT, W.B., HODGE, F.D., KENNEDY, J.J. & PRONK, M. 2007. Are MBA students a good proxy for nonprofessional investors? The Accounting Review, 82(1):139-168. [ Links ]
ERNST & YOUNG. 2012. Ernst & Young's excellence in integrated reporting awards 2012 - A survey of integrated reports from South Africa 's top 100 companies and top 10 state-owned entities. Johannesburg: Ernst & Young Global Limited. [ Links ]
ERNST & YOUNG. 2013. EY's excellence in integrated reporting awards 2013 - A survey of integrated reports from South Africa's top 100 JSE listed companies and top 10 state owned companies. Johannesburg: Ernst & Young Global Limited. [ Links ]
ETTREDGE, M., RICHARDSON, V.J. & SCHOLZ, S. 2001. The presentation of financial information at corporate websites. International Journal of Accounting Information Systems, 2:149-168. [ Links ]
FASB. 2000. Electronic distribution of business reporting information. New York: Financial Accounting Standards Board. [ Links ]
FRANKEL, R., JOHNSON, M. & SKINNER, D.J. 1999. An empirical examination of conference calls as a voluntary disclosure medium. Journal of Accounting Research, 37(1):133-150. [ Links ]
GEERINGS, J., BOLLEN, L.H.H. & HASSINK, H.F.D. 2003. Investor relations on the internet: A survey of the Euronext zone. The European Accounting Review, 12(3):567-579. [ Links ]
GOWTHORPE, C. & AMAT, O. 1999. External reporting of accounting and financial information via the internet in Spain. The European Accounting Review, 8(2):365-371. [ Links ]
HEALY, P.M., HUTTON, A.P. & PALEPU, K.G. 1999. Stock performance and intermediation changes surrounding sustained increases in disclosure. Contemporary Accounting Research, 16(3):485-520. [ Links ]
HEDLIN, P. 1999. The internet as a vehicle for investor relations: The Swedish case. The European Accounting Review, 8(2):373-381. [ Links ]
HODGE, F.D., KENNEDY, J.J. & MAINES, L.A. 2004. Does search-facilitating technology improve the transparency of financial reporting? The Accounting Review, 79(3):687-703. [ Links ]
HUNTER, S.A. & SMITH, M. 2009. Impact of internet financial reporting on emerging markets. Journal of International Business Research, 8(2):21-41. [ Links ]
IMF. 2014. World economic outlook: Legacies, clouds, uncertainties. Statistical appendix. Washington DC: International Monetary Fund. [ Links ]
INSTITUTE OF DIRECTORS - see IOD.
INVESTOR RELATIONS SOCIETY - see IRS.
IOD. 2009. Code of governance for South Africa, Parklands: Institute of Directors of Southern Africa. [ Links ]
IRS. 2010. IR best practice - Web guidelines. Investor Relations Society UK. Available at: http://www.ir-soc.org.uk [accessed February 2010]. [ Links ]
IRS. 2013. Definition of investor relations. Investor Relations Society, London. Available at: http://www.irs.org.uk/about/definition-of-investor-relations [accessed April 2013]. [ Links ]
ISO 9241-11. 1998. Ergonomic requirements for office work with visual display terminals (VDTs). Part 11 : Guidance on usability. International Organisation for Standardization, Geneva. [ Links ]
JANVRIN, D.J., PINSKER, R.E. & MASCHA, M.F. 2013. XBRL-enabled, spreadsheet, or PDF? Factors influencing exclusive user choice of reporting technology. Journal of information systems, 27(2):35-49. [ Links ]
JOHANNESBURG STOCK EXCHANGE - see JSE.
JSE. 2011. JSE Limited listings requirements, Johannesburg: Johannesburg Stock Exchange, Service Issue 14. [ Links ]
KOTHARI, S.P., LI, X., & SHORT, J.E. 2009. The effect of disclosures by management, analysts, and business press on cost of capital, return volatility and analyst forecasts: A study using content analyses. The Accounting Review, 84(5):1639-1670. [ Links ]
LANG, M. & LUNDHOLM, R. 1993. Cross-sectional determinants of analyst rating of corporate disclosures. Journal of Accounting Research, 31(2):246-271. [ Links ]
LORANGER, H. & NIELSEN, J. 2009. Designing websites to maximize investor relations - Usability guidelines for investor relations (IR) on corporate websites. Nielsen Norman Group (2nd ed.) 202. [ Links ]
LOXTON, L. 2003. Beleggersverhoudinge op die internet: 'n Ondersoek in Suid-Afrika. Meditari Accountancy Research, 11:81-93. [ Links ]
LYMER, A., DEBRECENY, R., GRAY, G.L. & RAHMAN, A. 1999. Business reporting on the internet. London: International Accounting Standards Committee (IASC). [ Links ]
MARSTON, C. & EMPSON, J. 2003. A survey of investor relations among the top 500 European companies. Paper presented at XXVI Annual Congress of the European Accounting Association, Seville, Spain:43. [ Links ]
NEL, G. 2004. Future of financial reporting on the internet. South African Journal of Information Management, 6(2). Available at: http://www.sajim.co.za [accessed February 2012]. [ Links ]
NEL, G. & BAARD, R. 2006. Using corporate websites in Africa to market to investors South African Journal of Information Management, 8(3). Available at: http://www.sajim.co.za [accessed February 2012]. [ Links ]
NEL, G. & BAARD, R. 2007. Do corporate websites in Africa communicate investor information according to best practice guidelines? South African Journal of Information Management, 8(3). Available at: http://www.sajim.co.za [accessed February 2012]. [ Links ]
NIELSON NORMAN GROUP. 2011. How long do users stay on web pages? Available at: http://www.nngroup.com/articles/how-long-do-users-stay-on-web-pages/ [accessed June 2013]. [ Links ]
NKONKI. 2012. Insights into top 100 integrated reporting trends, Johannesburg: Nkonki Inc. [ Links ]
NURUNNABI, M. & HOSSAIN, M.A. 2012. The voluntary disclosure of internet financial reporting (IFR) in an emerging economy: A case of digital Bangladesh. Journal of Asia Business Studies, 6(1): 17-42. [ Links ]
OOKLA. 2014. NetIndex, Ookla. Available at: http://explorer.netindex.com/maps# [accessed November 2014]. [ Links ]
OYELERE, P. & KURUPPU, N. 2012. Voluntary internet financial reporting practices of the listed companies in the United Arab Emirates. Journal of Applied Accounting, 13(3):298-315. [ Links ]
PETRAVICK, S. & GILLETT, J.W. 1996. Financial reporting on the world wide web. Management Accounting (USA), 78(5):26-29. [ Links ]
PIRCHEGGER, B. & WAGENHOFER, A. 1999. Financial information on the internet: A survey of the homepages of Austrian companies. The European Accounting Review, 8(2):383-395. [ Links ]
ROBERTS, S. 1999. In Stainbank, L.J. 2000. The status of financial reporting on the internet. Accountancy SA, April 2000:23-25. [ Links ]
SAICA. 2010. The CFO of the future - The effects of the global financial crises, Bruma Lake: South African Institute of Chartered Accountants. [ Links ]
SCHOONRAAD, N. 2003. Managing financial communication: Towards a conceptual model. Unpublished dissertation for M Comm, University of Pretoria. [ Links ]
SENGUPTA, P. 1998. Corporate disclosure and the cost of debt. The Accounting Review, 73(4):459-474. [ Links ]
SOUTH AFRICAN INSTITUTE OF CHARTERED ACCOUNTANTS - see SAICA.
SPENCE, M. 1973. Job market signalling. Quarterly Journal of Economics, 87:355-374. [ Links ]
UYAR, A. 2012. Determinants of corporate reporting on the internet - An analysis of companies listed on the Istanbul Stock Exchange (ISE). Managerial Auditing Journal, 27(1):87-104. [ Links ]
VENTER, J.M.P. 2002. A survey of current online reporting practices in South Africa. Meditari Accountancy Research, 10:209-225. [ Links ]
VERRECCHIA, R.E. 1983. Discretionary disclosure. Journal of Accounting and Economics, 5:179-194. [ Links ]
WEF. 2009. The Africa competitiveness report 2009. Geneva: World Economic Forum. [ Links ]
WEF. 2012. The global competitiveness report. Geneva: World Economic Forum. [ Links ]
WORLD ECONOMIC FORUM - see WEF.
YANJIE, F. & WAN, T. 2013. Website-based investor relations: A comparison between developed and developing economies. Online Information Review, 37(6):946-968. [ Links ]
Accepted: January 2016
1 See Petravick and Gillett (1996), Ashbaugh, Johnstone and Warfield (1999), Craven and Marston (1999), Deller, Stubenrath and Weber (1999), Gowthorpe and Amat (1999), Hedlin (1999), Lymer, Debreceny, Gray and Rahman (1999), Pirchegger and Wagenhofer (1999), FASB (2000), Ettredge, Richardson and Scholz (2001), Geerings, Bollen and Hassink (2003), Marston and Empson (2003), Abdelsalam, Bryant and Street (2007), Kothari, Li and Short (2009), Oyelere and Kuruppu (2012) as well as Yanjie and Wan (2013).
2 Abdelsalam, Bryant and Street (2007:11) reported using the 2003 edition of the Loranger and Nielsen Guidelines for their study of the top UK-listed companies. We could find no other studies that used the Loranger and Nielsen Guidelines.
3 Although the extent of disclosures is not prescribed by the King III Code, the JSE requires that companies must explain if they are not complying with the code. The King III Code requires information to be communicated so that stakeholders can evaluate the risks and rewards inherent in their investment and the way in which the company manages its various resources or capitals and the impact on its stakeholders.
4 Getting to corporate information, Company information, Share details, Share charts, Financial and other reports, HTML & PDF reports, Calendar, Presentations, Contacting IR, General usability and International aspects.
5 Property Income Funds were excluded from the population as they behave more like exchange traded funds (ETFs) than single ordinary equity securities.
6 Audit firm Ernst and Young publish annual studies on JSE-listed top 100 companies' integrated reporting practices. For comparative purposes we only reference their 2012 published studies.
7 The list was initially drawn with the first 112 companies in terms of market capitalisation at 31 December 2011 included. Four companies in the top 100 were excluded due to being pure investment and holding companies or being dual-listed (the South African share is already in the sample). One company delisted by the time that the analyses of websites started. These five companies were substituted by the next five companies in the ranking for purposes of constituting the top 100. This is the same methodology followed by Ernst and Young (2012:13). Companies ranked 106 to 112 therefore remained in the final 205-sample, but were not classified in the top 100 for purposes of the results and discussion in this article. Lastly, comparing the final top 100 companies in terms of market capitalisation at 31 December 2011 (included in the sample of 205) versus the top 100 based on market capitalisation on 1 June 2012 (pure holding companies, dual listed and Property Income Funds excluded) reveals that 97 companies appear in both lists.
8 XBRL allows the creation of reusable, authoritative definitions, called taxonomies, which capture the meaning contained in all of the reporting terms used in a business report, as well as the relationships between all of the terms. XBRl makes reporting more accurate and more efficient as it does not require that users re-enter information. It allows unique tags to be associated with reported facts. See https://www.xbrl.org/the-standard/what/an-introduction-to-xbrl/ for more background. See http://za.xbrl.org/home/join-us/xbrl-sa-working-group-members/v for more information on the South African working group.

