


Services on Demand
Article
 English (pdf)
 Article in xml format
 Article references
Indicators

Related links
-
 Cited by Google
 -
 Similars in Google
Share

 Permalink
South African Journal of Economic and Management Sciences
On-line version ISSN 2222-3436
Print version ISSN 1015-8812
S. Afr. j. econ. manag. sci. vol.19 n.1 Pretoria 2016
http://dx.doi.org/10.17159/2222-3436/2016/v19n1a6
ARTICLES
Bringing Pankaj Ghemawat to Africa: Measuring African economic integration
Adrian SavilleI1; Lyal WhiteII
ICitadel Asset Management and Gordon Institute of Business Science, University of Pretoria
IIGordon Institute of Business Science, University of Pretoria
ABSTRACT
A wealth of literature dealing with trade liberalisation, capital market liberalisation, labour mobility and related issues concerning globalisation asserts that economies that are more integrated with the global economy and, more specifically with their neighbours, tend to enjoy higher sustained levels of growth. Empirical evidence with solid quantitative findings recently conducted by Pankaj Ghemawat has confirmed that more 'open and connected' economies display higher rates of economic growth, higher per capita income levels and greater levels of human welfare.
Against this backdrop, it is notable that the available evidence - whilst incomplete - suggests that African economies are amongst the least integrated in the world. Given that integration and connectedness matter, and that there are material gaps in the evaluation of integration for African economies, it is important to develop better measures of African economies' connectedness with their neighbours and with the world, how this connectedness is evolving and establish more comprehensive and robust means of economic integration compared to those historically available. Using Ghemawat's framework, which measures flows of trade, capital, information and people (TCIP) to determine connectedness, we develop the Visa Africa integration index to provide a more comprehensive and detailed gauge of economic integration for 11 African countries in three clusters: East Africa, West Africa and Southern Africa.
The index results suggest that African economies are emerging off a modest base, with some economies demonstrating progressive structural improvements toward higher levels of integration with their respective regions and the world. East Africa, in particular, shows signs of rising connectedness over the survey period.
The index also illustrates that some countries are more integrated globally than regionally and vice versa, which is important information for policy makers toward improving deeper and broader integration in their respective regions. The index builds on previous research in the broad area of integration and helps us better understand the challenges and opportunities presented by Africa's economic changes and some of the implications for economic growth.
Key words: Africa, integration, structural change, trade liberalisation, sustained development
1 Introduction
Recent evidence suggests that countries with a higher degree of economic integration enjoy faster economic growth and display higher levels of human welfare and economic development (Ghemawat & Altman, 2014). However, whilst Africa has grown faster than any other region since 2000 (Power & Stephan, 2012), the continent remains the poorest performer on most global development indices. To boot, the region is far less connected to the global economy and the world economy's value chains than Asia, Latin America, North America or Europe (Saville & White, 2015). Of the world's different regions, Africa is also the least connected internally. The flow of goods, services, capital, people and information among African economies is exceptionally low compared with intra-regional flows in other parts of the world. Given the evidence regarding the positive role that integration plays in economic development, this low level of connectedness is a binding constraint to Africa's economic advance and limits the region's economic potential.2
In proceeding, it is critical to note that the concept of connectedness, or integration, is multi-faceted and has varied usage, including economic, social and political aspects. This means that the terms "connectedness" and "integration" have many possible connotations. Thus, for the purpose of this paper it is important to establish the intended meaning of the terms. On this score, the focus of this paper is firmly on economic integration and connectedness - from global and regional perspectives - with specific attention to the flow of goods and services, capital, information and people. Other elements of connectedness and integration, including political and social aspects, are without question important to the globalisation debate, yet are beyond the scope of this paper.
Connecting to each other - and with the rest of the world - is an essential prerequisite for African economies to realise their full potential. Specifically, the prospects of Africa's economies hinge critically on their ability to integrate with the world economy, given that the greatest gains from integration relate to local relationships. It is therefore essential that African economies connect with each other - via intra-Africa trade, capital flows, movement of people and the exchange of information and ideas locally and regionally. Such connectivity will serve to bolster and sustain Africa's rising prospects and help countries realise gains in socio-economic welfare.
Against this backdrop, this paper puts forward measures of economic integration across the continent that allows us to study the evolution of economic integration and better understand how integration contributes to Africa's socio-economic prosperity, namely the Visa Africa integration index.
The Visa Africa integration index, outlined below, owes a great debt to the seminal work of Pankaj Ghemawat (2011a; 2011b) with regard to understanding global connectedness, its measurement and its impacts. Elements of Ghemawat's trade, capital, information and people (TCIP) framework and his DHL global connectedness index, that represent his principal contribution to the debate on global connectedness, form key building blocks for the instrument that we develop to specifically measure and analyse economic integration in Africa. The debate on economic integration, referred to above, concerns the tangible flow of goods and services, capital, information and people, which is the focus of this paper, versus the often symbolic integration of markets negotiated by countries at regional and global levels.
While Ghemawat's framework (2011a; 2011b) for measuring economic integration is robust and comprehensive - and for these reasons the framework serves as a key underpin to our work in this area - the Visa Africa integration index is distinct from Ghemawat's work in a number of ways. Specifically, our study establishes new information by filling gaps in measurement for a number of countries in sub-Saharan Africa that were previously unrecorded. For example, Ghemawat's study - as well as other studies on this topic - fails to capture many important economies in the region. Moreover, the data for many sub-Saharan Africa countries covered by his study, in many places are partial, incomplete or missing. Our research goes some way to filling these gaps. In addition, our index affords insights into changes in the nature and patterns of integration in the African context that are not available from Ghemawat's work. As such, our index is not merely a replication of Ghemawat's (2011a; 2011b) initial work for the African context or, for that matter a simple extension of his work to a different economic region.
That said, where the Visa Africa integration results overlap with Ghemawat, they confirm his findings that Africa ranks as the world economy's most disconnected region. However, our findings also show that economic integration on the continent is rising, as is shown in this paper with a granularity that previously was not available. Sections 3 and 4 of this paper elaborate on the uniqueness of our index and the contribution that this work makes to the literature.
2 Outline
The Visa Africa integration index is constructed for a set of 11 countries that are found in three clusters, namely:
i an East African Cluster, which includes Kenya, Rwanda, Tanzania and Uganda;
ii a West African Cluster, which includes Ghana and Nigeria; and
iii a Southern African Cluster, which includes Angola, Mozambique, South Africa, Zambia and Zimbabwe.
Aside from allowing for the construction of a reliable and robust index, the 11 constituent countries are also highly representative of the region, with a combined population of 437 million people, or 55 per cent of the total population of approximately 800 million people at the end of 2014. In addition, the combined gross domestic product (GDP) of the 11 countries that make up the index represents approximately three-quarters of the region's total output over the measurement period.
Based on the 11 constituent countries, Section 3 of the paper explains the construction of the Visa Africa integration index in five parts. The first part describes the selection of a set of specific factors on the back of the so-called TCIP framework, as developed by Ghemawat (2011a). The second part defines and describes the quantitative metrics that are used for measuring each of the aspects of economic integration. In the third part the sample period is commented on, gaps in data availability are identified and ways in which gaps are dealt with are discussed. The fourth part discusses treatment of the "normalisation" of the resulting raw data to allow for diverse metrics to be combined into an index. The fifth part explains the way in which the various components are aggregated and weighted to produce the Visa Africa integration index.
Section 4 of the paper briefly highlights the features of the Visa Africa integration index that distinguish it from earlier research in this area. This is followed by a detailed elaboration of the results, wherein five key findings are discussed. In this section the 11 countries and the three clusters that make up the Visa Africa integration index are reported on in detail. The last section of the paper concludes with some reflections on the index's contribution to our understanding of the nature and extent of economic relationships amongst some of Africa's largest economies with each other and with the world.
3 Constructing the index
3.1 TCIP aspects
Drawing on Ghemawat (2011a:32), we define economic integration as "the depth and breadth of a country's connections with the rest of the world, as manifest by its participation in [cross-border] flows of products and services, capital, information, and people". Measuring economic integration on the basis of this definition has at least three valuable attributes. First, we measure integration on the basis of depth and breadth. In terms of "depth", a country is considered to be "deeply integrated" if the economy is particularly open and highly connected to the rest of the world. However, integration only becomes "deep and broad" if a highly connected economy is engaged with a wide variety of counter parties across the different strands of its global relationships. Measuring economic integration by way of depth and breadth provides for a more comprehensive description and better understanding of the nature and granularity of integration beyond conventional economic measures.
Second, as defined above, economic integration is measured principally on the basis of flows that take place between and among countries. In other words, integration is assessed on the basis of objective observations as opposed to perceptions or other subjective inputs. That said, the Visa Africa integration index that we introduce in this paper allows for the inclusion of some enablers based on the argument that actual integration, by definition, always lags potential integration (Ghemawat, 2011a:32). Beyond this, focusing on actual flows means that the index is based on hard data which, as noted, removes the risk of conjecture and "makes it ideal for dispelling myths about globalisation" (Ghemawat, 2011a:32).
Third, the definition of economic integration adopted here identifies four specific dimensions along which to measure global economic integration, namely the movement of goods and services, or trade (T); financial integration, represented by the movement of capital (C); the movement of information and knowledge (I), such as access to information, ideas and technology; and the movement of people (P). The make-up, influence and impact of each of these elements, including the relevant literature and empirical evidence, are discussed extensively in Ghemawat (2011b) and Saville and White (2013).
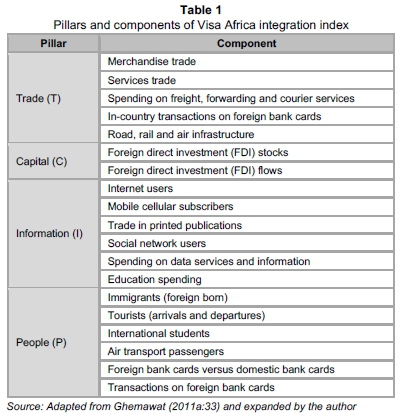
Interrogating the so-called TCIP framework reveals a growing body of evidence that shows that cross-border interactions, economic openness and integration drive economic growth and socioeconomic advancement. Within the four pillars of this TCIP framework, individual types of flows become the building blocks of the Visa Africa integration index. These components, which are described in greater detail below, are selected on the back of Ghemawat's (2011b; 2011a:32-33) seminal research which sets out the different ways in which a country's connectedness contributes to economic advance and human development. Drawing on this work, the components that were included in the construction of the Visa Africa integration index are shown in Table 1.
Considering the factors identified, a number of points merit elaboration. First, based on the method of Ghemawat (2011a), although the index construction includes mainly flow data, there are three notable departures from the use of flow data. The first of these come in the form of installed road, rail and air infrastructure and related logistics capacity. The second departure involves a consideration of the stock of FDI in addition to FDI flow data. The third departure entails measuring the stock of connectivity via information communications technologies that include internet access, mobile cellular telephony and social network footprints. The explanations for these extensions are given below.
In the case of infrastructural capacity, the use of a stock measure is based on the recognition that the extent of economic integration, by definition, must lag the capacity to connect. In part, this presents the risk of the index measuring latent slack in the system rather than actual integration. Concurrently installed infrastructure offers a leading indicator of integration that will be drowned out by other index elements if integration does not follow. Over and above this, measuring the capacity of infrastructure and logistics to facilitate TCIP flows acknowledges "the tremendous importance of logistics performance for economic growth, diversification and poverty reduction [that] has long been widely recognized" (Arvis, Mustra, Ojala, Shepherd & Saslavsky, 2012:iii).
To this end, Arvis et al.'s (2012) logistics performance index illustrates the importance of the ability of a country to facilitate TCIP flows to that country's income. Drawing on a sample of 155 countries, Arvis et al. (2012) show that a one per cent improvement in logistics performance corresponds with a 1.5 per cent increase in per capita income.
In the case of FDI, as noted by Ghemawat (2011a:33) foreign investment stocks, which are the result of investment flows accumulated over time, are an important broader indicator of enduring connections between countries. Foreign-owned investments tend to have ongoing positive effects on host economies via corporate governance, for instance, and, in the case of FDI, through spill-over effects via managerial control. In addition, FDI stocks also help balance out the high year-to-year volatility of investment flows. Similar to FDI stocks, the stock of mobile telephony users, internet users and social network subscribers is arguably a better and more stable measure of connectivity than highly volatile (annual) flow figures.
A further point that merits elaboration is the inclusion in the index of a broad set of country flow data made available by Visa sub-Saharan Africa. As noted by Young (2012:1), for many of the poorest regions of the world the underlying figures supporting existing estimates of economic activity and social welfare are minimal or, in some instances, non-existent. This is particularly the case in Africa. For example, while the most recent Penn World Tables purchasing power parity data set provides real income estimates for 45 sub-Saharan countries, in 24 of those countries it did not have any benchmark study of prices (Young, 2012:2).
In addition to helping us overcome problems of missing data, the proprietary, reliable and regularly-updated Visa sub-Saharan Africa data help us overcome a second weakness in data sets dealing with African economic activity, namely data accuracy. As Jerven (2013) demonstrates, even where numbers are available, figures are often misstated because of capacity constraints, changing economic structures and large "informal" economies that perform differently from the more readily measured "formal" economy.
This means that one of the most urgent challenges in any survey of African economic development is to bolster statistical capacity. As Jerven (2013) illustrates, reliable statistics are basic to the operation of governments in developing countries, vital to non-governmental organisations and invaluable to business. The data embodied in the Visa Africa Integration Index represent a step in this direction.
3.2 Defining metrics
Building on the definition of global integration set out above, the metrics used to determine integration must be able to capture each flow's depth as well as its breadth. Depth refers to the size of a country's international flows compared to a relevant measure of the size of its domestic economy, and as such reflects how important or pervasive interactions with the rest of the world are in the context of business or life in a particular country (Ghemawat, 2011a:34-35).
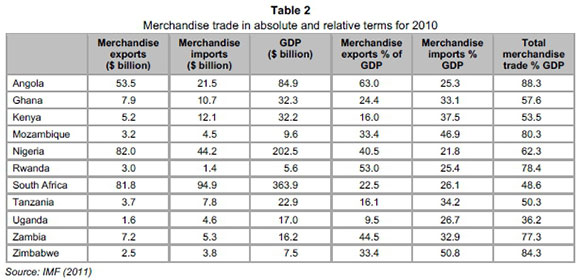
For the merchandise trade component, depth is evaluated by comparing each country's merchandise exports and imports to its GDP, yielding the metrics merchandise exports and imports as per cent of GDP. Thus, in 2010, South Africa's merchandise exports equalled 22.5 per cent of GDP and -imports 26.1 per cent of GDP. Using this metric, Table 2 compares trade depth of the 11 countries, and illustrates the importance of scaling depth metrics. To illustrate this point, in 2010 South Africa exported $81.8 billion of goods, a figure that is more than ten times the size of Ghana's goods exports of $7.9 billion in that year. But in 2010, South Africa's economy measured more than 11 times the size of Ghana's economy. Thus, even though South Africa is a much bigger exporter than Ghana in absolute terms, once we scale for the size of the economy it is apparent that Ghana's economy exports relatively more than the South African economy. A consideration of South Africa and Ghana's merchandise imports reveal similar attributes, which underscores the importance of scaling.
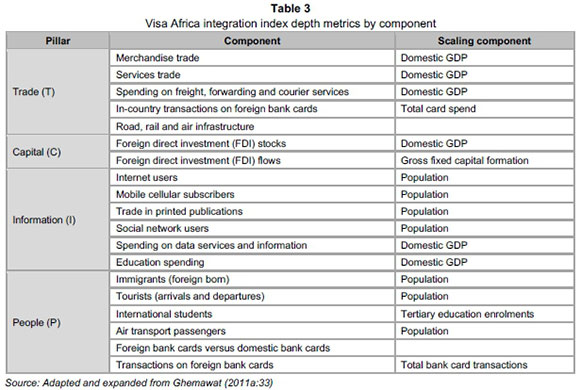
The same principles apply to the other components that make up the index: to implement depth metrics, a relevant measure of a country's domestic economy must be selected as the basis of comparison for each flow. Such measures are identified in Table 3, which also provides additional details about the metrics used for assessing depth. For example, foreign direct investment (FDI) flows are compared with gross fixed capital formation. Ghemawat (2011a:34) notes this measure is a more precise domestic match for FDI flows than GDP, allowing the metric to characterise the percentage of a country's fixed capital investment that takes place within country borders versus that across international borders. Further, all of the scaling components are matched to the period in which observations are made. An exception is FDI flows, which are measured using a three-year moving average, because these flows tend to be especially volatile.
Breadth is conventionally assessed by measuring how closely a country's distribution of international flows across its partner countries matches the global distribution of the same flows in the opposite direction. However, given the nature of the data employed in this study, we instead measure breadth by considering the concentration of each of the flows.
To measure concentration, we use a Herfindahl-Hirschman Index (HHI), which is a widely accepted measure of economic concentration (Herfindahl, 1955; Hirschman, 1964). The HHI is conventionally used to measure industry concentration, where it is calculated by squaring the market share of each firm and then summing the resulting numbers. Formally, the HHI is calculated by the equation:

Where si is the market share of firm i in the market and N is the number of firms. Thus, in a market with two firms that each have 50 per cent market share:
HHI = 0.502 + 0.502 = 0.25 + 0.25 = 0.50
From the formula, it follows that the HHI value can range from UN to one. By extending the input in the calculation from firm share to the share countries have in a given country's export market, the HHI is readily converted from measuring market concentration - to assessing the narrowness or breadth of a country's integration across the four pillars of the TCIP framework. As breadth is desirable - representing a diversified portfolio of TCIP flows - we calculate breadth as 1 - HHI and then scale the result by dividing by 0.01, or:
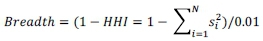
Measured this way, a score approaching 100 indicates great breadth and a highly diversified portfolio of TCIP flows whilst a score approaching zero represents highly concentrated, or narrow, TCIP flows.
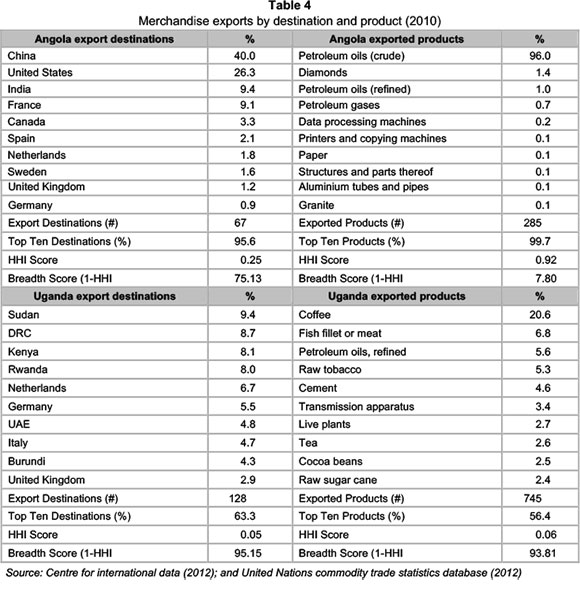
This measure of breadth is easily illustrated by taking the case of merchandise exports which we measure by considering country destination as well as product type. To illustrate this, consider the examples of Angola and Uganda, whose export destinations and export products are shown in Table 4.3 Squaring each country's share of Angola's export market, summing the numbers and then subtracting the total from one, we arrive at a figure of 0.751. This converts to 75.1 when divided by 0.01. From comparative studies, this suggests Angola's merchandise exports are reasonably concentrated in destination, which we then describe as "narrow". Uganda, by comparison, achieves an HHI of 95.2 for export destination, indicative of greater diversification in export destinations and, therefore, greater breadth. Considering product breadth, Angola scores 7.8, which points to a high concentration reflecting the fact that 96.0 per cent of the country's exports are in the single product category "crude petroleum oils". By comparison, Uganda's HHI for exported products is 93.8, which reflects far greater diversification in product exports than Angola.
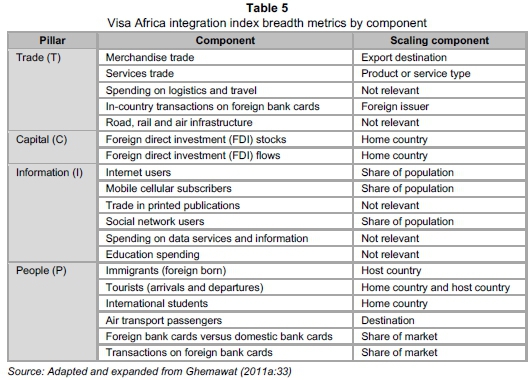
In the same way that we can measure breadth by way of export destination, we can measure the breadth of other aspects of the TCIP flows that make up the Visa Africa integration index. Note, that because the breadth measure has absolute limits of UN and one, there is no need for a scaling factor. However, it is still necessary to identify a unit of measurement as a scaling component; we show this in Table 5.
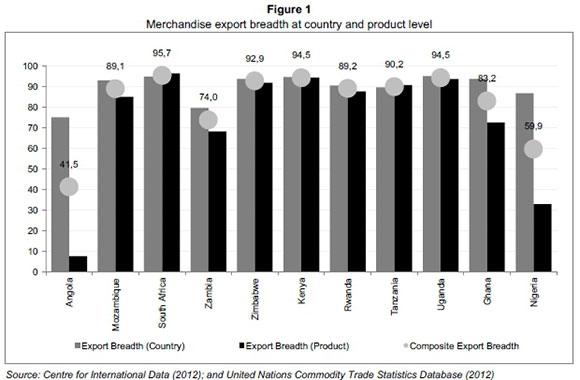
The importance of measuring breadth as well as depth are illustrated in Figures 1 and 2. Figure 1 shows the breadth calculations for our sample of 11 countries at the product and country level. From this, it is evident that whilst most countries' product breadth and country breadth metrics marry up, there are exceptions. Nigeria, Ghana, Angola and Zambia stand out. In each case product breadth is narrower than country breadth, which highlights the capacity - and arguably the need - for the countries to develop product breadth. That aside, by taking a simple average of country breadth and product breadth scores for each country, we produce what we term "composite export breadth". Other factors that make up our index are scored in the same fashion.
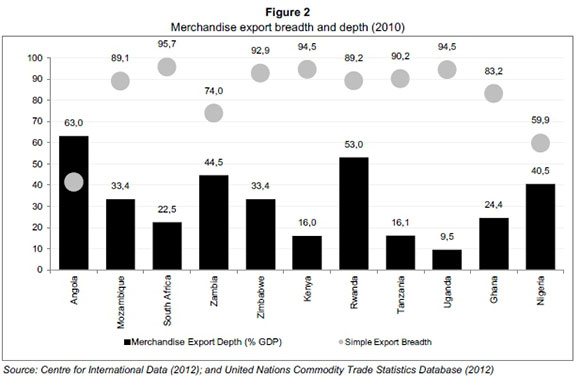
Based on the above results, we can now compare country depth (derived from Table 2), as measured by merchandise exports relative to GDP, to country breadth, as measured by the average of merchandise export breadth (Figure 1). The result is shown in Figure 2, from which it is evident that whilst some countries are reasonably deeply integrated with the rest of the world, this integration is not always broad. By way of example Angola scores the highest on trade depth (63.0 per cent of GDP is represented by merchandise exports), but breadth is the narrowest in the sample (41.5 out of a possible 100 is scored, calculated by taking the simple average of country breadth and product breadth in merchandise exports). By contrast, Uganda scores 94.5 out of 100 in terms of trade breadth, but has very "shallow" trade relations, with merchandise exports representing just 9.5 per cent of GDP.
Drawn together, the above illustrations point the way to measuring global integration by employing objective data in a fashion that captures the complexities and subtleties of this important -and often times emotive - subject.
3.3 Survey period and addressing data gaps
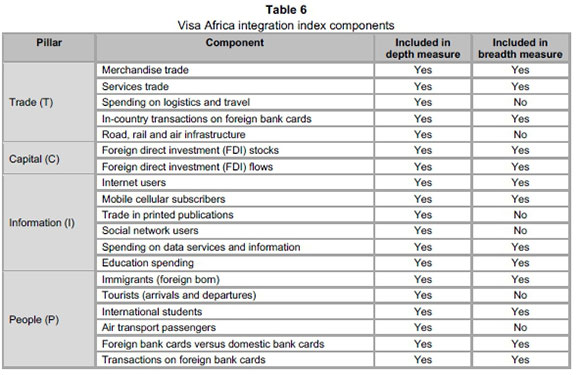
The Visa Africa integration index is constructed initially for the period 2011 and 2012, with the measurement period determined by data availability. Over this period, the index is updated at six monthly intervals across the pillars that make up the depth and breadth measures of the index for all 11 countries. This translates into a substantial data requirement: nearly five million data points have been used to produce the index. Given the substantial data requirement, it is unsurprising that there are cases where the targeted data are unavailable. To ensure universal coverage and continuity in the construction of the index, and following Ghemawat (201 la:37-39), three methods were employed to deal with missing data, namely exclusion of some components from the breadth analysis; the adjustment of weights to account for missing countries for specific components; and the filling of gaps via interpolation and repetition. These aspects are outlined below.
First, while we are able to measure all of the component flows' depth, this is not the case for breadth because for many countries data are only available on the total magnitude of the flows in question, not how they are distributed by origin and destination. Therefore, some components that are included in depth are excluded from breadth, as shown in Table 6.
Second, there are situations where the data required for depth and breadth metrics are available for some but not all of the target countries. In such cases the weights for calculating a country's pillar and index scores are adjusted so that the weight that would normally be applied to a missing component is redistributed proportionally across the remaining available components.4
Third, for depth and breadth, there are cases where the required data for one or more countries are available in some but not all of the years for which the index is to be calculated. When there are gaps in the available data in the middle of a data series - for example data are available for the first half of 2011 and 2012 but not the second half of 2011 - linear interpolation is used to fill the gaps. When data gaps lie before or after all of the available data, repeating the values for the closest available observation fills them. For example, if the latest data available are from 2011 but no data are available for 2012, the 2011 value will be repeated in 2012. Borrowing from Ghemawat (2011a:38), this method was selected instead of linear extrapolation because the trend directions on many international flows are prone to disruption, as evidenced during the Global Financial Crisis or, at a more local level during Mexico's "Tequila Crisis" of 1994, the Asian Crisis of 1997 or the Russian Crisis of 1998. This vulnerability of trends to substantial and sudden direction changes renders linear extrapolation especially prone to large errors and, thus, unsuitable as a method for fixing data gaps. Notably, given the rigour of our data collection, gaps are modest, affecting less than two per cent of observations, thereby giving us a robust and reliable data set from which the Visa Africa integration index is calculated.
3.4 Making metrics comparable
After computing the metrics and filling in the data gaps as described above, the results are made comparable by converting all figures to percentages and then stating the final figure as a percentage of the global average. In this way, a country which has an economy that is "as integrated" as the global economy, has a score of 100. Countries with scores above 100 are leading integrators, whilst countries with scores below 100 are relatively unintegrated. Changes in scores show the direction in which integration is moving relative to a (moving) global average.
Final figures are expressed at percentages of the global average because we believe it is important to contextualize Africa in the global economy. Moreover, by measuring integration against the rest of the world, we get a firm sense of the existing opportunity gap.
In addition, where relevant, data are normalised by adjusting for purchasing power. This is an important iteration because spending $1 on data in Nigeria in 2010, for instance, buys about one megabyte of data, whereas the same $1 spent in South Africa buys four times as much data (Opera Software, 2012).
3.5 Aggregation and weights
The overall Visa Africa integration index is built up from its constituent components via four steps, which develops the approach employed by Ghemawat (2011a:40-41). The method is shown in Figure 3.
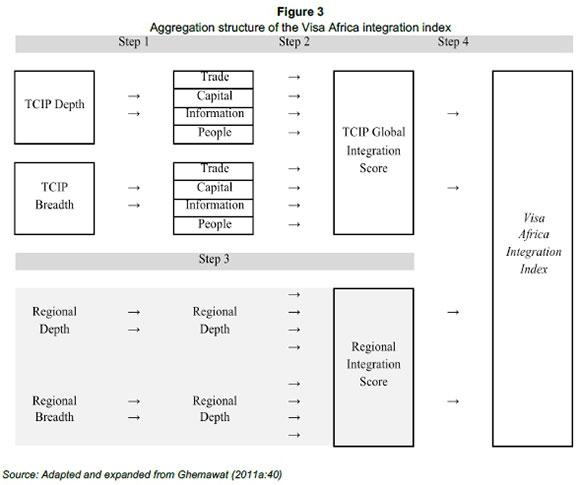
First, the individual components are aggregated into the four TCIP pillars, as shown in Table 7. The individual components are assigned weights inside of each of the pillars along the dimensions of depth and breadth. This allows for the estimation of overall depth and breadth scores for the four pillars of trade, capital, information and people. Table 7 shows the different weights that are assigned to individual components to measure the global TCIP score. The assignment of weights is explained below.
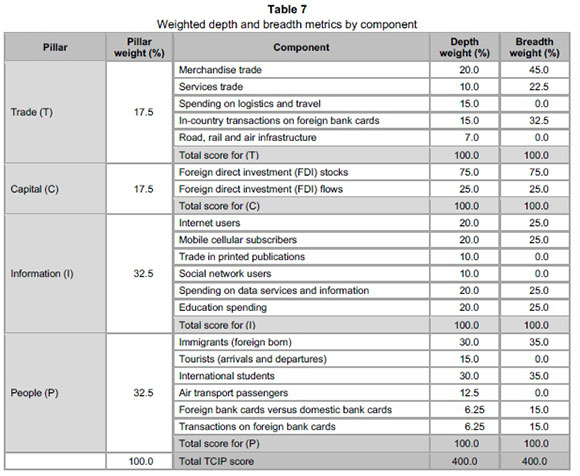
Adapting Ghemawat's (2011a) approach, in the case of measuring depth in the trade pillar, the weight assigned to merchandise trade is two times the weight assigned to services trade. This is because over the past decade, merchandise trade has on average been four times larger than services trade. In the 11 countries that we survey, 2012 merchandise trade was three times larger than services trade. However, because the long-term growth rate of services trade is higher than merchandise trade, we make a subjective assessment to assign two times higher weight to merchandise trade versus services trade. Spending on freight, forwarding and courier services, as the term implies, is assigned a services weight. In this fashion, we assign a services weight to in-country transactions on payments for goods and services made using foreign cards. Road, rail and air infrastructure is assigned a balancing weight, given its association with physical trade and services trade.
In the capital pillar, FDI is the only element considered in terms of economic integration. This is because FDI tends to last significantly longer than other forms of international capital flows. Further, by its real economic engagements, FDI has visibly greater economic and social effects than, for instance, foreign portfolio investment (FPI) (Lin, 2012). Thus, as with trade, a subjective decision is made to assign all weight to FDI at the expense of other forms of international capital flows. Within FDI, however, a significantly higher weight is assigned to stocks over flows given the cumulative nature of stocks. That said, stocks and flows each measure distinct and important aspects of integration. Flows indicate a country's current participation in cross-border investment activity and stocks indicate the influence of an external shareholder on the country's economy via technology diffusion, capital accumulation, skills transfer and so on.
Among the information components, internet usage, mobile connectedness, spending on data and spending on education are assigned double the weights given to trade in books and other printed publications and social network users. Following Ghemawat (2011a), this reflects the imperfection of some of the indicators: publications are often printed in multiple locations rather than traded across borders in physical form; and these weights also reflect the trend toward more information flows taking place in digital form rather than via physical trade in printed publications. Social network use is given a relatively lower weight as, whilst this is an integrator, it remains in its infancy.
Within the people pillar, equal weights are assigned to migration and student mobility. Each of these components reflects a distinct aspect of integration and spawn effects that span the other TCIP components. For example, students serve as conduits of information and migrants tend to promote trade. Following Ghemawat (2011a), without a logical basis for assigning different weights, they are treated as having equal importance. Air transport passengers and international flights are given material - but lower - weights. The number of foreign bank cards and transactions on foreign bank cards - which capture the number of people moving across borders and the extent of their economic activities - are given the balancing weight. This balancing weight is split equally across the two components.
In each pillar, weights add to 100 index points, giving a maximum possible score of 400 index points for breadth and depth across the four TCIP pillars. The next step in the compilation of the index is the four pillars are assigned weights to allow for the computation of an aggregate depth and breadth score for each country. Ghemawat (2011a:41) assigns the trade and capital pillars weights of 35 per cent each versus the information and people pillars which are assigned weights of 15 per cent each. Our research, however, suggests that of the four components, the integration of people and information have a materially higher influence on economic connectedness than trade and capital flows. This is at odds with conventional wisdom, and may be due to the overarching "invisible yet powerful" influence of people, information and knowledge. This observation is supported by the findings of Saville (2013) which shows that the flows of information (I) and people (P) Granger-cause trade (T) and capital (C) flows.
Against this backdrop, a weight of 32.5 per cent is assigned to the people and information pillars, whilst a weight of 17.5 per cent is assigned to the trade and capital pillars. These scores are then aggregated to yield a TCIP Global Integration Score. To this, we add a TCIP Regional Integration Score that is built along the same lines, including depth and breadth elements across each of the four pillars but scored using only regional flows, by which we mean flows between sub-Saharan African economies. The construction of a separate regional element elevates the role that regional integration plays in facilitating economic advance. This separate element also allows for unique observation of Africa's connectedness, an aspect of economic development that historically suffers from feeble data and poor measurement.
Thus, the final step in the computation of the index involves combining the depth and breadth measures for the global and regional scores in equal weights, and then combining the global and regional scores in equal weights to produce the Visa Africa integration index. The final score is measured out of 100, with 100 points reflecting the global average.
In addition to calculating levels of global integration of the 11 countries surveyed in this report, by aggregating the factors that make up the index by geography into a Southern African, West African and East African cluster, we are in a position to measure the extent to which integration occurs in each of the major economic clusters. Thus, over and above helping improve our understanding of Africa's economic relationships and the role that global integration plays in the region's socio-economic advance, by emphasising regional integration the Visa Africa integration index provides a novel contribution to our understanding of African economies' relationships with the world and with neighbours.
4 Unique features of the Visa Africa integration index
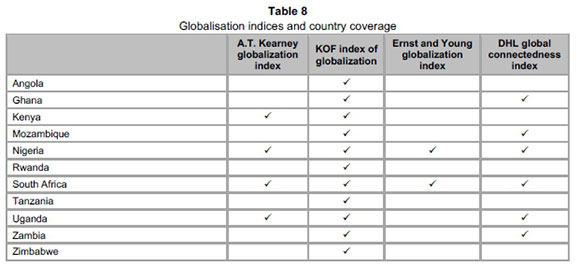
The Visa Africa integration index is not the first effort to assess the economic integration of countries. As noted by Ghemawat (2011a:42), of the earliest handlings of this topic to receive widespread attention was the A.T. Kearney/ Foreign policy magazine globalization index (2007). This index is encompassing and includes multiple aspects of globalization (Niklas, 2015). However, the index has not been updated since its 2007 edition. Zurich ETH University's KOF Index of Globalization receives significant attention and is regularly updated; the most recent update being the 2015 edition of the index. Whilst the index provides valuable insights into the economic, social and political dimensions of globalization (Dreher, Gastron & Martens, 2008), assessment is based only on depth and excludes the important dimension of breadth. Further, the statistical methods that are used, especially principal component analysis, is prone to produce measures that are compromised in terms of their relevance to users. The Ernst & Young (2012) globalization index, generated in cooperation with the Economist Intelligence Unit (EIU) has recently been updated. Further, the DHL global connectedness index, highlighted throughout this report, represents a major contribution to the literature and our understanding of the subject of global integration. However, whilst offering rich insights into connectedness, economic integration and globalisation, each of these reports excludes many of the countries included in the Visa Africa integration index. The extent of coverage is summarised in Table 8.
Notwithstanding the valuable contributions made by these reports to the measurement of global integration and our understanding of the role that economic integration and economic assimilation play in socio-economic development, the Visa Africa integration index benefits from new or unique features that distinguish the index from prior research in this area. First, by employing reported flow data the index provides an unbiased measure of integration that yields a clearer picture of economic integration than comparable indices. Second, by virtue of access to unique and accurate data, the index represents a reliable and regularly updated measure of economic integration. Third, the use of proprietary data means that the gap between actual flows, the reporting of data and updating of the index is much smaller than is normally the case. This translates into an index that does not display the substantial construction latency suffered by other indices. Fourth, the capacity to disaggregate the index into the sub-components of TCIP global integration score and regional integration score affords unique insights into the nature and evolution of economic integration amongst 11 of Africa's biggest economies. Finally, the index extends coverage to include economies of whom information on economic connectedness and integration has been limited. No other index offers these features. The results of the construction of the Visa Africa integration index and some key economic implications are set out in the next section.
5 Results
The final output of the Visa Africa integration index, reported for the four survey periods, namely biannually for 2011 and 2012, is captured in Figure 4. Whilst substantial information is carried in each data point, in the final analysis five key attributes stand out.
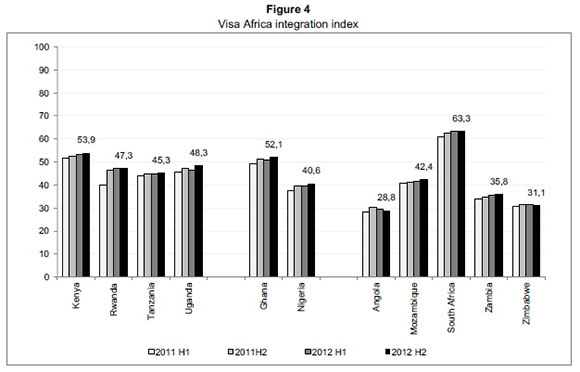
First, whilst improving off a modest base, the countries that make up the index have undergone positive structural transformation over the past decade (Saville & White, 2015). The index offers recent and robust evidence of this: all 11 countries show improvements in economic integration over the period measured.
In some cases the improvements are modest. Zimbabwe and Angola record gains in integration that amount to less than one per cent over the period. In other cases the gains are swift and substantial. Rwanda's index score rises by almost 20 per cent over the two years. Ghana, Nigeria and Zambia all record a robust single digit improvement in economic integration.
Second, given the rapidly improving economic environment and composition, the socioeconomic gains that accompany rising integration will translate into rising investment opportunities and prospects for new business relationships in the 11 countries covered. Notwithstanding these improvements, the results of the Visa Africa integration index show no African country in the index scores above the global median of 100 at either the global or regional level. At the end of 2012, South Africa scores highest amongst the 11 countries for global integration, as shown in Figure 5. Ghana scores highest for regional integration, as shown in Figure 6. Nonetheless, South Africa and Ghana are a long way off the global median recorded for global and regional integration, respectively. Note that the scores in this analysis are rebased to 100 to allow for ease of comparison; in the index each form of integration is weighted at 25 per cent.
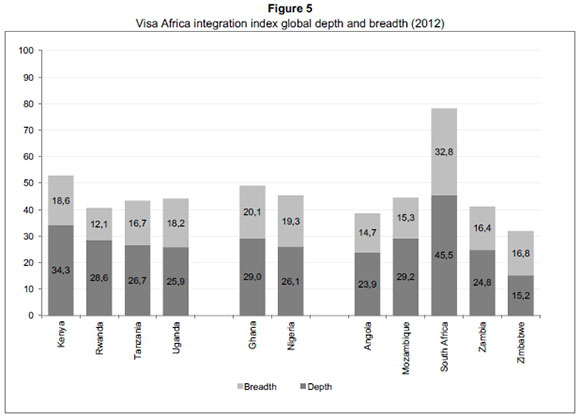
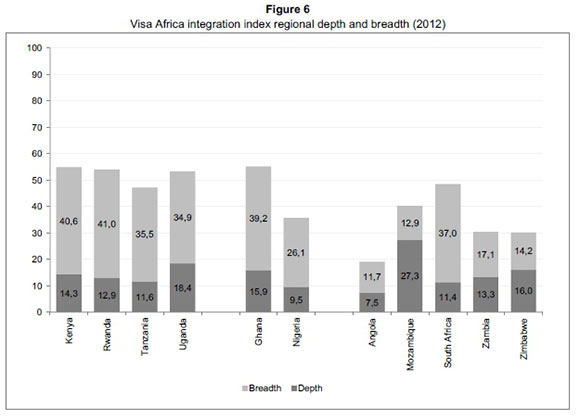
The same observation holds for the underlying depth and breadth pillars that make up the index. Whilst South Africa scores highest for global depth (Figure 5) and global breadth (Figure 5) at the end of 2012; Mozambique scores highest for regional depth (Figure 6); and Rwanda has the highest score for regional breadth (Figure 6). Notably, none of these scores achieves the global median. The net result is that whilst Africa's economic integration appears to be rising, the general case is that this improvement is off a low base and still has some way to go to achieve the global median recorded for economic integration. Again, note that the scores in this analysis are rebased to 100 to allow for ease of comparison; in the index each form of integration is weighted at 25 per cent.
Third, whilst the survey period is admittedly short, the drivers of integration have some common elements. For example, over the survey period regional integration is a consistently more important contributor toward economic progress and social development than global integration. However, the pillars - in the form of contributions made by the TCIP elements - vary. In the West African cluster the most important driver is people. While in East Africa it is information and in Southern Africa it is trade and information that make the greatest contributions to rising integration. These variances in the TCIP pillars make for interesting analysis. More notable, though, is that it is regional- rather than global integration - that carries the greater weight in the integration index for most countries, as shown in Figure 7.
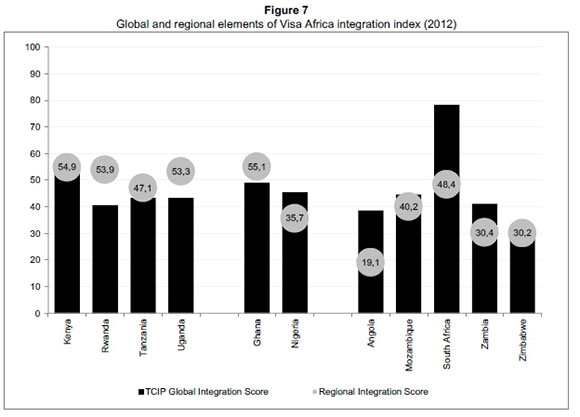
Fourth, there are relevant disconnects in some countries that do not follow the anticipated trend results. As a rule, the countries tend to have similar degrees of regional and global integration. However, some notable anomalies arise, in particular the cases of Angola and South Africa, where wide divides exist between global and regional integration, as shown in Figure 7. Note that the scores in this table are rebased to 100 to allow for ease of comparison; in the index each form of integration is weighted at 50 per cent. That aside, this evidence speaks of the nature, health and consistency of economic integration.
The fifth aspect that stands out is that Africa - and more specifically according to these results sub-Saharan Africa - is not "one country" or "a place". The region is not one amorphous aggregate, distinguished from the rest of the world as "being different". Rather, the findings reinforce the point that each of the 11 countries that makes up the index, and its three regions, have unique and discernible attributes that influence and inform the way in which they integrate with the world economy and with whom they connect.
To be sure, each of the 11 countries - and each of the three regions - is made up of unique elements with their own economic, geographic, institutional and structural forces are at work. These are informed by their histories, a diversity of resources and contrasting possibilities. These variances and unique attributes are captured in Figure 8, which shows integration by depth and breadth at the regional and global levels.
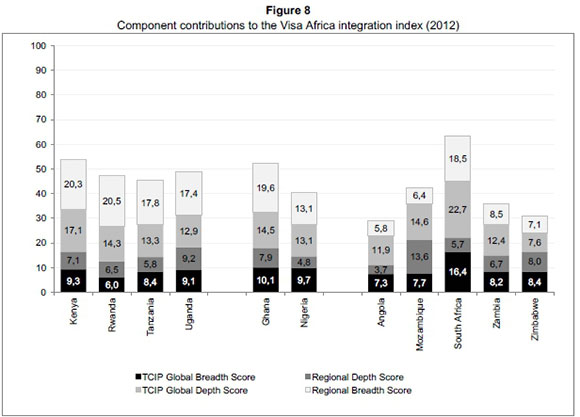
Thus, whilst economic integration is a driver of socio-economic advance, the influence and impact it has differs from region to region and country to country, which evolves with regional and global integration. This speaks to the value of the Visa Africa integration index, emphasising the fact that it is simply not possible to approach Africa with a "one size fits all" mind set. The work done in compiling the index reveals that each region and every country that makes up the index presents its own opportunities and challenges, with idiosyncrasies and rewards, and each needs to be assessed in its own right.
Whilst in the past fifteen years the surge in demand for natural resources may have kick-started the process of rapid economic growth that has come about for the countries that comprise the Visa Africa integration index, the available evidence and arguments identify structural change as an increasingly powerful driver of sustained socio-economic advance in Africa. Indeed, with the collapse in commodity prices observed over the course of 2013 and 2014, it is evident that structural forces and not commodity prices will have to serve as the basis for economic growth and development.
The arguments underpinning the index and the analysis that follows from its construction show that the countries in the Visa Africa integration index are embracing modernity and necessary structural change, even if much still needs to be done. The strengthening of institutions, through the role of the state, improved legislation, macroeconomic policies, fiscal management and the entrenchment of individual rights are just some of the factors that have helped move these 11 economies into a positive direction, while achieving greater integration with each other and with the world. This has become a driver of socio-economic advance.
6 Conclusion
The TCIP framework developed by Pankaj Ghemawat, which describes the nature and influence of key economic connections - international trade (T), cross-border capital movements (C), information and knowledge flows (I) and the movement of people (P) - identifies economic integration as a key driver of material improvements in a country's economic and social welfare. Yet, in the case of African economies this element of economic integration has largely been ignored.
By virtue of having access to proprietary data, that represents more than five million observations across each of the elements identified above, the Visa Africa integration index is able to address this lacuna, and serve as a reliable and robust measure of economic integration for 11 of Africa's largest and fastest growing economies. Drawing on the key building blocks laid by Ghemawat, the Visa Africa integration index makes a new - and hopefully useful and important -contribution to our understanding of the nature and extent of economic relationships amongst some of Africa's largest economies. Amongst other things, by developing the index we achieve a sophisticated measure of economic integration that incorporates the four pillars of economic connectedness, namely trade, capital, information and people (TCIP) flows. In addition to measuring these pillars at the country level, the granularity of the data to which we have access allows us the ability to measure economic integration at global and regional levels, and also to measure the depth and breadth of these relationships.
Whilst the results provide for a number of new and detailed insights into the nature of economic integration amongst Africa's biggest economies, there are five key findings that stand out. First, whilst improving off a modest base, the countries that make up the index display rising integration over the survey period. Whilst this is admittedly a short period, the evidence is encouraging. Second, given the rapidly improving economic environment and composition, the socio-economic gains that come with rising integration will translate into rising investment opportunities and prospects for new business relationships in the 11 countries covered. Third, for the set of 11 countries, regional integration demonstrates itself to be the greater component of integration. This is an important outcome given that regional integration is a consistently more important contributor toward economic progress and social development than global integration alone. Fourth, there are some notable disconnects in the case of some countries that do not follow the anticipated trend results. This allows for useful insights into country dynamics, economic challenges and prospects. Fifth, Africa and more specifically, according to the results of this study, sub-Saharan Africa is not "a country" or "a place". The region is not one amorphous aggregate. Rather, the findings reinforce the point that each of the 11 countries that make up the index, and their three regions that we measure, represent a rich tapestry of economies that have unique and discernible attributes that influence and inform the way in which they integrate with the world economy and with whom they connect.
Regardless of how we approach the results produced by the Visa Africa integration index, our findings are unambiguous in at least two regards. First, whilst coming off a modest base, the economies that we measure are rising in terms of the degree and sophistication of economic integration. Second, although the economies have some way to go in terms of catch up, by the evidence produced by the Visa Africa integration index they are evidently getting into the business of catching up.
References
ARVIS, J-F., MUSTRA, M.A., OJALA, L., SHEPHERD, B. & SASLAVSKY, D. 2012. Connecting to compete 2012: Trade logistics in the global economy. World Bank: Washington. [ Links ]
A.T. KEARNEY & FOREIGN POLICY MAGAZINE. 2007. The globalization index 2007. Foreign Policy Magazine. Available at: http://foreignpolicy.com/2009/10/12/theglobalization-index-2007/ [accessed July 2014]. [ Links ]
DREHER, A., GASTON, N. & MARTENS, P. 2008. Measuring globalisation: Gauging its consequences. New York: Springer. [ Links ]
ERNST & YOUNG. 2012. Looking beyond the obvious: Globalization and new opportunities for growth. Ernst & Young. Available at: http://www.ey.com/GL/en/Issues/Driving-growth/Globalization-Looking-beyond-the-obvious---2012-Index [accessed July 2014]. [ Links ]
GHEMAWAT, P.& ALTMAN, S.2014. DHL global connectedness index 2014: Analyzing global flows and their power to increase prosperity. Bonn: Deutschepost DHL: Bonn, Germany. [ Links ]
GHEMAWAT, P.&ALTMAN, S. 2011a. DHL global connectedness index 2011: Analyzing global flows and their power to increase prosperity. Deutschepost DHL: Bonn, Germany. [ Links ]
GHEMAWAT, P. 2011b. World 3.0: Global prosperity and how to achieve it. Harvard Business Press: Boston, Massachusetts. [ Links ]
HERFINDAHL, O.C. 1955. Comment on Rosenbluth's measures of concentration. In Stigler, G. (ed.) Business concentration and price policy. Princeton University Press: Princeton. [ Links ]
HIRSCHMAN, A.O. 1964. The paternity of an index, American Economic Review, 54:761-762. [ Links ]
INTERNATIONAL MONETARY FUND STATISTICS DEPARTMENT .2011. Direction of trade statistics yearbook, 2011. International Monetary Fund: Washington. [ Links ]
JERVEN, M. 2013. Poor numbers: How we are misled by African development statistics and what to do about it. Cornell University Press: London. [ Links ]
LIN, J.Y. 2012. The quest for prosperity: How developing economies can take off. Princeton University Press: Princeton. [ Links ]
MINNEY, T. 2012. Waiting in the wings, African Investor, 10(6):23-25. [ Links ]
NIKLAS. P. 2015. The evidence on globalisation. The World Economy, 38 (3):509-552. [ Links ]
OPERA. 2012. State of the mobile web. Available at: http://business.opera.com/smw/2010/02/ [accessed July 2014].
POWER, M. & STEPHAN, H. 2012. The scramble for Africa in the 21st century. Cape Town: Renaissance Press. [ Links ]
SAVILLE, A.D. 2013. Country and company competitiveness: The role of mobility in economic performance. Unpublished Working Paper: Citrix. [ Links ]
SAVILLE, A. & WHITE, L. 2013. Realising potential: Connecting Africa. Working paper. Available at: http://www.adriansaville.com/sites/default/files/Visa%20Africa%20Integration%20Index%20-%20Adrian%20Saville%20and%20Lyal%20White%20-%20Long%20Pap....pdf [accessed July 2014] [ Links ]
SAVILLE, A.& WHITE, L. 2015. Ensuring that Africa keeps rising: The economic integration imperative. South African Journal of International Affairs, 22(1): 1-21. [ Links ]
UNITED NATIONS. 2012. UN commodity trade statistics database. Available at: http://comtrade.un.org/db [accessed July 2014].
UNIVERSITY OF CALIFORNIA. 2012. Centre for international data. Available at: http://cid.econ.ucdavis.edu [accessed July 2014].
YOUNG, A. 2012. The African growth miracle. NBER Working Paper, No. W18490, October 2012. [ Links ]
Accepted: September 2015
1 Adrian Saville is Chief Strategist at Citadel Asset Management and Professor in Economics and Finance at the Gordon Institute of Business Science, University of Pretoria. Lyal White is Associate Professor and Director of the Centre for Dynamic Markets at the Gordon Institute of Business Science, University of Pretoria. The authors would like to thank two anonymous reviewers and the editor for their helpful and constructive comments that greatly contributed to improving this paper.
2 The terms "connectedness" and "integration" are used interchangeably throughout the paper. There is no intended difference in meaning or connotation, rather the terms are used interchangeably for the sake of the reader given the frequency with which these terms are used in the paper.
3 For expedience we truncate the list at ten observations as the tails are long. In the case of Angola, the country exported 285 products (using HS4 classification) to 68 other countries in 2010, but the top ten countries made up more than 90 per cent of export destinations and the top 10 products accounted for more than 99 per cent of exports. In the case of Uganda, the country exported 745 products to 128 destinations in 2010, the top ten countries made up 60 per cent of export destinations and the top ten products explained more than half of all exports. Thus, whilst we use the full population to calculate export destinations, for the sake of convenience we illustrate trade patterns by way of truncated lists.
4 For example, see Minney (2012, 23) where for instance it is noted, "there is no official data that captures all sub-Saharan Africa's capital flow". As the index is an ongoing construction, once missing data become available the inferred data used for missing entries are replaced by actual data.

