


Serviços Personalizados
Artigo
 Inglês (pdf)
 Artigo em XML
 Referências do artigo
Indicadores

Links relacionados
-
 Citado por Google
 -
 Similares em Google
Compartilhar

 Permalink
South African Journal of Economic and Management Sciences
versão On-line ISSN 2222-3436
versão impressa ISSN 1015-8812
S. Afr. j. econ. manag. sci. vol.19 no.1 Pretoria 2016
http://dx.doi.org/10.17159/2222-3436/2016/v19n1a4
ARTICLES
Market concentration trends in South Africa's private healthcare sector
Marine Erasmus; Nicola Theron
Department of Economics, University of Stellenbosch; Econex
ABSTRACT
The Competition Commission (CC) commenced with an enquiry into South Africa's private healthcare sector at the beginning of 2014, the outcome of which could have far-reaching consequences for the medical industry in South Africa. The panel appointed to consider competition in the private healthcare sector has indicated that they are interested in understanding increased consolidation in the private hospital market and the effect this may have on competitive dynamics. This article considers historical concentration trends in the private hospital market from 2000 to 2012. In addition it also deals with changes in market structure in the medical scheme and administrator markets. These trends, in addition, provide a complete picture of market structure changes and the implications for relative bargaining power of the various parties. It finds that whereas the market concentration of private hospitals has remained relatively stable since 2004, the market concentration of medical schemes and administrators has increased over this period.
Key words: private hospital markets, SA healthcare enquiry, Competition Commission, concentration indices, private hospital mergers
1 Introduction
The 2014/15 market enquiry by the South African Competition Commission (CC) into the private healthcare sector sparked renewed interest in the level of concentration in this sector. This is important as there is an assumed link in the competition literature between market structure and market power (the ability to increase prices). Against this background, this article aims to provide a factual review of historic market concentration trends for private hospitals, medical schemes and medical scheme administrators in South Africa, in order to gain a deeper understanding of relative bargaining positions. This article contributes to the literature by addressing the current dearth of properly-documented concentration trends in the South African private healthcare sector.
We first discuss the background and context to better understand the market concentration debate in South Africa's private health sector, after which we discuss the methods commonly used to measure market concentration, with specific focus on the Herfindahl-Hirschman Index (HHI). This is followed by an exploration of the international literature regarding the measurement of market concentration for hospitals and health insurers (medical schemes in the South African context). Finally, we present the results from our South African analysis and elaborate upon the contribution of our findings to the literature.
2 Background
An important structural change occurred in the South African private health sector when a ruling by the Competition Tribunal in 2004 prohibited collective bargaining between various players. More specifically, this ruling prohibited the Hospital Association of South Africa (HASA), the Board of Healthcare Funders (BHF) and the South African Medical Association (SAMA) from negotiating prices collectively on behalf of their respective members. While the prices thus determined were recommended prices, the Tribunal nevertheless found that this was an instance of price fixing, constituting a contravention of section 4(1)(b)(i) of the Competition Act.
In this analysis, accordingly, all private hospital groups that negotiated collectively as HASA members prior to 2004 were grouped together when calculating the concentration level of the market at that time. After the prohibition of collective bargaining in 2004, the concentration level of the private hospitals was calculated considering each hospital group as a separate negotiating entity. The results of the latter calculations indicated a significant decrease in concentration in the private hospital market from 2003 to 2004, while after 2004 the concentration of the industry remained fairly constant.
This might be a counter-intuitive result given that there were a number of mergers and acquisitions approved by the CC between 2004 and 2012.1 The fact that concentration did not increase much during this period is however due to the increased capacity of beds across all groups - most notably those of the National Hospital Network (NHN), a grouping of independently-owned private hospital facilities. A number of new independent hospitals (not part of the NHN or other listed hospital groups) were also built, while existing independent groups (e.g. Anglogold, Clinix) also expanded their hospital footprint.
While there has been no significant increase in concentration in the private hospital market over the last few years, the medical scheme and administrator markets show steady increases in market concentration from 2004 to 2012. The HHI concentration measure (which we discuss in more detail below and in Appendix B) indicates that the open medical schemes market was more concentrated than that of private hospitals in 2012. This is due to consolidation amongst medical schemes and significant membership growth for a few large schemes.
3 Measuring market concentration
Before considering the results of the analyses, we provide a brief technical framework regarding market concentration in order to understand the context and aid interpretation of results. Market concentration is an important consideration in competition economics and there are several methods that may be used in calculating market concentration levels. The two most common methods are N-firm concentration ratios (CR-N) and HHI. The CR-N measure reflects the total market share of the N largest firms in a specific market, whereas the HHI gives greater weight to larger firms by squaring the market shares of all firms in the market (not just the N largest firms) (Austin & Hungerford, 2009). This makes the HHI the preferred concentration measure in standard merger analysis. Consequently, HHI has found support in the United States' (US) (U.S. Department of Justice and Federal Trade Commission, 2010) and the European Union's (EU) (European Union, 2004) competition guidelines and academic literature as the most appropriate measure of market concentration.
However, different jurisdictions may use and interpret the HHI differently. Specifically, with HHI results that we present below (the formula of which is given in Appendix B), different thresholds are used to indicate concentrated markets. In the EU, for example, a market where the HHI is above 2 000 would indicate possible horizontal competition concerns (European Union, 2004). On the other hand, the US Merger Guidelines state that HHI levels between 1 500 and 2 500 are indicative of moderately concentrated markets, while an HHI above 2 500 indicates a highly concentrated market (U.S. Department of Justice and Federal Trade Commission, 2010). No specific thresholds or levels have been set in South Africa; hence the European and American thresholds provide at least a reference. Importantly though, these thresholds are arbitrary and many other factors also affect market dynamics and market power (the relationship between market concentration and market power is discussed in more detail later in this article).
4 Literature on measuring healthcare market concentration
As a precursor to the South African analysis, we consider South African and international literature regarding the measurement of market concentration for hospitals and healthcare insurers.
4.1 South Africa
As stated in the introduction, this article aims to address the current gap in the academic literature discussing market concentration trends in the private health sector in SA. It is often stated that concentration levels increased in the private hospital market as a result of various hospital mergers that have been approved during the past decade and a half.2 However, no empirical evidence of this perceived increase in concentration has been published to date.
4.2 United States of America
In the US, there has been significant consolidation in both hospital and health insurer markets. It is standard practice to use the HHI in order to determine market concentration in the health sector in the US. This was also the indicator used for analysing the historical trend in hospital market concentration in a 2012 OECD report (2012:347), dealing with competition in hospital service. More recent data from the 2014 American Medical Association (AMA) annual report present market shares and use the HHI to better gauge the concentration of health insurers of 388 metropolitan statistical areas (MSAs)3 and 50 US states. This report finds that 72 per cent of the 388 MSAs are classified as highly concentrated (defined as having a HHI greater than 2 500) (American Medical Association, 2014).
In Moriya, Vogt and Gaynor (2010) the research question is different from what we consider here, but the authors also use the HHI to calculate hospital and health insurer market concentration, as was the case in Vogt & Town (2006). Both sets of authors use enrolment and market share information from various industry reports to determine health insurer concentration levels. The authors use the number of staffed hospital beds to calculate the relevant hospital market shares and associated HHI indices. The analysis below follows the same methodology.
4.3 Other countries
According to the OECD (2012), the hospital consolidation trend found in the US is also prevalent in Germany, the Netherlands and the UK. In fact, in Germany, the increased number of mergers and acquisitions has initiated a debate regarding the recalculation of the merger threshold (OECD, 2012). In these and other jurisdictions the HHI is used most often to calculate market concentration in the healthcare sector. A few examples include Schmid and Ulrich (2013) who also use the HHI to calculate concentration trends over time for the hospital sector in Germany. In Gaynor Morena-Serra and Propper (2010), where the authors consider the effect of a pro-competitive policy on the quality of health services provided at different hospitals in the United Kingdom's National Health Service, they use the HHI to measure concentration/ market structure. Also, when examining the relationship between hospital competition and quality of care, Chen & Cheng (2010) use the HHI to measure competition between hospitals providing services in the National Health Insurance system of Taiwan.
Considering the widespread use of the HHI to measure concentration in the health sector, its use is deemed appropriate for the current research.
5 Trends in South African healthcare market concentration
Concentration indices for each of the three markets in question (private hospitals, medical schemes and medical scheme administrators) are presented below. For private hospitals, we use the number of registered beds for each hospital in all of the years to calculate market shares. We had sufficient data on the number of hospital beds and other relevant information to consider the trend in concentration from 2000 to 2012, showing the impact of the 2004 Tribunal decision specifically. This comprehensive dataset for private hospitals provides valuable insights over the observed period. Instead of the number of beds, patient days sold or a revenue variable could have been used. However, these indicators are not publicly available for the NHN members or the other independently owned hospitals. It is also industry convention to use bed numbers for market concentration calculations (this indicator was used in the private hospital merger cases considered by the CC).
The analysis focuses on the period post-2004. Medical schemes and administrator markets are analysed from that time onwards, as prior to this, the medical scheme market would have had an HHI of 10 000 as all medical schemes negotiated collectively under BHF (see Appendix Β for a description of the HHI formula and ranges).4
5.1 Private hospitals
A complete dataset of individual hospitals with their respective number of registered beds for each of the years from 2000 to 2012 was constructed by using various datasets from the Health Annals publications, HASA and the NHN, a complete dataset of individual hospitals with their respective number of registered beds for each of the years from 2000 to 2012 was constructed. This information was supplemented by contacting some hospitals to verify the data on bed numbers, dates of acquisition, membership of HASA and/or the NHN, and other factors.
The data were further organised into the applicable tariff-negotiating arrangements in each year. Prior to 2004 Netcare, Mediclinic, Life Healthcare and all NHN hospitals were grouped as one entity (due to the collective bargaining that took place as members of HASA), whereas the independent hospitals were treated as individual entities. After the Tribunal ruling which banned collective bargaining, each hospital group that was previously included under HASA, was treated as a separate entity. Individual hospitals were treated in the same way as before, i.e. as separate entities.
Figure 1 Figure 1 provides a high-level view of the underlying data that were used for calculating the concentration measures. Total hospital beds increased from 24 402 in 2000 to 34 600 in 2012. Netcare had the largest number of beds in 2012 with 9 143 registered beds across all their hospitals. The NHN experienced the highest growth over the period: growing from 2 678 beds in 2000 to 7 198 beds in 2012 - more beds than all the Mediclinic hospitals in that year (7 005).
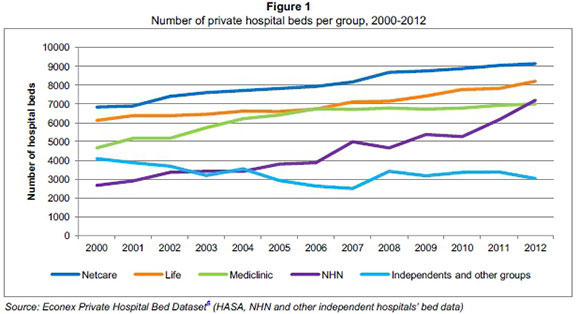
In Figure 1 "independents and other groups" refer to those hospitals which are not part of the NHN or the three listed hospital groups.
Despite the increase in bed numbers over the past decade, the ratio of private hospital beds per 1 000 medical scheme beneficiaries has remained fairly constant, indicating that the growth in the number of beds has been aligned with the growth of the medical scheme beneficiaries. Figure 2 shows that the private health sector has provided approximately 4 beds per 1 000 beneficiaries for the last nine years.
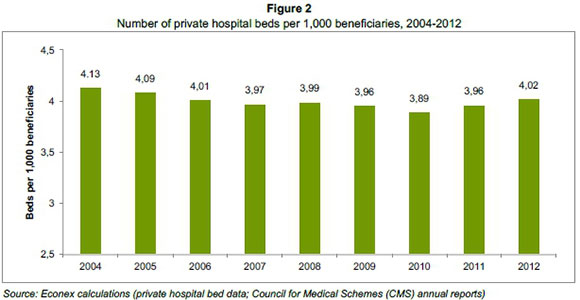
The data presented in Figures 1 and 2 do not provide any information on the structural changes in the market, and the stagnant trend of beds per beneficiary does not mean that the underlying market dynamics have remained the same. It is possible that changes in ownership or the growth of particular companies may have affected the structure of the market in a way that is not captured by looking at the overall number of beds or the ratio of beds per beneficiary alone.
In Figure 3 the results of the market concentration analysis for private hospitals are presented. As explained before, the independent hospitals (those not part of HASA and/or the NHN at the time) negotiated individually, therefore these facilities were treated separately in the HHI calculations before and after the Tribunal ruling that prohibited collective bargaining, which explains why we do not see an HHI value of 10 000 prior to 2003. The individual treatment of independent hospitals was a notable improvement from previous concentration analyses as independent hospitals were often not counted separately, but incorrectly combined as a group, thereby artificially inflating the collective market share of independent hospitals and hence the HHI value or market concentration.
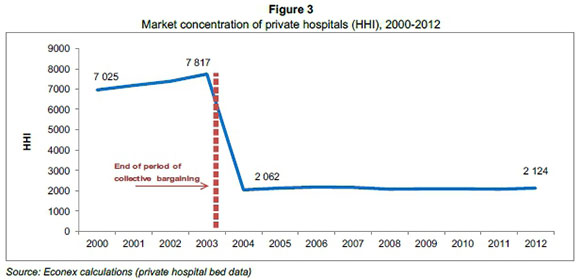
The HHI shows an increasing trend in concentration from 2000 to 2003 due to consolidation in the private hospital industry during that time. As a result of the collective bargaining at that stage, this did not have a significant impact on the already concentrated market. After the Tribunal ruling however, market concentration decreased significantly to a HHI of 2 062 as each hospital group was treated as a separate entity from that year onwards, and not as a collective under HASA. Thereafter, the HHI remained around this level until 2012 with a value of 2 124. As a result we do not see any meaningful increases in market concentration between 2004 and 2012.
A particularly interesting feature of the results shown in Figure 3 is the flat trend in market concentration for the private hospitals from 2004 to 2012. Given the number of mergers and acquisitions approved by the CC during this period, one would have expected an upward trend in concentration. In-depth consideration of the private hospital bed data indicates many changes in the underlying data, e.g. in ownership and bed numbers for the various groups. However, the way in which the HHI is calculated means that this indicator of market concentration would not vary much if bed numbers across all groups continue to increase, as opposed to increased bed numbers for just one or two of the groups. In essence, the increased number of total beds in the market as a whole meant that individual market shares remained relatively stable during this period.
The underlying data show that all of the three listed hospital groups built new hospitals after 2004 (e.g. Life Beacon Bay, Mediclinic Cape Gate, Netcare Blaauwberg), while all of them also acquired/merged with existing hospitals (e.g. Netcare Linkwood Clinic, Mediclinic Emfuleni (and the rest of the Protector group) and Life Bayview). At the same time the NHN increased their members by adding new and existing independent hospitals to their network (e.g. Denmar Specialist Psychiatric Hospital, Fochville Hospital), but some hospitals also resigned from the NHN (e.g. Medsac Private Hospital, Clinix Group which had to resign from the NHN due to Netcare's shareholding in one of the hospitals and the NHN's exemption conditions stating that none of the three large hospital groups may have shareholding in any of the NHN member hospitals). Some independent hospitals entered the market (e.g. Cullinan Private Clinic, Lime Acres Clinic), - which would have caused a decrease in the HHI, and some of the existing independent groups expanded their hospitals (e.g. Anglogold, Clinix). These market dynamics are not adequately captured in a simple measure of concentration, such as the HHI. Some of these structural changes would have caused an increase in concentration, while others would have had the opposite effect. Overall, it seems that many of the changes in ownership and membership, as well as the increases in bed numbers, coincided in such a way that market concentration in 2012 was not much different from what it was in 2004. However, this is mainly due to the fact that a simple concentration measure like the HHI cannot reflect such underlying structural changes. Nevertheless, since the aim of this analysis is to compare structural changes in the three markets (private hospitals, medical schemes and administrators), we find the HHI a useful summary measure. We also note that the HHI was used in many of the private hospital mergers considered by the competition authortities.
5.2 Medical schemes
Figure 4 provides the results of the HHI market concentration measures for the medical schemes market from 2004 to 2012. A steady upward trend in concentration is visible for this market. The HHI increased from 712 in 2004 to 1 331 in 2012. However, it is more appropriate to analyse the market for open schemes separately from that of restricted schemes, as open schemes directly compete with one another in the market for beneficiaries. Competition for beneficiaries is almost non-existent between restricted schemes, as employers mandate membership to the in-house scheme if provided. It is for this reason that we consider the market concentration for open medical schemes separately.
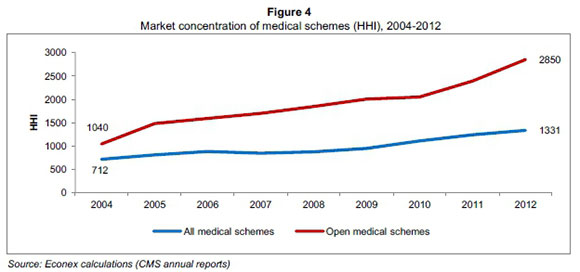
From the evidence presented in Figure 4, it is clear that there has been a consistent increase in market concentration of the open medical schemes market. The HHI increased almost threefold from 1 040 in 2004 to 2 850 in 2012. The steady increase in market concentration was largely due to the significant growth in Discovery Health's membership (and one or two other large open schemes), as well as many amalgamations among the schemes.
The increase in market concentration for open medical schemes is in stark contrast to the flat market concentration trend for private hospitals over the same time period. This has certainly impacted on the institutional environment and market dynamics in the private health sector, as will be discussed in more detail below.
5.3 Administrators
In Figure 5 the market concentration for medical scheme administrators is examined. We consider this market in addition to that of medical schemes, as administrators are important players in South Africa's private healthcare sector. In most instances, it is the administrators who negotiate with the private hospitals annually to determine the national fee increases (prices for hospital services), on behalf of medical schemes.
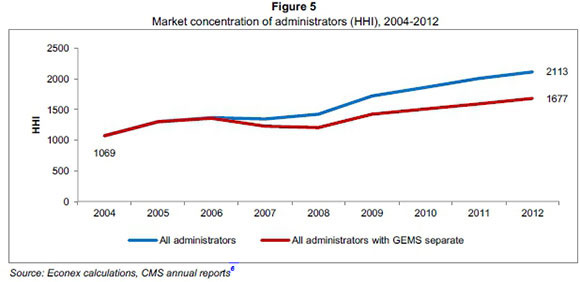
Similar to the trend in concentration for all medical schemes, the administrator market is also characterised by steadily increasing levels of concentration, albeit at a lower level than those of open medical schemes. In 2004, the HHI level in the administrator market was at 1 069, increasing to 2 113 in 2012 (see Figure 5).7
The introduction and rapid membership growth of the Government Employees Medical Scheme (GEMS) from 2006 onwards is one of the primary reasons for the trend observed. However, we also calculated the concentration of the administrator market counting the GEMS beneficiaries separately from Metropolitan (i.e. treating GEMS as an 'adminstrator' on its own) as GEMS negotiates with providers directly, and not via its administrator.
Figure 5 indicates that, as one would expect, the levels of concentration were slightly lower for the administrator market when GEMS was treated separately. There was, however, still an upward trend for the index, showing that the market was more concentrated in 2012 than in 2004.
It is clear that there have been some structural changes in the private health sector over the past few years, with increases in concentration levels specifically for the medical scheme and administrator markets. In the context of the above analysis, the following section considers the interaction of the funder and provider sides of this sector, with the aim of determining how changes in market concentration may have influenced negotiating power during this period.
6 The balance of power
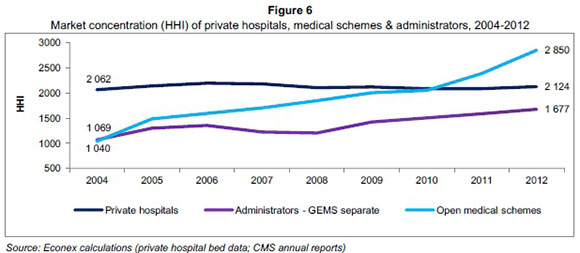
Figure 6 shows the HHI measures of concentration for the three markets analysed above. Given the unique features of the private healthcare market in South Africa and the practicalities regarding annual national tariff negotiations, we proceed to analyse open medical schemes and administrators, treating GEMS separately. We consider how changes in the market concentration have affected institutional dynamics and also, to an extent, market power.
6.1 Market concentration trends from 2004 to 2012
In 2004 there was a large difference between the HHI for private hospitals (2 062), that of the administrators (1 069) and open medical schemes (1 040) markets. Over time, this discrepancy decreased due to increases in concentration of the open medical scheme and administrator markets while concentration in the private hospital market remained fairly constant. By 2010 there was very little difference between concentration in the private hospital and open medical scheme markets, at HHI levels of 2 088 and 2 049 respectively. The level of concentration continued to increase for administrators and also increased sharply for open medical schemes, reaching 1 677 for administrators (GEMS separate) and 2 850 for open medical schemes in 2012.
Such significant changes in the market concentration of administrators and open schemes in particular, would certainly have impacted on the balance of power in the private health sector. All in all, the results indicate that this increased concentration may have improved the medical schemes' and administrators' countervailing buyer power vis-à-vis the private hospitals over the past few years.
6.2 Market concentration and market power: Some caveats
6.2.1 Benefits and limitations of concentration analyses
All other things being equal, the larger the number of independent firms operating in a market, the less likely the possibility of abuse of dominance by one, or a small number of large firms. The use of concentration indices is a good starting point for determining market structure (Motta, 2004). Concentration indices are simple to calculate, provide valuable summary information on markets and are comparable across time, making it easy to determine how market concentrations have increased or decreased over a given period. In our analysis we focused specifically on the HHI as a summary concentration measure, as it has become standard practice to calculate this index in South African mergers, including those that took place in the private hospital sector. These results can therefore easily be compared to previous work done by various economists during these merger proceedings.
6.2.2 Concentration analyses in the healthcare sector
It is important however to point out that there are various reasons why concentration indices like the HHI should be interpreted with care in the context of medical services markets specifically. While concentration can influence market power significantly, it is not the only factor important to the annual national tariff negotiation process between the schemes/administrators and private hospitals.
The negotiation process involves many components, including the pricing model, price increases, quality performance, payment terms, the specific administration system and credit risks. Medical schemes also have a number of tools available to control private hospital expenditure which also increases their bargaining power when negotiating prices with the hospitals. Examples of such tools are hospital networks, managed care protocols, reimbursement models, doctor networks, deductibles, doctor incentives, and the use of day clinics.
6.3 Market dynamics
The analyses presented here showed increasing trends in market concentration for the administrator and medical scheme markets, especially for open medical schemes. This happened while concentration of the private hospital market remained stable. Given the specific institutional arrangements and the nature of the annual bilateral national tariff negotiation processes, it can be assumed that this increase in concentration among the medical schemes and administrators would have improved their negotiating power.
The fact that medical schemes are well positioned to exercise countervailing buyer power has been recognised by the competition authorities. The Competition Tribunal accepted in the Phodiclinics/Protector Group merger (Phodiclinics (Pty) Ltd and Protector Group Medical Services (Pty) Ltd, 2005) that medical schemes do enjoy some countervailing power and this view was confirmed in the Netcare/Community Healthcare merger (Netcare Hospital Group (Pty) Ltd and Community Hospital Group (Pty) Ltd, 2006), in 2007. In the case of the large administrators, they negotiate tariffs on behalf of significant membership and use their volumes to wield this countervailing power.
7 Concluding remarks
This article evaluated changes in concentration in private hospital, medical scheme and administrator markets in South Africa. We find that concentration in the private hospital market has remained stable since 2004, following the Tribunal ruling in 2004, prohibiting collective bargaining by HASA, BHF and SAMA. In contrast, market concentration for administrators as well as medical schemes (open medical schemes, in particular) has increased to levels close to or above those of the private hospitals. While we note that market concentration is not the only factor at play in negotiating prices for healthcare services, our results suggest that the bargaining dynamics within the private healthcare market have changed considerably over the past decade and it would be prudent for the CC to bear these results in mind when analysing competition in the private healthcare sector.
References
AMERICAN MEDICAL ASSOCIATION. 2014. Competition in health insurance: A comprehensive study of U.S. markets. [ Links ]
AUSTIN & HUNGERFORD. 2009. The market structure of the health insurance industry. Congressional Research Service, 1-65. [ Links ]
CHEN, C. & CHENG, S. 2010. Hospital competition and patient-perceived quality of care: Evidence from a single-payer system in Taiwan. Health Policy, 98:65-73. [ Links ]
COUNCIL FOR MEDICAL SCHEMES. Annual reports. Available at: http://www.medicalschemes.co.za [accessed November 2013].
EUROPEAN UNION. 2004. Guidelines on the assessment of horizontal mergers under the Council Regulation on the control of concentrations between undertakings. Official Journal of the European Union, 47:5-18 http://eur-lex.europa.eu/LexUriServ/LexUriServ.do?uri=OJ:C:2004:031:0005:0018:EN:PDF [accessed January 2014]. [ Links ]
GAYNOR, M., MORENA-SERRA, R. & PROPPER, C. 2010. Death by market power: reform, competition and patient outcomes in the national health service. NBER Working Paper Series, W16164. Available at: http://www.nber.org/papers/w16164.pdf [accessed December 2013]. [ Links ]
MORIYA, A.S., VOGT, W.B. & GAYNOR, M. 2010. Hospital prices and market structure in the hospital and insurance industries. Health Economics, Policy and Law, 1-21. [ Links ]
MOTTA, M. 2004. Competition policy: Theory and practice. Cambridge University Press: Cambridge. [ Links ] Netcare Hospital Group (Pty) Ltd and Community Hospital Group (Pty) Ltd Case No. 68/LM/Aug06 at para 59.
OECD. 2012. Competition in hospital services. Policy Roundtables, 1-392. [ Links ]
Phodiclinics (Pty) Ltd and Protector Group Medical Services (Pty) Ltd Case No. 122/LM/Dec05 at para 178.
SCHMID, A. & ULRICH, V. 2013. Consolidation and concentration in the German hospital market: the two sides of the coin. Health Policy, 109:301-310. [ Links ]
U.S. DEPARTMENT OF JUSTICE AND THE FEDERAL TRADE COMMISSION. 2010. Horizontal merger guidelines. U.S. Department of Justice and the Federal Trade Commission. http://www.justice.gov/atr/public/guidelines/hmg-2010.html#5c [accessed January 2014]. [ Links ]
VOGT, W.B. & TOWN, R. 2006. How has hospital consolidation affected the price and quality of hospital care? The Robert Wood Johnson Foundation. Research Synthesis Report, No 9. Available at: http://hdl.handle.net/10244/520 [accessed January 2014]. [ Links ]
Accepted: October 2015
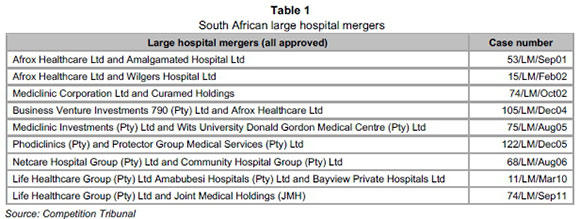
1 A list of approved hospital mergers during this time is provided in Appendix A.
2 See for instance, OECD (2012:293).
3 MSAs are geographical areas used by Federal statistical agencies in collecting, tabulating, and publishing Federal statistics.
4 For the medical scheme market and the administrator market we used the number of beneficiaries represented by each entity to determine the respective market shares. One could also have used other indicators to calculate market concentration in the medical schemes/ administrators' markets: for example, net contribution income or perhaps real reserves per beneficiary. However, it is understood that one of the most important factors influencing negotiating power on the side of the funders, is beneficiary numbers. Funders may negotiate discounts on provider tariffs in return for larger volumes of potential patients.
5 Econex is an economics consulting firm working in various sectors, including the private health sector (http://www.econex.co.za). The dataset for private hospital beds is described in section 5.1 of this article.
6 Note that in 2012, both Metropolitan and Medscheme provided administration services to the Government Employees Medical Scheme (GEMS). However, since Medscheme provided only managed care services and Metropolitan remained their primary administrator, the 1.75 million GEMS beneficiaries were included with Metropolitan only in the data series for 'all administrators'.
7 Throughout the dataset, Metropolitan and Momentum are treated as two separate entities even though the merging of these companies was already approved in 2010. This is aligned with the CMS annual reports which also report their data separately.
Appendix A: Large hospital mergers (2001-2011)
Appendix B: Herfindahl-Hirschman Index (HHI)
The HHI is defined as the sum of the squares of the market shares of all firms within the industry, where the market shares are expressed as percentages. The index can range from 0 to 10 000, moving from a large number of very small firms to a single monopolistic producer. For example, in a monopolistic market where there is only one firm, its market share is 100 per cent and the HHI would therefore be 1002, i.e. 10 000. The index is given by the following equation:

where si is the market share of firm i in the market and N is the number of firms. The HHI thus takes into account both the number and size distribution of the firms in the industry. By squaring market share, more weight is attached to the influence of larger firms within an industry.

