


Serviços Personalizados
Artigo
 Inglês (pdf)
 Artigo em XML
 Referências do artigo
Indicadores

Links relacionados
-
 Citado por Google
 -
 Similares em Google
Compartilhar

 Permalink
South African Journal of Economic and Management Sciences
versão On-line ISSN 2222-3436
versão impressa ISSN 1015-8812
S. Afr. j. econ. manag. sci. vol.19 no.1 Pretoria 2016
http://dx.doi.org/10.17159/2222-3436/2016/v19n1a2
ARTICLES
Earnings management through loss Avoidance: Does South Africa have a good story to tell?
Mangakane Lehlogonolo PududuI; Charl de VilliersII
IDepartment of Accounting, University of Pretoria
IIThe University of Auckland and Department of Accounting, University of Pretoria
ABSTRACT
The purpose of this study is to determine whether South African managers manage earnings to avoid reporting small losses (small earnings decreases). The study covers all the companies listed on the Johannesburg Stock Exchange (JSE) from 2003 to 2011. In line with Burgstahler and Dichev (1997), the cross-sectional distributions of earnings and changes in earnings are examined and the distributions are shown in histograms. Previous research (using data from the United States) has shown that the distribution curve for both the earnings and the change in earnings variable had noticeably fewer observations just below zero than would normally be expected, and a significantly higher number of observations just above zero. This pattern in the distributions suggests that managers manage reported earnings to ensure that earnings do not fall below a specific threshold, this being zero or the previous year's performance. Interestingly, and in contrast with the previous literature, using the Burgstahler and Dichev (1997) research model of analysis, our results show no evidence of managers in South Africa managing earnings to avoid reporting small losses or small decreases in earnings. A possible reason for this could be the relatively smaller size of the JSE (compared with stock exchanges in the United States). In addition, and more important, is the possibility that investors and analysts in South Africa may be fixated on other performance indicators, such as revenue and headline earnings per share, rather than on earnings (profits). This study adds to the limited research on earnings management in South Africa, which is a developing economy. Furthermore, previous research shows an inverse relationship between earnings management and earnings quality. The results of this study may therefore be useful to the users and the regulators of financial reports, both are concerned with earnings for the purposes of assessing the cost of capital and how companies utilise their resources.
Key words: earnings quality, earnings management, discontinuity of earnings / change in earnings, loss / earnings decrease avoidance
1 Introduction
Earnings quality has been a subject of notable global interest, primarily because of the major corporate failures that transpired in the early 2000s. Accounting scandals at prominent companies like Enron, WorldCom, and Parmalat have led to a loss of investor confidence in the integrity of the financial reporting process and the published earnings numbers (Koh, Matsumoto & Rajgopal, 2008).
The literature shows that earnings quality is important to various stakeholders. Earnings play an important role in informing the users of financial reports on how a company makes use of its resources (Burgstahler & Dichev, 1997a); the literature also presents strong evidence on the value relevance of earnings (Miller & Modigliani, 1961; Ball & Brown, 1968; Beaver, 1968; Dechow, Sloan & Zha, 2014). Further, investors, analysts, creditors and other key lenders use financial information when making critical economic decisions (IASB, 2010). Research also shows an inverse relationship between earnings quality and the cost of capital: the higher the earnings quality, the lower the cost of capital (Bhattacharya, Ecker, Olsson & Schipper, 2012; Barth, Konchitchki & Landsman, 2013). Regulators like the International Accounting Standards Board (IASB) and the South African Institute of Chartered Accountants (SAICA) are also concerned with earnings quality, as financial reports reflect the outcome of, inter alia, the standard-setting process (Schipper & Vincent, 2003). Pratt (2000:750) defines earnings quality as the "extent to which net income reported on the income statement differs from true earnings", while Schipper and Vincent (2003:98) define earnings quality as the "extent to which reported earnings faithfully represent Hicksian income (Hicks, 1939)." Both definitions require that quality earnings be unbiased and accurate in representing a company's economic activities and actual earnings.
Barth, Landsman and Lang (2008) argue that earnings management is one of the major activities that reduce earnings quality, positing an inverse relationship between the level of earnings management and the quality of earnings, that is, the higher the level of earnings management, the lower the quality of earnings. Healy and Wahlen (1999:368) define earnings management as
management's use of judgement in financial reporting and in structuring transactions to alter financial reports to either mislead some stakeholders about the underlying economic performance of the company or to influence contractual outcomes that depend on reported accounting numbers.
This definition encompasses both accruals earnings management (AEM) and real earnings management (REM), in order to create a misleading favourable impression of the company's financial performance and position. AEM involves managing (manipulating) earnings by means of the financial reporting process, for example, showing bias in selecting specific accounting policies and estimates (Rossouw, 2010), while REM entails the management (manipulation) of the actual economic activities of an entity (Mey & De Klerk, 2015). A manager may, for example, process unwarranted fair value adjustments to assets or liabilities in order to boost profits (AEM). Alternatively, a manager may offer very lenient credit terms close to year-end in order to boost sales; such actions may lead to the company raising bad debts (credit losses) in future periods, which would have a negative effect on expected future cash flows. Ultimately, when this practice becomes excessive, REM and AEM often lead to corporate fraud (Lin & Wu, 2014).
Previous research to determine and observe the occurrence of earnings management can be grouped into four (4) broad categories:
1) The first category focuses on the assessment of aggregate accruals (Jones, 1991).
2) The second category of research evaluates specific accruals, such as provision for bad debts (McNichols & Wilson, 1988).
3) The third category observes real earnings management (Graham, Harvey & Rajgopal, 2005; Roychowdhury, 2006; Xu, Taylor, & Dugan, 2007; Cohen & Zarowin, 2010).
4) The fourth category analyses the cross-sectional distribution properties of earnings (change in earnings) for a large sample of companies (Burgstahler & Dichev, 1997b; Degeorge, Patel & Zeckhauser, 1999; Beatty, Ke & Petroni, 2002; Leuz, Nanda & Wysocki, 2003; Shen & Chih, 2005; Burgstahler & Eames, 2006; Ebaid, 2012).
The first two categories concentrate on AEM, while the third focuses on REM. However, the fourth category makes no assumption when it comes to how earnings are managed, but points out only that the objective is to achieve a specific earnings target. The current available literature on loss avoidance has focused mainly on AEM, but REM has not been completely excluded. Benchmark targeting can be achieved just as effectively through lenient credit terms, inasmuch as it can be achieved through fair value adjustments. This study focuses on the fourth category, examining cross-sectional distributions of earnings and change in earnings, in order to detect earnings management in South Africa (SA) by the managers of companies listed on the Johannesburg Stock Exchange (JSE).
The literature suggests that companies with increasing earnings patterns have significantly higher price-earnings ratios (Barth, Elliott & Finn, 1999) and enjoy economically significant abnormal returns (Myers, Myers & Skinner, 2007). Kasznik and McNichols (2002) find that the market rewards companies for meeting current period earnings expectations, even after taking into account the impact of future earnings expectations. Additionally, research shows that companies breaking such earnings patterns experience substantially negative abnormal share returns (DeAngelo, DeAngelo & Skinner, 1996; Barth et al., 1999). Managers on share-based remuneration schemes therefore have an incentive to report profits (loss avoidance) and an earnings number greater than or equal to that of the previous year (Pretorius & De Villiers, 2013). Burgstahler and Dichev (1997b) suggest that, in an attempt to meet or beat earnings expectations, thereby avoiding negative market reactions, managers purposefully adjust reported earnings, creating information asymmetries between actual economic performance and reported earnings.
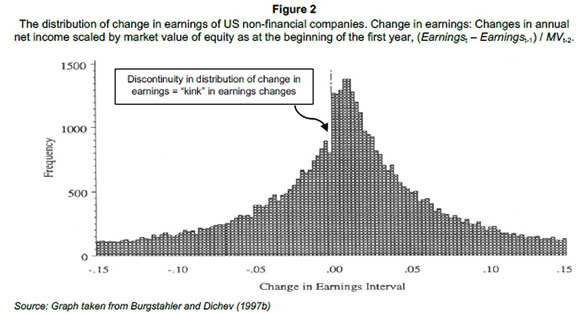
Like Burgstahler and Dichev (1997b), we base the definition of small losses and small earnings decreases on the findings by Hayn (1995). With reference to the graphical representation (histogram) of cross-sectional distributions of earnings and the change in earnings (scaled by the book value of equity), small losses and small earnings decreases are defined as those earnings and change in earnings that fall immediately below the zero interval (small profits and small earnings increases are just above zero). We continue to define earnings management to avoid earnings decreases and losses with reference to the cross-sectional distributions of earnings and change in earnings. For the purposes of loss avoidance, earnings management will be reflected in the form of unusually low frequencies of small losses (the interval just below zero) and unusually high frequencies of small positive earnings (the interval just above zero), while earnings management to avoid earnings decreases is likely to be reflected in the form of unusually low frequencies of small earnings decreases and unusually high frequencies of small earnings increases. For the frequency to be unusual, we expect to observe a discontinuity in the distribution pattern of earnings (change in earnings), with a dip (kink) in the distribution curve in the interval just below zero.
The seminal work of Burgstahler and Dichev (1997b) provides compelling evidence to suggest that the avoidance of earnings decreases and losses is a widespread phenomenon in the United States (US). They found that an estimated 30-40 per cent of non-financial companies with small losses manage earnings to create small profits. Approximately 8-12 per cent of non-financial companies with small decreases in earnings adjust their earnings to achieve small earnings increases. As evidenced in Figures 1 and 2, the salient feature in the histograms is the discontinuity in the earnings and the change in earnings intervals around zero. Not only is there a significant peak in the interval to the immediate right of zero (small profits or earnings increases), there is also a noticeable break (kink) in the smooth curve in the interval to the immediate left of zero (small losses or earnings decreases). This suggests that the managers of a number of companies that were about to report an earnings number just below zero, Figure 1 (or just below the previous year's number, Figure 2), adjusted the earnings so that they were just above those thresholds.

The objective of this study is to address the following question: Do South African managers manage earnings in order to avoid reporting small losses and small decreases in earnings? We examine whether the managers of companies listed on the JSE manage earnings to: (1) avoid reporting small losses (small earnings decreases); and (2) target small profits (small earnings increases) in order to sustain recent performance. We present the cross-sectional distributions of earnings and change in earnings, focusing on the distribution properties around zero. The sample covers the period from 2003 to 2011 and includes 2,455 firm year observations for earnings and 2,100 firm year observations for the change in earnings.
This study contributes to the limited body of literature on the avoidance of earnings decreases and losses in developing economies (Leuz et al, 2003; Shen & Chih, 2005; Ebaid, 2012), which play an important role in the resolution of global economic imbalances (Peltonen, Sousa & Vansteenkiste, 2012). First, Shen and Chih (2005) focused on financial services companies, while our study provides an analysis of all the JSE companies, as well as a separate analysis of non-financial companies. Second, Leuz et al, (2003) examined only the distribution properties of earnings losses, while this study also incorporates earnings decreases. Examining earnings decreases is equally important, because the previous year's performance is a common benchmark in the assessment of management performance. Third, Shen and Chih (2005) and Ebaid (2012) report that their results provide evidence to suggest earnings management in their sample companies. This inference is based only on the significant peaks they report in the interval to the immediate right of zero. However, both studies overlook the fact that there is no discontinuity (kink) in the interval to the immediate left of zero, which is the key signal of earnings management in this research design. A peak in small positive earnings (change in earnings) is not, on its own, enough to infer that there has been earnings management. This study provides additional insight into, and understanding of the interpretation of the pattern of the distribution of earnings and change in earnings, providing further guidance for determining the existence of earnings management using the distribution properties of such variables.
The remainder of this paper is set out as follows: Section 2 comprises the literature review on earnings management, focusing specifically on earnings management to avoid earnings decreases and losses. The background to the South African environment is also included. The section concludes by stating the hypothesis. The research method is discussed in Section 3 and the results are presented in Section 4. Section 5 presents a broader discussion on the findings, their implications and a conclusion.
2 Literature review
Prospect theory proposes that humans, by nature, are risk averse, and, when confronted with choices, are more likely to choose the alternative which is the least likely to put them into a loss position (Kahneman & Tversky, 1979). In order to determine what this is, a reference point is established, for example, the individual's original state of wealth. This theory implies that individuals would rather sacrifice potential gains to maintain their original state of wealth. This becomes the threshold by which success is measured. It demonstrates how important it is for people to have a point of reference when making decisions. Consequently, it is natural for external stakeholders, such as investors, analysts, banks and creditors, to use thresholds (reference points) as a means of judging and rewarding management performance. The end result is that managers also focus on thresholds, such as positive, consistent earnings and analyst forecasts, when reporting to their stakeholders (Degeorge et al., 1999).
Although earnings management is hard to detect (Hay, 2015), previous research shows significant decreases in share prices associated with negative earnings surprises (Skinner & Sloan, 2002; Kinney, Burgstahler & Martin, 2002) and a positive market response to companies that meet or beat analyst earnings forecasts (Bartov, Givoly & Hayn, 2002; Kasznik & McNichols, 2002; Burgstahler & Eames, 2006). Barth et al., (1999) investigated the value relevance of increasing earnings patterns using the permanent earnings model by Miller and Modigliani (1966) and the accounting-based valuation model by Ohlson (1995). Results from both models provide evidence suggesting that companies with patterns of increasing earnings have considerably better price-earnings ratios. Myers et al., (2007) found that, after controlling for economic performance, companies that reported unusually long sequences of uninterrupted increases in earnings per share (EPS) enjoyed significantly abnormal returns for as long as EPS continued to increase, but suffered significant share price decreases when the series was broken. While Kaznik and McNichols (2002) showed that companies meeting earnings expectations had a significantly higher earnings forecast and realised higher earnings than companies that did not. This evidence suggests that the market rewards companies that meet current period earnings expectations. They also found evidence to suggest that this premium may be a reflection of investors' perception that companies consistently meeting expectations are less risky than companies that do not.
The earliest finding on the discontinuity of earnings around zero is documented by Hayn (1995), who found a high concentration of earnings observations just above zero, while there were fewer observations than expected just below zero. In accordance with prospect theory, these findings suggest that, when faced with small losses, management is more likely to manipulate earnings upwards in order to report small positive earnings, i.e. earnings just above zero. Burgstahler and Dichev (1997b) examined non-financial companies in the US for the period 1976 to 1994 and observed statistically significant irregularities around zero in the distribution of earnings and change in earnings, suggesting that managers were managing earnings to achieve specific earnings thresholds. Following Burgstahler and Dichev (1997b), Degeorge et al., (1999) developed a model to identify earnings management patterns that produce specific breaks and distortions in the distribution of observed earnings. Their model shows how efforts to exceed thresholds induce a unique blueprint of earnings management. Earnings that fall just below thresholds are managed upwards; earnings that are far from thresholds, whether below or above, are trimmed down, making future thresholds more achievable. Burgstahler and Eames (2006) provide evidence suggesting that earnings are managed upwards in order to meet or slightly beat analyst forecasts and avoid negative earnings surprises.
Similar patterns of earnings management are noted in financial services companies. Beatty, Ke and Petroni (2002) hypothesised that the management of public banks is under greater pressure to report consistently-increasing earnings, as opposed to those of private banks. They investigated the credibility of the earnings management explanation by examining the stream of earnings changes and the components of these changes for public versus private banks. They found that, when compared with private banks, public banks are more likely to use income-increasing discretionary accruals to transform small earnings decreases before discretion, to small increases in reported earnings. They also found that public banks enjoyed a longer series of uninterrupted earnings increases.
Shen and Chih (2005) performed a cross-country study and used four measures to investigate the degree of earnings management in financial services companies, across 48 countries, (including South Africa and the United States). They suggested that banks in SA manage earnings in order to avoid reporting losses and earnings decreases. However, there are two concerns about their research design; the sample size from SA is relatively small, and the bin-width used in the histogram is too wide. Both of these factors could significantly affect the results. Shen and Chih (2005) do not address this in their analysis of South African financial services companies. Ebaid (2012) reports results similar to those of Shen and Chih (2005) for non-financial companies listed on the Egyptian stock exchange. Both studies report a significant peak only in small, positive earnings and earnings increases, with no discontinuity in small losses and earnings decreases. Leuz et al., (2003) performed a cross-country earnings management study on 31 countries, which included SA and the US, from 1990 to 1999. They used a small loss avoidance ratio (small profits to small losses) as a proxy for earnings management. They found that the institutional characteristics of SA correlated with higher levels of earnings management in comparison to those of the US. Their results suggest that there is a greater incidence of earnings discretion through loss avoidance in SA than there is in the US, although, when compared with the total sample, SA and the US exhibited significantly lower levels of earnings management through loss avoidance.
2.1 Criticisms of the earnings management hypothesis
Several studies have criticised the research method and findings of Burgstahler and Dichev (1997b) and Degeorge et al., (1999). McNichols (2000) argues the unlikelihood that the large differences in the narrow intervals around specific earnings thresholds were due to the behaviour of the nondiscretionary component of earnings. Caylor (2010) found that, although income received in advance and accounts receivable are managed in an attempt to avoid negative earnings surprises, there is little evidence that either are managed to avoid reporting earnings decreases or losses. Dechow, Richardson and Tuna (2003) used discretionary accruals as a proxy for earnings management. Their results dispute the hypothesis that the discontinuity of earnings around zero is caused by earnings management through discretionary accruals. However, these studies do not consider any other method of earnings management (such as REM) that could be used to manage earnings towards benchmarks, and therefore it is impractical to generalise their results to all the earnings management scenarios. This study investigates the existence of earnings management to achieve earnings targets. The actual method used by management to manage earnings is outside the scope of this study but is an area for further research.
2.2 South African background
Earnings management occurs when management misleads the shareholders for various reasons, usually for their own personal gain. Managers use techniques like the premature recognition of revenue, delays in recognising expenses, and estimates to inflate or deflate profits. These financial practices result in inappropriate decision-making and, ultimately, financial loss for the shareholders, creditors and in many instances, the employees. SA is not without its fair share of corporate scandals, which may have resulted, amongst other things, from some level of earnings management (e.g. LeisureNet, Masterbond and Regal Bank). There is consequently a need for such earnings management research in a South African context. The study by Burgstahler and Dichev (1997b) was conducted on US companies for the period from 1976 to 1994. However, several considerations create the need for the research to be replicated in subsequent periods, particularly in SA.
First, the importance of corporate governance and investor protection since the original study was conducted must be considered. The research shows conflicting evidence on incentives to report positive increasing earnings. Koh et al. (2008) suggest that the market has become more sceptical of companies that meet or beat earnings expectations, particularly after the accounting scandals that broke in the early 2000s. Gilliam, Heflin and Paterson (2014) show evidence of significantly lower levels of earnings management through loss avoidance after the Sarbanes-Oxley Act of 2002 (SOX) was passed. In the US, SOX aimed to increase investor protection by holding top management individually accountable for financial reports, as well as increasing the independence of external auditors.
SOX was enacted consequent on accounting scandals, while, in 1994, the dawn of democracy and the re-emergence of SA into the global market created the need for the King Report on Corporate Governance. King I was replaced by King II in 2002 and by King III in 2009. One of the key differences between the King report and SOX is that of legal enforcement. SOX is a US federal law, whereas the King report is a non-legislative code based on principles. However, compliance with King is a JSE listing requirement. Although different, the two documents are fundamentally similar when it comes to the protection of external stakeholders, management accountability and the independence of the external auditor. Research shows that similar documents, such as the 2002 Chinese Code of Corporate Governance for Listed Companies, have had a positive effect on curbing earnings management in China (Chen & Zhang, 2014).
The second reason that there is a need for this study is the financial reporting framework used in SA as opposed to the one used in the US. In 1993, SA began the harmonisation process between South African Statements of Generally Accepted Accounting Practices (GAAP) and IFRS. This process of harmonization was completed in June 2004, when SAICA issued Circular 7/2004, announcing its decision to adopt the text of IFRS without any amendments (SAICA, 2004). Since 1973, the Financial Accounting Standards Board (FASB) has advised on and given input on the development of accounting standards in US GAAP. While the convergence project between US GAAP and IFRS continues, one of the key differences noted between the two frameworks lies in their conceptual approach: US GAAP is rules-based, whereas IFRS is principles-based. Both approaches have their points for criticism: the rules-based alternative encourages a checklist approach to financial reporting, which means that managers may structure transactions in such a way as to enable them to tick the checklist. The principles-based approach requires much more professional judgement in decision-making, allowing management more discretion in the financial reporting process. Interestingly, the research suggests that countries that apply either IFRS or US GAAP show less earnings management towards targets (Barth et al., 2008).
Third, Leuz et al. (2003) found that earnings management decreases with strong investor protection, because strong protection limits management from manipulating the financial reporting process. Investor protection decreases the incentive for management to create a false impression of the company's performance. They found that the legal protection of outside investors (La Porta, Lopez-de-Silanes, Shleifer & Vishny, 1998) was a key determinant of the quality of financial information communicated by insiders to outsiders, and had a direct relation to it. Although SA has one of the best financial reporting standards, the inhibiting characteristics of a developing economy remain; legal enforcement is not as strong as those of the developed economies such as the US. La Porta et al. (1998) score legal enforcement in SA as very low, with widespread corruption coming out at the forefront of investor concerns. Dyreng, Hanlon and Maydew (2012) found more foreign earnings management in companies with extensive operations in countries with a weak rule of law, than in companies with subsidiaries in locations where the rule of law is strong. Although quality financial reporting standards have been associated with lower levels of earnings management, the enforcement of these standards is still subject to the institutional characteristics according to which the country operates. In this case, lower legal enforcement may negate the higher quality financial reporting standards.
Lastly, the JSE is the largest stock exchange in Africa and remains an attractive investment worldwide. However, with approximately 400 companies, the JSE is still relatively small in comparison with the larger exchanges in the US, such as the New York Stock Exchange (approximately 8,000 companies) or the Nasdaq (approximately 3,400 companies), where research into loss avoidance has already been conducted. The JSE does not have as large an analyst following as that in the US, but, because of its size; it is easier to identify loss companies, which may have a direct impact on companies' share prices. There could therefore be a greater incentive for JSE-listed companies to avoid reporting small losses and target small profits, as loss companies are more conspicuous on a smaller stock exchange.
2.3 Hypotheses
The hypotheses, arising from the above discussion, are summarised in this section. Research suggests that there is a negative relationship between quality financial reporting standards and earnings management. However, legal enforcement in SA reduces the level of investor protection that can be expected for equity security holders in the country. The literature also suggests that there is an incentive for management to report positive increasing earnings, as this is directly associated with the positive market response. When considering the smaller size of the SA stock exchange, reporting earnings losses and decreases may draw unwarranted (negative) attention from investors. The conflicting research leads to the following hypotheses, stated in null form:
H1: Managers of companies listed on the JSE do not manage earnings to report small profits (avoid reporting small losses).
H2: Managers of companies listed on the JSE do not manage earnings to report small earnings increases (avoid reporting small earnings decreases).
3 Research method
3.1 Research model
Empirical histogram
This study uses an empirical histogram to present a graphical description of the cross-sectional distribution of earnings and change in earnings for JSE-listed companies. A histogram is used in statistics to provide graphical representation of the underlying frequency distribution of a set of a continuous variable. In order to construct the histogram, the correct bin-width has to be determined, as the choice of bin-width primarily controls the amount of smoothing inherent in the histogram (Silverman, 1986). In line with Scott (1992), the number of bins is calculated from a suggested bin-width h as:
h = 2(IQR)n-1/3 (1)
Where:
IQR is the sample interquartile range of the variable and is equal to Q3 - Q1.
n is the number of available observations.
The underlying assumption when calculating the bin-width is that the data is normally distributed under the null hypothesis of no earnings management.
Durtschi and Easton (2005) list several factors that may be attributable to the discontinuity of earnings and change in earnings documented by Burgstahler and Dichev (1997b): (1) deflation of the earnings metrics; (2) sample selection criteria; and (3) differences between the characteristics of observations to the left of zero and the characteristics of observations to the right of zero. Beaver, McNichols and Nelson (2007) also attribute the discontinuity of earnings to the asymmetric effects of negative special items and applicable effective tax rates for profit and loss companies. Beaver et al. (2007) argue that, under the null hypothesis of no earnings management, earnings distributions would still exhibit a break at zero due to the asymmetric effects of these earnings components.
This study builds on the work of Burgstahler and Dichev (1997b), while taking into account the issues identified in previous research, and examining earnings management by SA listed companies. The deflation of the earnings metrics was identified as an issue as the market value of equity may be based on biased opinions of the market, as a response to a company's earnings. To address this issue, this study uses the book value of equity to scale the earnings metrics for the purpose of comparing sample companies, instead of the market value of equity. In undocumented results, Burgstahler and Dichev (1997b) calculated their primary results using book value of equity, obtaining qualitatively similar results. Secondly, Durtschi and Easton (2005) highlight the risk that the sample selection criteria may lead to differential inclusion or exclusion of observations to the left of zero versus observations to the right of zero. For the purpose of this study, all the data available on McGregor BFA for companies listed on the JSE for the financial periods 2003 to 2011 were selected, therefore this process excludes selection bias.
The third issue highlighted in previous research is the difference between the characteristics of observations to the left of zero and the characteristics of observations to the right of zero (Beaver et al., 2007; Durtschi & Easton, 2005). Beaver et al. (2007) found that, although effective tax rate and negative special items contribute to the discontinuity at zero, neither component caused the observations to shift from small losses to small profits. Therefore, their results cannot exclude the earnings management hypothesis as an explanation for the discontinuity of earnings at zero. This study uses after-tax figures for the earnings metric. Additionally, the effect of negative special items has not been adjusted for in the earnings metric. The asymmetric effects of these earnings components are identified as possible limitations in the research design because these components may or may not cause bias to the standardised difference.
3.2 Sample and data description
The study includes all the companies with financial data available on the McGregor BFA database from 2002 to 2011. In order to be included in the sample for H1, the statement of financial position and statement of profit or loss had to be available for at least two consecutive years, for any of the ten years in the period 2002 to 2011. The sample selection process and restrictions for H1 yield a final sample of 2 455 earnings observations for 355 unique companies. To be included in the sample for H2, the statement of financial position and statement of profit or loss had to be available for at least three consecutive years for any of the ten years in the period 2002 to 2011. The sample selection process and restrictions for H2 therefore yield a final sample of 2 100 change in earnings observations for 352 unique companies.
Unit of analysis
The unit of analysis for H1 is the individual annual earnings for year t (line item 101 as per McGregor BFA, Profit attributable to Ordinary Shareholders) scaled by the opening book value of equity for year t (line item 001 or 007 as per McGregor BFA, Ordinary Shareholders ' Interest or Ordinary Shareholders ' Interest After Adjustments). For the purposes of H2, the unit of analysis is change in earnings, which is the difference between earnings for year t and year t-1, scaled by the opening book value of equity for year t-1.
4 Results
4.1 Descriptive statistics
Table 1 presents the descriptive statistics for the variables used in Equation (1). Panel A presents the descriptive statistics for the earnings variable (earnings scaled by the book value of common equity at the beginning of the year). The descriptive statistics for the change in earnings variable (change in earnings scaled by the book value of common equity at the beginning of the first year) are presented in Panel B. The total number of observations for the earnings variable is 2,455. Panel A reveals that the mean and median for each of the earnings variables are reasonably close to each other and have a comparatively asymmetrical distribution with a positive skew. However, after adjusting for outliers, the skewness for the earnings variable is only (-0.064), suggesting that the distribution of earnings is relatively symmetrical. Panel B reveals a total sample for the change in earnings variable of 2,100 observations. There is a slight difference between the mean and the median of each of the change in earnings variables, with a relatively positive skew. After adjusting for outliers, the mean and median for the change in earnings variable are relatively closer to each other, with a moderately positive skew (1.294), suggesting a modest right tail. After adjusting for outliers, the standard deviation for both the earnings variable (0.556) and the change in earnings variable (0.838) reveal that the distributions are relatively close to the means.
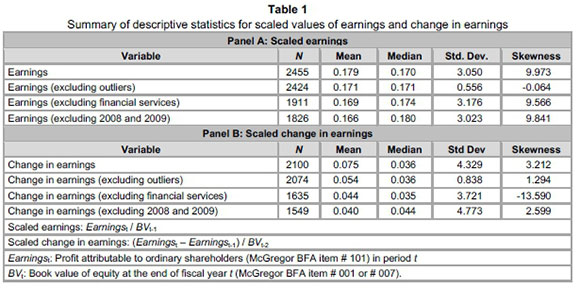
Table 2 (Panel A) reports the descriptive statistics, by year, of the earnings variable. The total number of observations increases relatively smoothly from approximately 200 for 2003 to just over 340 for 2011. The mean and median earnings are mostly positive throughout the sample period, with the exception of the mean for 2011. Throughout the sample period, the mean is slightly greater than the median, with the exception of 2003, 2010 and 2011.
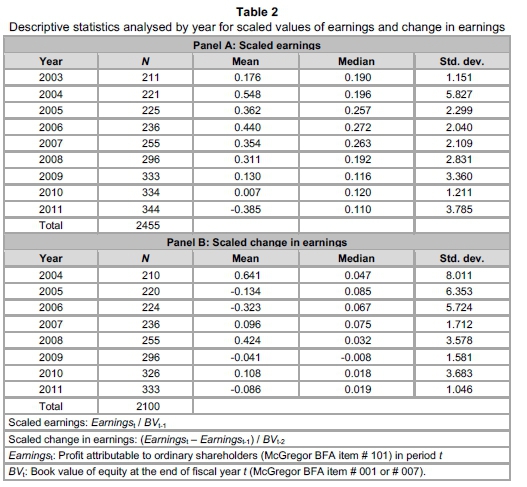
Panel Β shows the descriptive statistics, by year, of the change in earnings variable. The number of available observations increases steadily from 210 for 2004 to approximately 330 for 2011. The pattern in the mean and median for change in earnings is comparatively intermittent, with negative means observed for half of the sample period and only one year with a negative median of -0.008.
4.2 Findings
A histogram of the earnings variable with interval widths of 0.041 for the range -0.61 to +0.61 is presented in Figure 3. The interval widths for all the histograms were calculated using Equation (1) in accordance with Scott (1992). The figure shows a peaked, bell-shaped distribution. A relatively smooth distribution is observed in the interval to the immediate right of zero (0.000, 0.041), earnings marginally greater than zero occur only slightly more frequently than would be expected. This is inconsistent with the earnings management hypothesis to achieve small positive profits. In contrast with Burgstahler and Dichev (1997b), earnings slightly less than zero (-0.041, 0.000) do not appear (at least graphically) to occur less frequently than would be expected, given the relative smoothness of the remainder of the distribution.
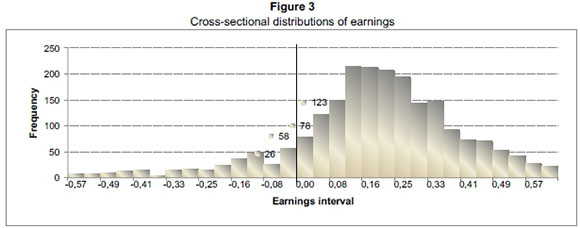
Empirical cross-sectional distributions of annual profit attributable to ordinary shareholders (McGregor BFA #101) scaled by beginning of the year book value of common equity (McGregor BFA #007 or #001), for financial years 2003 to 2011. The distribution interval widths are 0.041 and the solid line marks the location of zero on the horizontal axis. With an interval width of 0.041, the first interval to the right of zero contains all the observations in the interval [0.000, 0.041], the interval to the left of zero contains all the observations in the interval [-0.041, 0.000]. The vertical axis labelled frequency represents the number of observations in each earnings interval.
Figure 4 shows the cross-sectional distribution of change in earnings with histogram interval widths of 0.032 for the range -0.48 to +0.48. The histogram in Figure 4 displays a single-peaked bell-curve. However, there is greater irregularity around zero in comparison with Figure 3. Change in earnings slightly greater than zero (0.000, 0.032) occur more frequently than would be expected, in line with the earnings management hypothesis for beating prior year's performance. However, the number of observations in the interval to the immediate left of zero (-0.032, 0.000) do not appear anomalous when compared to the smoothness of the remainder of the distribution, and there is a disparity between these results and the findings by Burgstahler and Dichev (1997b) for change in earnings.
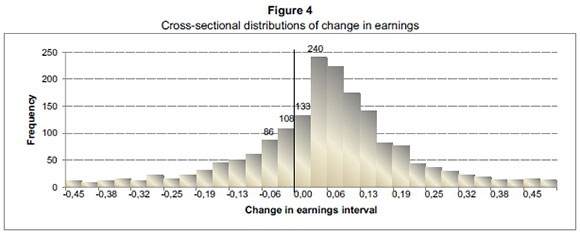
Empirical distributions of changes in annual profit attributable to ordinary shareholders (McGregor BFA #101) scaled by the book value of common equity (McGregor BFA #007 or #001) as at the beginning of the first year, for financial years 2004 to 2011. The distribution interval widths are 0.032 and the solid line marks the location of zero on the horizontal axis. With an interval width of 0.032, the first interval to the right of zero contains all observations in the interval [0.000, 0.032], the interval to the left of zero contains all the observations in the interval [-0.032, 0.000]. The vertical axis labelled frequency represents the number of observations in each change in earnings interval.
Exclusion of the financial services sector
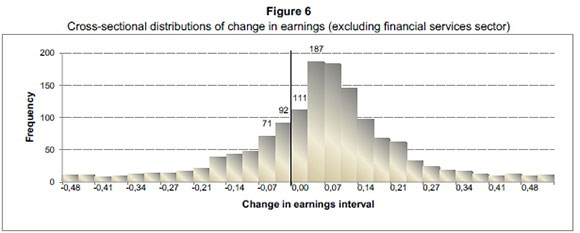
Because the operating environment of the financial services sector differs from that of other industries, the cross-sectional distribution of earnings and change in earnings for all companies, excluding those in the financial services sector, were further analysed. The results in Figure 5 and Figure 6 show that the inclusion of the financial services sector in the initial sample does not influence the results, i.e. the histograms still show a smooth distribution in earnings and change in earnings at the zero interval.
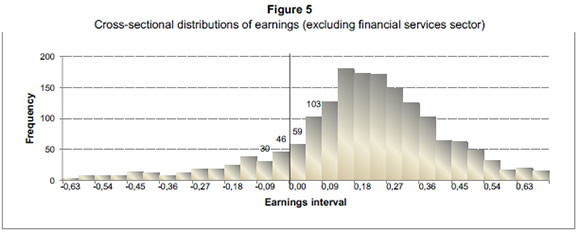
Empirical cross-sectional distributions of annual profit attributable to ordinary shareholders (McGregor BFA #101), scaled by beginning of the year book value of common equity (McGregor BFA #007 or #001), for financial years 2003 to 2011 (excluding companies in the financial services sector). The distribution interval widths are 0.045 and the solid line marks the location of zero on the horizontal axis. With an interval width of 0.045, the first interval to the right of zero contains all the observations in the interval [0.000, 0.045], the interval to the left of zero contains all the observations in the interval [-0.045, 0.000]. The vertical axis labelled frequency represents the number of observations in each earnings interval.
Empirical distributions of changes in annual profit attributable to ordinary shareholders (McGregor BFA #101) scaled by the book value of common equity (McGregor BFA #007 or #001) as at the beginning of the first year, for financial years 2004 to 2011, (excluding companies in the financial services sector). The distribution interval widths are 0.034 and the solid line marks the location of zero on the horizontal axis. With an interval width of 0.034, the first interval to the right of zero contains all the observations in the interval [0.000, 0.034], the interval to the left of zero contains all the observations in the interval [-0.034, 0.000]. The vertical axis labelled frequency represents the number of observations in each change in earnings interval.
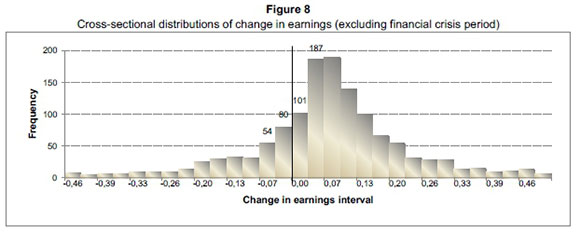
Exclusion of the global financial crisis period
To give rigour to the analysis, we excluded the observations for financial years ending 2008 and 2009 (global financial crisis period) from the sample, as it may have been more acceptable in those years to report losses. Figure 7 and Figure 8 present the histograms for earnings and change in earnings respectively, after excluding the financial crisis period. Figure 7 reveals an emphasis on the discontinuity of earnings around zero in comparison with Figure 3. However, these results are not sufficient to infer earnings management. The distribution pattern in Figure 8 is fairly similar to that in Figure 4.
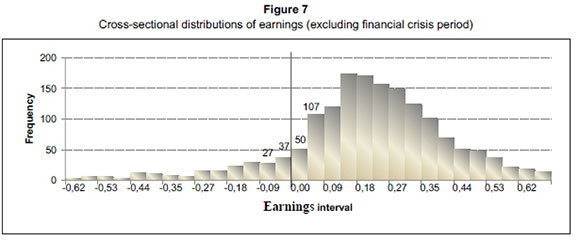
Empirical distributions of annual profit attributable to ordinary shareholders (McGregor BFA #101), excluding the observations for financial years ending 2008 and 2009 (global financial crisis years), scaled by beginning of the year book value of common equity (McGregor BFA #007 or #001). The distribution interval widths are 0.044 and the location of zero on the horizontal axis is marked by the solid line. With an interval width of 0.044, the first interval to the right of zero contains all the observations in the interval [0.000, 0.044], while the interval to the left of zero contains all the observations in the interval [-0.044, 0.000]. The vertical axis labelled frequency represents the number of observations in each earnings interval.
Empirical distributions of changes in annual profit attributable to ordinary shareholders (McGregor BFA #101), excluding the observations for the financial years ending 2008 and 2009 (global financial crisis years), scaled by the book value of common equity (McGregor BFA #007 or #001) as at the beginning of the first year. The distribution interval widths are 0.033 and the location of zero on the horizontal axis is marked by the solid line. With an interval width of 0.033, the first interval to the right of zero contains all the observations in the interval [0.000, 0.033], while the interval to the left of zero contains all the observations in the interval [-0.033, 0.000]. The vertical axis labelled frequency represents the number of observations in each change in earnings interval.
5 Conclusion
The purpose of this study was to determine whether companies listed on the JSE report earnings that have been managed upwards in order to avoid reporting earnings decreases and losses. The graphical presentations show that the earnings and changes in earnings of companies listed on the JSE are not abnormally distributed. The histograms further confirm that the distribution of the earnings is more consistent with the natural pattern expected for profit-orientated companies. In contrast with results by Burgstahler and Dichev (1997b), the results did not reveal a discontinuity in the earnings and change in earnings for the interval to the immediate left of zero. The significantly smaller size of the JSE may be a possible reason for this; with a much lower investor following, there is less fixation on earnings. It is, however, possible that analysts and investors in SA pay particular attention to other performance indicators, such as revenue and headline earnings per share (which is regulatory disclosure requirement unique to SA). The difference may also be attributable to the crucial strides that have been made globally in corporate governance consciousness since the dawn of the major accounting scandals (Alleyne, Weekes-Marshall & Broome, 2014). Lastly, within the research design, the earnings and change in earnings variables have not been adjusted for the asymmetric effects of negative special items and the applicable effective tax rates for profit and loss companies, owing to data constraints. These may possibly, though not significantly, affect the curve in the distribution of earnings and change in earnings (Beaver et al., 2007) and is a possible limitation of this study.
Earnings management generally converts losses into profits (or vice versa), triggers bonuses, or crosses performance thresholds for other covenants, which should be important to regulators (Sun & Rath, 2010). The results of this study are useful to the JSE and other regulatory bodies involved in the development and monitoring of policy, such as SAICA and the IASB, who are key decision-makers in the standard-setting process. Secondly, the results of this study will be useful to shareholders, investors and creditors, as they are the primary carriers of financial risk when compared to other stakeholders (IASB, 2010). It would be useful to extend this study to smaller companies that are not listed on the JSE, but which are key drivers of the South African economy. Such companies are generally in the initial growth stages, and have incentives and challenges that are different from those of larger listed companies. Further, this study does not address the various earnings management techniques in the South African context; future research would be useful in exploring this area.
The results of this study suggest that the discontinuity in earnings distributions may not necessarily be prevalent in SA. The results pose a question regarding the value relevance of accounting information in South Africa's financial systems, as managers may not necessarily be fixated on earnings figures. The results also echo the arguments by Ball, Kothari and Robin (2000), who suggest that the role of accounting information is limited in countries with low investor protection. Furthermore, the results pose a question about the research design testing for earnings management by analysing cross-sectional distribution properties of earnings. Guttman, Kadan and Kandel (2006) found that discontinuities in the distribution of earnings may emerge endogenously, driven by forces that are less obvious than share-based payments. This suggests that a true (absence of earnings management) distribution of earnings will not necessarily be identical and normal for all economic environments, and, therefore, the process of identifying earnings management could be different for the respective environments. Consequently, we suggest future research into the distribution properties of earnings and change in earnings in South Africa and other developing markets, specifically examining the location, size and probability of the discontinuity in the distribution of reported earnings.
References
ALLEYNE, P., WEEKES-MARSHALL, D. & BROOME, T. 2014. Accountants' perceptions of corporate governance in public limited liability companies in an emerging economy: Evidence from Barbados. Meditari Accountancy Research, 22(2): 186-210. [ Links ]
BALL, R. & BROWN, P. 1968. An empirical evaluation of accounting numbers. Journal of Accounting Research, Autumn:159-178. [ Links ]
BALL, R., KOTHARI, S.P. & ROBIN, A. 2000. The effect of international institutional factors on properties of accounting earnings. Journal of Accounting and Economics, 29(1): 1-51. [ Links ]
BARTH, M.E., ELLIOT, J. & FINN, M. 1999. Market rewards associated with patterns of increasing earnings. Journal of Accounting Research, 37(2):387-413. [ Links ]
BARTH, M.E., KONCHITCHKI, Y. & LANDSMAN, W.R. 2013. Cost of capital and earnings transparency. Journal of Accounting and Economics, 55:206-224. [ Links ]
BARTH, M.E., LANDSMAN, W.R. & LANG, H.L. 2008. International accounting standards and accounting quality. Journal of Accounting Research, 46(3):467-498. [ Links ]
BARTOV, E., GIVOLY, D. & HAYN, C. 2002. The rewards to meeting or beating earnings expectations. Journal of Accounting and Economics, 33:173-204. [ Links ]
BEATTY, A.L., KE, B. & PETRONI, K.R. 2002. Earnings management to avoid earnings declines across publicly and privately held banks. The Accounting Review, 77(3):547-570. [ Links ]
BEAVER, W.H. 1968. The information content of annual earnings announcements. Empirical research in accounting: selected studies, pp. 67-92. [ Links ]
BEAVER, W.H., MCNICHOLS, M.F. & NELSON, K.K. 2007. An alternative interpretation of the discontinuity in earnings distributions. Review of Accounting Studies, 12(4):525-556. [ Links ]
BHATTACHARYA, N., ECKER, F., OLSSON, P.M. & SCHIPPER, K. 2012. Direct and mediated associations among earnings quality, information asymmetry, and the cost of equity. The Accounting Review, 87(2):449-482. [ Links ]
BURGSTAHLER, D. & DICHEV, I. 1997a. Earnings, adaptation and equity value. The Accounting Review, 72(2):187-215. [ Links ]
BURGSTAHLER, D. & DICHEV, I. 1997b. Earnings management to avoid earnings decreases and losses. Journal of Accounting and Economics, 24:99-126. [ Links ]
BURGSTAHLER, D. & EAMES, M. 2006. Management of earnings and analysts' forecasts to achieve Zero and small positive earnings surprises. Journal of Business Finance and Accounting, 33(5) & (6):633-652. [ Links ]
CAYLOR, M.L. 2010. Strategic revenue recognition to achieve earnings benchmarks. Journal of Accounting and Public Policy, 29(1):82-95. [ Links ]
CHEN, J.J. & ZHANG, H. 2014. The impact of the corporate governance code on earnings management -Evidence from Chinese listed companies. European Financial Management, 20(3):596-632. [ Links ]
COHEN, D.A. & ZAROWIN, P. 2010. Accruals-based and real earnings management activities around seasoned equity offerings. Journal of Accounting and Economics, 50:2-19. [ Links ]
DEANGELO, H., DEANGELO, L. & SKINNER, D.J. 1996. Reversal of fortune: Dividend signaling and the disappearance of sustained earnings growth. Journal of Financial Economics, 40:341-371. [ Links ]
DECHOW, P.M., RICHARDSON, S.A. & TUNA, I. 2003. Why are earnings kinky? An examination of the earnings management explanation. Review of Accounting Studies, 8:355-384. [ Links ]
DECHOW, P.M., SLOAN, R.G. & ZHA, J. 2014. Stock prices and earnings: A history of research. Annual Review of Financial Economics, 6:343-363. [ Links ]
DEGEORGE, F., PATEL, J. & ZECKHAUSER, R. 1999. Earnings management to exceed thresholds. The Journal of Business, 72(1):1-33. [ Links ]
DURTSCHI, C. & EASTON, P. 2005. Earnings management? The shapes of the frequency distributions of earnings metrics are not evidence ipso facto. Journal of Accounting Research, 43(4):557-592. [ Links ]
DYRENG, S.D., HANLON, M. & MAYDEW E.L. 2012. Where do firms manage earnings? Review of Accounting Studies, 17(3):649-687. [ Links ]
EBAID, I.E. 2012. Earnings management to meet or beat earnings thresholds: Evidence from the emerging capital market of Egypt. African Journal of Economic and Management Studies, 3(2):240-257. [ Links ]
GILLIAM, T.A., HEFLIN, F. & PATERSON, J.S. 2014. Evidence that the zero-earnings discontinuity has disappeared. Journal of Accounting and Economics. Available at: http://dx.doi.org/10.1016/jjacceco.2014.07.001. [ Links ]
GRAHAM, J.R., HARVEY, R. & RAJGOPAL, S. 2005. The economic implications of corporate financial reporting. Journal of Accounting and Economics, 40: 3-73. [ Links ]
GUTTMAN, I., KADAN, O. & KANDEL, E. 2006. A rational expectations theory of kinks in financial reporting. The Accounting Review, 81(4):811-848. [ Links ]
HAY, D. 2015. The frontiers of auditing research. Meditari Accountancy Research, 23(2):158-174. [ Links ]
HAYN, C. 1995. The information content of losses. Journal of Accounting and Economics, 20:125-153. [ Links ]
HEALY, P.M. & WAHLEN, J.M. 1999. A review of the earnings management literature and its implications for standard setting. Accounting Horizons, 13(4):365-383. [ Links ]
HICKS, J. 1939. Value and capital. UK: Oxford University Press. [ Links ]
INTERNATIONAL ACCOUNTING STANDARDS BOARD (IASB). 2010. The Conceptual framework for financial reporting. International Financial Reporting Standards. [ Links ]
JONES, J.J. 1991. Earnings management during import relief investigations. Journal of Accounting Research, 29:193-228. [ Links ]
KAHNEMAN, D. & TVERSKY, A. 1979. Prospect theory: An analysis of decision under risk. Econometrica, 47(2):263-292. [ Links ]
KASZNIK, R. & MCNICHOLS, M.F. 2002. Does meeting earnings expectations matter? Evidence from analyst forecast revisions and share prices. Journal of Accounting Research, 40(3):727-759. [ Links ]
KINNEY, W., BURGSTAHLER, D. & MARTIN, R. 2002. Earnings surprise "materiality" as measured by stock returns. Journal of Accounting Research, 40(5):1297-1329. [ Links ]
KOH, K., MATSUMOTO, D.A. & RAJGOPAL, S. 2008. Meeting or beating analyst expectations in the post-scandal world: Changes in stock market rewards and managerial actions. Contemporary Accounting Research, 25(4):1067-1098. [ Links ]
LA PORTA, R., LOPEZ-DE-SILANES, F., SHLEIFER, A. & VISHNY, R. 1998. Law and finance. Journal of Political Economy, 106:1113-1155. [ Links ]
LEUZ, C., NANDA, D. & WYSOCKI, P.D. 2003. Earnings management and investor protection: An international comparison. Journal of Financial Economics, 69 505-527. [ Links ]
LIN, F. & WU, S. 2014. Comparison of cosmetic earnings management for the developed markets and emerging markets: Some empirical evidence from the United States and Taiwan. Economic Modelling, 36: 466-473. [ Links ]
McNICHOLS, M.F. 2000. Research design issues in earnings management studies. Journal of Accounting and Public Policy, 19:313-345. [ Links ]
McNICHOLS, M. & WILSON, P. 1988. Evidence of earnings management from provision for bad debts. Journal of Accounting Research, 26 (Supplement):1-31. [ Links ]
MEY, E. & DE KLERK, M. 2015. Association between having a CA (SA) as CEO and accruals quality. Meditari Accountancy Research, 23(3):276-295. [ Links ]
MILLER, M.H. & MODIGLIANI, F. 1961. Dividend policy, growth, and the valuation of shares. The Journal of Business, 34(4):411-433. [ Links ]
MYERS, J.N., MYERS, L.A. & SKINNER, D.J. 2007. Earnings momentum and earnings management. Journal of Accounting, Auditing and Finance, 22:249-284. [ Links ]
OHLSON, J.A. 1995. Earnings, book values and dividends in equity valuation. Contemporary Accounting Research, 11(2):661-687. [ Links ]
PELTONEN, T.A., SOUSA, R.M. & VANSTEENKISTE, I.S. 2012. Wealth effects in emerging market economies. International Review of Economics and Finance, 24:155-166. [ Links ]
PRATT, J. 2000. Financial accounting in an economic context. (4th ed.) Cincinnati, OH: South-Western College Publishing. [ Links ]
PRETORIUS, D. & DE VILLIERS, C. 2013. The effect of share-based payments on earnings per share of South African listed companies. Meditari Accountancy Research, 21(2):178-190. [ Links ]
ROSSOUW, J. 2010. Empirical results of the accounting policies chosen by South African listed companies. Meditari Accountancy Research, 18(2):38-56. [ Links ]
ROYCHOWDHURY, S. 2006. Earnings management through real activities manipulation. Journal of Accounting and Economics, 42:335-370. [ Links ]
SAICA. 2004. Circular 7/2004. Available from: https://www.saica.co.za/documents/Circ7.pdf [accessed: Junie 2013]. [ Links ]
SCHIPPER, K. & VINCENT, L. 2003. Earnings quality. Accounting Horizons, 17:97-110. [ Links ]
SCOTT, D.W. 1992. Multivariate density estimation: Theory, practice and visualization. New York: Wiley. [ Links ]
SHEN, C. & CHIH, H. 2005. Investor protection, prospect theory and earnings management: An international comparison of the banking industry. Journal of Banking & Finance, 29:2675-2697. [ Links ]
SILVERMAN, B.W. 1986. Density estimation for statistics and data analysis. London: Chapman & Hall. [ Links ]
SKINNER, D.J. & SLOAN, R.G. 2002. Earnings surprises, growth expectations, and stock returns or Don't let an earnings torpedo sink your portfolio. Review of Accounting Studies, 7(2-3):289-312. [ Links ]
SUN, L. & RATH, S. 2010. Earnings management research: A review of contemporary research methods. Global Review of Accounting and Finance, 1(1):121-135. [ Links ]
XU, R.Z., TAYLOR, G.K. & DUGAN, M.T. 2007. Review of real earnings management literature. Journal of Accounting Literature, 26:195-228. [ Links ]
Accepted: August 2015

