


Services on Demand
Article
 English (pdf)
 Article in xml format
 Article references
Indicators

Related links
-
 Cited by Google
 -
 Similars in Google
Share

 Permalink
South African Journal of Economic and Management Sciences
On-line version ISSN 2222-3436
Print version ISSN 1015-8812
S. Afr. j. econ. manag. sci. vol.18 n.4 Pretoria 2015
http://dx.doi.org/10.17159/2222-3436/2015/V18N4Q7
ARTICLES
Financial indicators of company performance in different industries that affect CEO remuneration in South Africa
Mark BussinI; Chris BlairII
IDepartment of Industrial Psychology and People Management, University of Johannesburg
IISchool of Business Administration, University of Cumbria, UK
ABSTRACT
In an attempt to address the growing gap between chief executive officer (CEO) remuneration and that of the general worker, reign in rising CEO remuneration, and justify the portion of long-term incentive pay that makes up the bulk of CEO remuneration, shareholders and other stakeholders are trying to find definitive factors that will link CEO remuneration to company performance. Finding this link has become central to all executive remuneration issues. The results of the studies linking CEO remuneration to company performance are varied and inconclusive, particularly in South Africa. The reason for this is that previous studies have not looked at whether the company performance measures chosen have definite relationships with CEO remuneration in each industry. This study investigated eleven financial indicators of company performance to determine which of them have significant and positive relationships to CEO remuneration in different industries in South Africa. 254 South African listed companies, spread over 5 industries, were analysed for the period 2008 to 2012 using panel data analysis and statistical tests. The results were conclusive, finding performance metrics that had a positive and significant relationship to CEO remuneration in 4 of the 5 industries investigated, as well as over the aggregate of all the industries.
Key words: CEO compensation, remuneration, reward, pay-performance sensitivity, principle-agent theory, emerging markets, South Africa
1 Introduction
There is a growing perception that the remuneration of CEOs has become detached from the performance of the companies they manage (Bebchuk, 2009). As a result, regulators, employees, investors, the media and civil society are now closely scrutinising remuneration practices and considering the sustainability of company performance when making long-term investment decisions (Baltes, 2007).
Excessive and often unwarranted CEO remuneration increases have contributed to placing South Africa in the top 10 countries worldwide in terms of global inequality (Ortiz & Cummins, 2011). In order to address these issues of inequality, CEO remuneration needs to be linked to company performance. Much research has been done on the relationship between the determinants and the quantum of CEO remuneration, and numerous measures and codes have been put in place to try to redress this issue.
The Johannesburg Stock Exchange (JSE) developed its Socially Responsible Investment (SRI) index in 2004 which assesses companies across the triple bottom line as well as against specific governance criteria.
The King III codes on corporate governance were brought into effect in South Africa in 2010 (IODSA, 2009). The core philosophy of the King III codes revolves around leadership, sustainability and corporate citizenship. The code specifically states that:
"2.17.4. The Board should ensure that the role and function of the CEO is formalised and the performance of the CEO is evaluated against the criteria specified", and
"2.25.1. Companies should adopt remuneration policies aligned with the strategy of the company and linked to individual performance".
The Code for Responsible Investing in South Africa (CRISA) is a "stewardship code" detailing the responsibility of institutional shareholders to look after the interests of individual investors or policy holders (IODSA, 2011). It advocates that shareholders "should give appropriate consideration to any factor which may materially affect the sustainable long-term performance of a fund's assets, including factors of an environmental, social and governance character".
In spite of all these interventions and changing business practices, it can be argued that stakeholders have not been able to effectively measure company performance in relation to the increasing or decreasing value of the long-term portion of CEO remuneration over time.
A breakdown of CEO remuneration in 2013 shows that long-term incentives (LTI) pay makes up nearly half of the total CEO remuneration in South Africa (21st Century Pay Solutions Group, 2013).
If CEO remuneration is motivated through remuneration that is linked to the performance of the company then the CEO will act in the interests of the owners and will strive to maximise shareholder wealth (De Wet, 2012).
It is therefore imperative that LTIs should be directly linked to long term sustainability measures of company performance (IODSA, 2011). However, many remuneration committees and boards of companies do not know which company performance measures are appropriate for their industry.
Thus there is a strong need to determine which particular performance indicators in different industries affect CEO remuneration, so that the relationship between the CEO remuneration and the company performance may be measured reliably and based on defensible statistics.
This study determines:
- whether there is a statistically significant and positive correlation between long-term portion of CEO remuneration and company performance measures for different industries, and
- which financial indicators are most significant by industry for this correlation in South African companies.
- The paper covers the relevant literature research around CEO remuneration and the link to performance which is then linked to the research hypothesis and presented in statistical results. The study covers six broad industries and concrete conclusions are presented for each.
2 Literature review
2.1 CEO remuneration - definitions
CEO remuneration is made up of 3 components, namely, total guaranteed package (TGP), short-term incentive pay (STI) and long term incentive pay (LTI).
- Fixed pay /total guaranteed package (TGP):
All guaranteed components of remuneration, including base salary and benefits that typically accrue on a monthly basis (pension, medical, and car allowance among others). Fixed pay is influenced primarily by governance and company size (Bussin, 2012).
- Variable pay (also known as incentive pay):
The variable components of remuneration that accrue to an individual based on achievement of satisfactory measures of performance, consisting of:
- Short-term incentives (STIs):
All cash based payments that accrue to an individual based on company performance for a 12 month period
- Long-term incentives (LTIs):
All cash and equity based awards that accrue to an individual based on company performance over a period longer than 12 months (21st Century Pay Solutions Group, 2012).
It is widely accepted that the STI and LTI components of CEO remuneration are linked to company performance (Allcock, Filatotchev & Chahine, 2010; Cale, Jurow, Romana, Deasy, Haddick & Napierala, 2009; Choo & Francisco, 2004; The High Pay Commission, 2010; Gates, 2001).
2.2 The link between CEO remuneration and company performance
Since 1969, many people have researched the relationship between CEO remuneration its determinants. Cosh (1975) investigated over 1500 UK companies over a period of two years (1969 - 1971) to determine which factors where significant when determining CEO remuneration. He found that company size was a much greater determinant of CEO remuneration than company performance measures (such as share return, earnings per share or accounting returns). More recently however, Häsä (2013) studied executive remuneration determinants across 10 countries and 6 industries, and discovered that company size, governance and company performance accounted for only a small part of share-based executive remuneration. Theunissen and Oberholzer (2013) formulated a model to describe CEO remuneration for company size and performance. However, this study has limitations as return on equity (ROE) was used as the only measure of performance, and may not necessarily be the most appropriate measure to incentivise CEO remuneration in all these industries.
Zulfiqar, Shah, Javed and Abbas (2009) proposed a model where the determinants of CEO remuneration include: audit committee independence; shareholder activism, board size and independence; institutional ownership, ownership structure; ownership concentration; company performance and company size. They excluded geographical and cultural factors - which have been found to explain a large part of the CEO remuneration variances. For example, Salazar and Raggiunti (2013) found that lower CEO remuneration in Japan (versus the USA) does not result in poorer company performance and is in fact a necessity for local cultural conditions.
2.3 Industry and country-specific research on the link between CEO remuneration and company performance
Research results linking CEO remuneration and company performance differs across industry sectors and countries. In addition, different research findings support or refute the pay-performance relationship, making a definitive conclusion hard to reach. Several contrasting research studies are described below to demonstrate the varied nature of the findings.
2.3.1 Positive links
A Chinese study in the petroleum industry showed that there is a positive relationship between executive remuneration and company performance even though share-based pay is not used extensively (Hong-Bo, 2013). In Australia the CEO remuneration-performance relationship, based on the shareholder return measures of return on assets (ROA), return on equity (ROE) and earnings per share (EPS), has been strengthening since 1999 (Doucouliagos, Haman & Askary, 2007). A study of Australian companies in 2004 showed that the CEO remuneration-performance link is positive, statistically significant, and in line with other international findings in USA, UK and Canada (Merhebi, Pattenden, Swan & Zhou, 2006).
Supporting this evidence, Farmer, Archbold and Alexandrou (2013) analysed a panel of CEOs from 204 UK companies over a similar period - 2003 to 2007. They found that both basic pay and STI pay had a significant relationship with the FTSE 350 market performance, and that LTI pay was linked to the 3-year FTSE 350 industry sector performance (it must be noted that in this study they did not attempt to link each company's performance to the remuneration of its CEO). Another study of UK company panel data (1999-2005) showed a direct positive relationship between shareholder returns and CEO remuneration (Ozkan, 2011).
Extensive studies undertaken in Canada and the USA have also shown a positive link between CEO remuneration and performance. 1 397 companies in the USA were studied from 1999-2006 by Manders (2012) who found that there was a strong and positive relationship between company performance and the percentage of equity-based CEO compensation. Zhou (2010) examined 755 Canadian companies (over the period 1991 to 1995), and concluded that CEO remuneration is tied to company performance. Sheikh (2008) found a positive relationship between return on equity (ROE) and total shareholder returns (TSR) in US companies over the period 1992-2005.
Studies investigating the role between CEO remuneration and company performance have also been conducted in South Africa. Shaw (2011) found that in the South African financial sector, company performance and CEO remuneration display a favourable, positive relationship with each other. Van Blerck (2012) also found a strong, positive relationship between CEO remuneration and the South African financial sector's company performance metric, Economic Value Added (EVA).
2.3.2 Negative links
An industry-specific study by Reiter, Sandoval, Brown and Pink (2009) found no relationship between CEO remuneration and the three most commonly used financial measures of performance in the hospital sector - unit cost, margins and current ratio. A study on listed Chinese logistics companies also demonstrated no linear relationship between executive remuneration and company performance when using EPS and ROE as performance metrics (Fang, Ya-xuan & Hui, 2013).
A 2010 study, specific to the UK financial sector, found no positive relationship between CEO remuneration and company performance (Shiwakoti, 2012). A study conducted by Cooper, Gulen and Rau (2009) indicated that over a period of time, long-term incentive pay does not necessarily result in higher stock price. Laux and Laux (2009) also found that an increase in CEO remuneration does not necessarily increase earnings management for US listed companies.
In Brazil a study by Krauter and de Sousa (2013) showed that, for the period 2006 - 2007, there was not a significant relationship between executive compensation and corporate financial performance of sales growth and ROE. Bradley (2011) performed a study, over a period of 5 years, on the largest 40 companies on the Johannesburg Stock Exchange and found that there was no relationship between CEO remuneration and return on equity (ROE), return on assets (ROA) and earnings per share (EPS).
It is clear that research conducted to support the link of CEO remuneration to company performance metrics is not definitive, and that the results vary depending on the country, industry sector, and the selected performance metrics. The research conducted in South Africa (Van Blerk, 2012; Shaw, 2011; Bradley 2011) shows a similar trend of varied results.
Very few studies have focused on using an accurate and accepted methodology to value the long-term component of CEO remuneration and determine the link to company performance. In addition, most studies did not check for serial correlation, joint significance and causality in the relationship.
In almost all of the studies, the measurement of CEO remuneration used actual CEO remuneration rather than the expected long term component of the CEO remuneration based on company performance. The actual payouts to executives may not coincide with the expected value, as the CEO can decide when to receive the payouts after they become payable to him/her. For example, a CEO may have shares allocated to him in 2008 that vest (payout) in 2011 to the value of $1 million. He may opt to only cash them in 2016 (five years later) and this amount would be reported as remuneration to the CEO in that year. The company performance may have been good in 2011 (when the vesting occurred) whilst it may be poor in 2016 when the payout actually occurred. This would then result in a poor pay to performance link. This confirms the conclusion that the tenuous relationship between CEO remuneration and company performance is a function of how the CEO remuneration is measured rather than the relationship itself (Farmer, 2008).
Black Scholes is a sound, thorough methodology that overcomes this issue as it values the expected long-term value of a share based allocation at its future vesting or payout points. The studies that used this methodology are limited to that by Essopp (2013) and Lilling (2006). Both these studies found a positive and significant relationship between CEO remuneration and company performance.
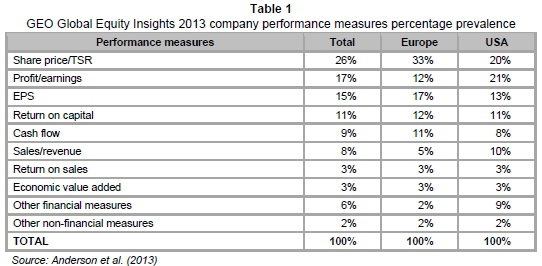
2.4 Measures of company performance
The GEO Global Equity Insights (2013) study focused on the prevalence of measures of company performance in 133 companies across 13 countries and 10 industries. The results of this study are presented in Table 1 below (Anderson, Gohm & Kramarsch, 2013).
Ernst & Young's (2013) survey results on Remuneration governance in South Africa (Table 2) describe remuneration trends for the previous year. The key indicators of performance are an aggregate for all industries and are similar for both short-term and long-term incentives. This means that the link to CEO remuneration may be tenuous when aggregate indicators are used.
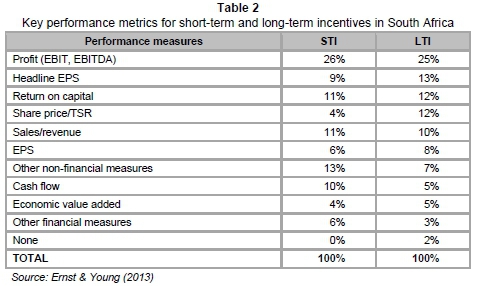
This study identifies key indicators that have a strong relationship with CEO remuneration for a particular industry.
3 Research hypotheses
The following research hypotheses were made:
Hypothesis 1: There is a statistically significant correlation between LTI CEO remuneration and company performance measures for different industries;
Hypothesis 2: The financial indicators differ by industry for the statistically significant correlation between LTI CEO remuneration and company performance measures.
It is proposed that the validity of these hypotheses will help to describe the relationship between CEO remuneration and company performance in different South African industries.
These hypotheses may imply that the principle-agent theory (Agency theory) is more effective in certain industries than others. Agency theory is however the most widely accepted and relevant theory to describe the CEO remuneration link to performance.
Agency theory
Currently there are eleven accepted theories explaining the determination of CEO remuneration.
Five of these theories are linked to company performance and rely on Agency theory for justification (Berle & Gardiner, 1932).
Agency theory postulates that the separation of ownership and control leads to two distinct sets of factors in the organisation; the principle (or shareholder), and the agent (who acts as a manager for the principle - in this case, the CEO). The literature notes that agents consistently act in a manner that promotes self-interest and are said to be 'rent seeking', claiming greater pay while working less. Clearly this arrangement will not satisfy the principle's desire for profit maximisation (O'Reilly & Main, 2010). The principle-agent conflict is further exacerbated by the fact that the various actors experience differing levels of risk.
It is unlikely that the CEO will ever experience the same risk as shareholders without pledging his or her own capital, and shareholders typically employ agents so that they can focus on running the business from a pragmatic perspective, free of the emotional burden that investor risk creates (O'Reilly & Main, 2010).
The Efficiency Wage theory (Stiglitz, 1981) states that CEOs are paid premiums (incentive pay) for improved productivity which, in turn, pays for the incentives.
The Marginal Productivity theory postulates that the CEO should receive compensation based on value-add and that monitoring of CEO performance is related asymptotically to company performance (Gomez-Mejia, Balkin & Cardy, 1995).
Tournament theory (Lazear & Rosen, 1981) describes tournament type behaviour - where if the gap in pay to the next level is big enough and the employee believes that they can get promoted, they are motivated to work hard to get the promotion, and there is a resulting performance increase (Kubo & Saito, 2008).
The Pay Compression hypothesis (Lazear, 1989) describes the theory where the pay difference between employees may be smaller than the productivity difference - thus leading to higher performance.
4 Research design and objectives
The research methodology used quantitative and empirical analytical research to establish the relationship of the hypotheses. A longitudinal study was used to determine the key components of each company's CEO remuneration and performance, and measure the relationships between CEO remuneration and metrics of company performance for each full financial year for the period 2003-2012.
The research design provided a comprehensive framework using:
• the quantitative approach (using regression and ordinary least squares (OLS) analysis (Strathclyde University, 2014) to determine the statistically significant correlation between CEO remuneration and measures of company performance;
• time series analysis and panel data regression (Baltagi, 2008) to determine the suitability of the performance measures for CEO's by industry or the extent to which they are applicable;
• the development of descriptive trends in the longitudinal data to identify any observations.
The data set used in this analysis consisted of the entire remuneration database from all 254 JSE listed companies for the period 2008 to 2012. The sample group changes from year to year but in all years, companies that were present in every year of the complete sample group were used. No sampling within this group occurred. The data was obtained from a private company called McGregor BFA that captures statistics from all listed South African companies' annual financial and remuneration reports.
The LTI portion of CEO remuneration is used as the dependent variable. Essop (2013) made use of a similar methodology, using a Black Scholes model to calculate the value of the share options available to each executive. The chief difference in this analysis however, is that the LTI is used as the focus (dependent variable) in this study whereas Essop (2013) used the LTI as a component of total earnings. The importance of this is that the pay-performance link should not be diluted by fixed pay.
In order to calculate the company volatilities for the Black Scholes evaluation of the long-term portion of the CEO remuneration for the years 2008-2012, the data for the preceding 5 years was also required (2003-2007). Using company volatilities distinguishes this study from previous studies that used industry volatilities (Essop, 2013; Lilling, 2006).
The long-term portion of CEO remuneration is the CEO's expected annualised value of the LTI scheme after a specified number of years (in this case, after 3 years). This value is determined using a Black Scholes model, making use of the actual volatility of each company's share price over the 5 years leading up to the year in which the long-term portion of CEO remuneration was calculated.
The value of a call option (based on the original Black Scholes model) has been described as a function of five parameters (Chriss, 1997):
CB-S = f(S,52,X,T,rf)
S = the price of the underlying asset (in this project the underlying asset is stock)
δ2 = the instantaneous variance of the asset returns (share price volatility)
X = the exercise price
T = the time to vesting in days
rf= the Risk Free Rate
The following assumptions have been used in developing valuation models for options (Chriss, 1997):
1) The rate of return on the stock follows a lognormal distribution. This means that the logarithm of 1 plus the rate of return follows the normal, or bell-shaped, curve. (The assumption ensures continuous trading - the stock rate of return distribution is continuous.)
2) The risk-free rate and variance of the return on the stock are constant throughout the option's life. (The two variables are non-stochastic.)
3) There are no taxes or transaction costs.
4) The stock pays no dividends. (This assumption ensures no jumps in the stock price. It is well known that the stock price falls by approximately the amount of the dividend on the ex-dividend date.)
5) The calls are European, which does not allow for early exercise.
LTI data shows full value shares or share appreciation units with a strike price. When exploring the possible model specifications detailed in Equations 1 to 3, Essop's research (2013) was used as the benchmark model, yielding an attractive result (which was also cited by Bradley (2011) showing that dummy variables for industry were significant in the models and that industry had a role to play in determining executive remuneration.
This analysis focuses only on CEOs (rather than on all executives) and attempts rather to find which performance variables are most relevant in each industry. Essop (2013) did not apply a time lag to the performance variables being analysed, whereas Bradley (2011) included a time lag in the performance variable. Intuitively, Bradley's view makes more sense, as one would expect this year's share based incentive allocations to be based on last year's performance.
When analysing variable pay, Bradley (2011) makes use of actual payout data. This type of analysis can be quite misleading if one is searching for a link between pay and performance, as these shares may have vested 10 years ago and are only now being paid out. This analysis therefore follows Essop's (2013) methodology (using a Black Scholes model to calculate the realisable LTI value of a CEO's shares) which is far more appropriate when researching a link between remuneration and performance.
Three equations were postulated, based on variables where a relationship between different performance measures and the long-term portion of CEO remuneration (lagged by one year), was found to be present in previous studies. Additional variables were considered but were excluded if there was no relationship present.
Since each of the six industries was heterogeneous, these three equations were tested in order to allow for differences across the model specification in each industry.
The three equations used were as follows:
Equation 1:
LONG-TERM PORTION OF CEO REMUNERATION = Cit + PERFORMANCEit(-1) + TGPit + INDUSTRY_GDP_GROWTHit + TURNOVERit + SHARE_PRICEit
Equation 2:
LONG-TERM PORTION OF CEO REMUNERATIONit= Cit+ PERFORMANCEit(-1) + INDUSTRY_GDP_GROWTHit + TURNOVERit + SHARE_PRICEit
Equation 3:
LONG-TERM PORTION OF CEO REMUNERATION = Cit + PERFORMANCEit(-1) + TGPit + TURNOVERit + SHARE_PRICEit
The performance variables tested in each industry are as follows:
Capital Employed, Change in Capital Employed, Change in Fixed Assets, Change in Turnover, Dividend per Share, EBITDA, Fixed Assets, Headline EPS, Profits After Interest Tax, Profits After Interest Tax, Share Price Change and Total Shareholder Return.
Both accounting-based and market-based measures have been used in order to measure company performance in this analysis. These are the most common performance variables featured in the Remuneration governance in South Africa survey by Ernst & Young (2013).
The four control variables used in the models (all of which are used in Equation 1) were included to control the model for external effects.
It could be questioned why the model utilises share price data, and not share return data. The shareholder will value both their return on investment and the performance of the company relative to the market. For example, share price increases of say 20 per cent in one year might appear good but if the market or industry average increase was 30 per cent, then it is clear that the CEO has actually performed poorly. In this study we have accommodated the change in share price (return) over the five year period in addition to looking at share returns (including dividend per share). We have also controlled for industry effects (relative to industry average returns) by using industry GDP growth as a control variable.
Once the result of each equation for each industry had been generated, each industry's output was analysed. Interpretation was made based on six specific criteria.
1) Firstly, we expected that if there was a relationship between the long-term portion of CEO remuneration and company performance, that the relationship would be positive. If the relationship was positive, we tested for significance at a 5 per cent level (p-value < 0.05).
2) We then tested for serial correlation (the correlation of a time series with its own past and future values) using the Durbin-Watson test statistic and the Durbin-Watson statistical tables. These tests were performed using a 5 per cent level of significance.
3) We tested whether the model variables were jointly significant in determining the dependent variable (LTI portion of CEO remuneration). The F-statistic was used to determine this, with a p-value < 0.05 stating that the independent variables (company performance metrics) were jointly significant in determining the value of the LTI portion of CEO remuneration.
4) Having determined these positive relationships, we then tested whether a large part of the variation in the dependent variables was explained by the independent variables (company performance metrics), as well as by the four control variables TGP, turnover and share price. We did this using the adjusted R-squared value.
5) Finally, we tested whether pairwise Granger causality existed between the long-term portion of CEO remuneration and the performance variable.
6) The industries which were analysed have been grouped into six categories as depicted in appendix 1.
Social Services as an industry was omitted from the study as insufficient data were available.
5 Results and discussion
Each industry analysis contains 4 tables, each tabling a set of results for one of the equations plus the causality test. The test is stated on the Y axis and the performance metric tested is stated on the X axis.
The results are colour coded:
- A grey background indicates a positive result - i.e., it contains information which supports the argument that there is a relationship between long-term portion of CEO remuneration and that particular performance metric.
- A black background indicates an inconclusive result.
- A negative result contains no shading.
An inconclusive Durbin-Watson test statistic for an equation means that a serial correlation cannot be proved or disproved.
The national industry is presented and discussed in detail whilst the other industries' conclusive results are presented and discussed.
5.1 National industry
In equations 1, 2 and 3 (Tables 3, 4 and 5, respectively), Profits After Interest and Tax and Earnings Before Interest, Tax, Depreciation and Amortisation (EBITDA) are the only two independent variables (company performance metrics) which display a consistently positive and significant relationship with the dependent variable (LTI portion of CEO remuneration). In Equation 1 (Table 3), these relationships are highly significant at more than a 1 per cent level. There is also joint significance of the independent variables at a national level.


In Equation 2 (Table 4), capital employed and fixed assets also have a positive and significant relationship with LTI the portion of CEO remuneration. However, there is serial correlation across all performance metrics. When coupled with the low adjusted R-square values, this suggests that this is not a good model for determining the LTI portion of CEO remuneration at national level.
When using Equation 1 (Table 3), the Durbin-Watson test indicates that there is no serial correlation between Profits after Interest and Tax and the LTI portion of CEO remuneration. However, we cannot disprove, or prove, serial correlation between Earnings before Interest, Tax, Depreciation and Amortisation (EBITDA) and the LTI portion of CEO remuneration when using Equation 1 (Table 3), as the Durbin-Watson test result is inconclusive.
In Equation 3 (Table 5) there is no serial correlation between any of the independent variables (company performance metrics) and the LTI portion of CEO remuneration, apart from EBITDA. In this instance, the Durbin-Watson test was inconclusive and therefore we cannot prove or disprove the presence of serial correlation.
In equations 1 and 3 (Tables 3 and 5, respectively), the adjusted R-square value is within the same range (0.34 to 0.37). This result is to be expected at a national level, and explains between 34 per cent and 37 per cent of the variation in the LTI portion of CEO remuneration. For the purpose of analysing CEO remuneration by industry however, a figure greater than 50 per cent is expected for a positive result as this will prove a more direct link exists.
Table 6 illustrates that Capital Employed, Earnings Before Interest, Tax, Depreciation and Amortisation, Fixed Assets, Headline Earnings per Share and Profits after Interest and Tax all have Granger causal relationships with the LTI portion of CEO remuneration. This implies that by viewing the previous year's value of Earnings Before Interest, Tax, Depreciation and Amortisation and/or Profits after Interest and Tax, one can make predictions about the LTI portion of CEO remuneration. Intuitively the reader may be surprised that there is no Granger causality between the LTI portion of CEO remuneration and the change in share price. The reason for this is as follows:

1) The majority of the shares are appreciation shares which means that if the scheme goes underwater they will not be paid out (the price is below the strike price at the time of vesting). Considering how volatile share prices were since 2008 this instability could disrupt the usual link one would expect to see if the JSE All Share was more stable.
2) Volatility is a large part of determining a Black Scholes value. High volatility has an upward bias in a Black Scholes model which could explain why the share price and LTI value moved at different rates.
3) A problem may arise that the Granger causality between two variables may be changed as the lag of a variable differs. This research used a one period lag on the performance metrics in each equation and therefore this has also been used in the Granger causality test. In other words, the test is checking if last year's share price has caused this year's realisable LTI value of CEO remuneration. The lack of Granger causality with the change in share price may be due to the structural stability of Granger causality.
This result concurs with previous studies (Hall & Liebman, 1997; Jensen & Murphy, 1990) which showed that the fortunes of CEOs are strongly related to the fortunes of the companies they manage - a 1 per cent increase in the firm's return will lead to an increase of $43 000 in CEO remuneration.
The result supports Agency theory that if CEO remuneration is motivated through agency costs (remuneration) with the performance of the company then the CEO will act in the interests of the owners and maximise shareholder wealth.
5.2 Extractive industry
Fixed Assets returned positive results for all tests when using equations 1, 2 and 3. This suggests that when ranking the eleven performance metrics tested, Fixed Assets is the most important company performance metric used to determine the LTI portion of CEO remuneration in the extractive industry. This is followed by Profits After Interest and Tax which is an important company performance metric when using equations 1 and 3, but has inconclusive serial correlation for Equation 2.
The extractive industry is highly capital-intensive and has large fixed assets. The combination of a profit measure and Fixed Assets as performance measures would deliver the return on the assets that shareholders would expect from the CEO and the business. This positive and strong correlation is supported by a study by Hong-Bo (2013) in the petroleum industry in China supporting Agency theory
5.3 Transformative industry
When ranking the eleven performance metrics tested, Earnings Before Interest, Tax, Depreciation and Amortisation (EBITDA) and Profits After Interest and Tax are the most important company performance metrics used to determine the LTI portion of CEO remuneration. However it must be noted that serial correlation is present for both of these company performance metrics when using all three equations.
The transformative industry is also highly capital-intensive and has large fixed assets. CEO remuneration is linked to company performance through a combination of a profit measure and Fixed Assets to deliver the return on the assets that shareholders would expect. Once again agency theory is supported through profit returns generated by the CEO that are linked to his/her remuneration through the long-term portion of pay (Doucouliagos, Haman & Askary, 2007; Kay, 2004)
5.4 Distributive industry
Capital Employed and Profits After Interest Tax are the most important company performance metrics used in determining the LTI portion of CEO remuneration although they display serial correlation.
It is no surprise that Capital Employed would be a key performance measure in this industry which revolves around infrastructure and investing in infrastructure. It is interesting to note that the profit is measured after interest. These businesses are often heavily geared because of the huge startup capital required and thus would need to take the interest burden into account as a performance measure. Bussin and Nel (2015), who found no discernible relationship between CEO remuneration and company performance, did not investigate Capital Employed as a possible performance variable.
The fact that the CEO has to deliver a return on capital employed by maximising profits (before and after tax) to increase his/her pay, supports the validity of using the Agency theory.
5.5 Producer services industry
This is the only industry that has failed to produce at least one Granger causal relationship. There is no clear evidence that any of the company performance metrics have a significant relationship with the LTI portion of CEO remuneration in the producer industry. This industry has high people costs and relatively low capital costs. A further study may look at including a 'people' performance measure (for example, the salary and wage cost) to test against. The most promising relationship exists between Change in Share Price and the LTI portion of CEO remuneration, supported by Gomez-Mejia and Tosi (1994) who concluded that CEO remuneration was linked to share price but not to any other company performance indicators. Agency theory is supported through the link to share price that should result in increased returns to shareholders and CEO remuneration over time.
5.6 Personal services industry
Capital Employed is the company performance metric which showed strong evidence of a robust relationship with the LTI portion of CEO remuneration followed by Change in Share Price. There are large capital costs to start up these businesses which would necessarily mean that Capital Employed is a good measure of performance. It is not unexpected that Change in Share Price is an important performance measure for the CEO's in this industry. These businesses are driven by their share price. They are high visibility end-user services, which means that their actions are constantly scrutinised by the public and their share price is continuously affected.
These results are supported by other studies done by Kay (2004), Sheikh (2008) and Sigler and Carolina (2011) who found that a shareholder return measure was strongly linked to CEO remuneration in support of Agency theory once again.
6 Conclusion
This study sought to determine whether there is a statistically significant and positive correlation between long-term portion of CEO remuneration and company performance measures for different industries and to determine which financial indicators are most significant by industry for this correlation in South African companies. The results of previous studies vary greatly, however, there appears to be consensus that there a positive relationship between CEO remuneration and company performance if shareholder return is used as a performance metric.
The link between CEO remuneration and other company performance measures appears be tenuous and inconclusive, with varied results around the world, but particularly in South Africa, where aggregate results have been used across all industries, and the performance metrics that have been used by industry may not be significant for that industry.
This study investigated the CEO remuneration-performance link by industry. Eleven performance metrics were tested across 5 industries. These metrics are reported routinely in the annual financial statements of South African companies according to International Accounting Standards (IAS). Hence this information is readily accessible, and the reporting on these company metrics is consistent and uniform.
At an industry consolidated level (national level - all industries), the profit performance variable shows the most significant relationship. This tells us that CEO remuneration is driven by profit in most profit making businesses. This is not surprising as this is the core reason for the existence of profit making business and we would expect CEO remuneration to be based on this in the long term. This is in line with Agency theory rather than managerial power theory and concurs with many similar studies done previously.
When we use the same methodology to investigate the relationship between performance measures and CEO remuneration at an Industry level, the following performance measures were found to have the most positive and significant relationship.

The results are not unexpected and support Agency theory in all cases as the CEO remuneration is linked to a shareholder return measure.
We have used a lag period of one year and found significant relationships. A further study could be conducted where the lag periods are altered to include greater periods e.g. 2, 3, 4, and 5 years to see whether a better fit can be found. The long-term portion of CEO remuneration may lag company performance by a longer period - the LTI performance measures for CEOs usually run over a period of 3 to 5 years. This study assumes that the CEO remuneration is positively and significantly linked to the company's performance in the year after the performance. In light of this, the panel data set would need to be extended to cover a period of at least 10 years. This could be a difficult task in South Africa since CEO remuneration disclosure has only been required since 2010.
The value of the research is that remuneration committees and boards in South Africa now have empirical evidence to both measure and set CEO company performance measures against indicators that are positive and significant to a particular industry. These measures align with the criteria set by King III currently, but could be considered to enhance the code in the next version of King IV.
In conclusion, it should be noted that no attempt has been made to discern whether the long-term performance measures are sustainable, and therefore appropriate. CEO remuneration may have an important relationship with certain performance metrics, but this study has not focused on whether these performance metrics are the desired metrics for longterm wealth creation and sustainability. A further study could be conducted to determine which company performance metrics stakeholders would like to be significantly linked to CEO remuneration in different industries.
References
21ST CENTURY PAY SOLUTIONS GROUP REMUNERATION DEFINITIONS. 2012. 21st century pay solutions group, Johannesburg, South Africa. [ Links ]
21ST CENTURY PAY SOLUTIONS GROUP (PTY) LTD, 2014. Century executive pay barometer detailing the periodfrom July 2013-December 2013. Johannesburg, South Africa. [ Links ]
ALLCOCK, D., FILATOTCHEV, I. & CHAHINE, S. 2010. Executive share ownership , experience and basic salaries : the influence on IPO share option schemes and performance. University of Huddersfield Repository. [ Links ]
ANDERSON, D., GOHM, B. & KRAMARSCH, M.H. 2013. GEO global equity insights 2013. Global Equity Organization, California. [ Links ]
BALTAGI, B.H. 2008, Econometric analysis of panel data (4th ed.) Wiley. Available at: http://www.amazon.com/Econometric-Analysis-Panel-Data-Baltagi/dp/0470518863 [accessed 2014-01-04]. [ Links ]
BALTES, J. & Quinn L. 2007. Leadership and the triple bottom line. Centre for Creative Leadership, North America. [ Links ]
BEBCHUK, L.A. 2009. Executive compensation and the financial crisis. Transatlantic Corporate Governance Conference, Washington DC. [ Links ]
BERLE, A.A. & GARDINER, C. 1932. Means, the modern corporation and private property. New York: Macmillan. [ Links ]
BRADLEY, S. 2011. Chief executive officer compensation and the effect on company performance in a South African context. Unpublished thesis. Rhodes University: Grahamstown. [ Links ]
BUSSIN, M. 2012. The remuneration handbook for Africa. Randburg: Knowres Publishing (Pty) Ltd. [ Links ]
BUSSIN, M. & NEL, M. 2015. Relationship between CEO remuneration and company financial performance in the South African retail and consumer goods sector', Acta Commercii, 15(1), Art. #240, 11 pages. Available at: http://dx.doi.org/10.4102/ac.v15i1.240. [ Links ]
CALE, T., JUROW, D., ROMANA, S., DEASY, J., HADDICK, W. & NAPIERALA, N. 2009. Executive compensation: How does pay influence decisions and governance? A white paper by the Sanford C. Bernstein & Co. New York. [ Links ]
CHRISS, N.A. 1997. Black-Scholes and beyond: Option pricing models. Chicago, USA: McGraw-Hill. [ Links ]
CHOO, F. & FRANCISCO, S. 2004. A structural equation modeling of CEO remuneration-performance relationships. The Journal of American Academy of Business, Cambridge, September: 116-125. [ Links ]
COOPER, M.J., GULEN, H. & RAU, P.R. 2009, Performance for pay? The relationship between CEO incentive compensation and future stock price performance. Available at: http://poole.ncsu.edu/documents/CEOPerformanceforPay_0710.pdf [accessed 2014-03-18]. [ Links ]
COSH, A. 1975. The remuneration of chief executives in the United Kingdom. Economic Journal, 85:75-94. [ Links ]
DE WET, J. 2012. Executive compensation and the EVA and MVA performance of South African listed companies. Unpublished thesis, University of Pretoria, South Africa. [ Links ]
DOUCOULIAGOS, H., HAMAN, J. & ASKARY, S. 2007. Directors' remuneration and performance in Australian banking. Corporate Governance: An International Review, 15(6):1363-1383. [ Links ]
ERNST & YOUNG. 2013. Remuneration governance in South Africa: 2013 survey results: Remuneration committees under pressure. Available at: http://www.ey.com/Publication/vwLUAssets/Remuneration_Governance_in_South_Africa/$FILE/EY%202103%20Survey%20Remuneration%20Governance.pdf. [accessed 2014-01-12]. [ Links ]
ESSOP, Z. 2013. Firm performance as a determinant of executive compensation in South Africa. Unpublished thesis. University of Johannesburg, South Africa. [ Links ]
FANG, Z., YA-XUAN, W. & HUI, J. 2013. Corporate governance, performance and executive pay evidence from listed Chinese logistics companies. In 2013 International Conference on Management Science and Engineering 20th Annual Conference Proceedings (pp. 883-890). [ Links ]
FARMER, M. 2008. Chief executive compensation and company performance: A weak relationship or measurement weakness?. England, Faculty of Business and Law, Kingston University. [ Links ]
FARMER, M., ARCHBOLD, S. & ALEXANDROU, G. 2013. CEO compensation and relative company performance evaluation: UK evidence. Compensation & Benefits Review, 45(2):88-96. [ Links ]
GATES, D.S. 2001. Aligning strategic performance measures and results. The Conference Board, 1-32, Washington, DC. [ Links ]
GOMEZ-MEJIA, L.R., BALKIN, D.B. & CARDY, R.L. 1995. Managing human resources (6th ed.) New Jersey: Pearson Education. [ Links ]
GOMEZ-MEJIA, L.R. & TOSI jr, H.L. 1994. CEO compensation monitoring and firm performance. The Academy of Management Journal, 37(4):1002-1016. [ Links ]
HALL, B.J. & LIEBMAN, J.B. 1998. Are CEOs really paid like bureaucrats? The Quarterly Journal of Economic, 113(3):653-691. [ Links ]
HÃSÀ, A. 2013. International differences in executive compensation geographical and cultural analysis. Unpublished thesis. Aalto University, United States. [ Links ]
HONG-BO, Y. 2013. A study on the relationship between top executives' salaries and bonuses and corporate performance of listed petroleum companies. Journal of Southwest Petroleum University, 15(2):1-4. [ Links ]
IODSA. 2009. King code of governance for South Africa 2009. Available at: http://www.iodsa.co.za/?kingIII [accessed 2013-11-12]. [ Links ]
IODSA. 2011. Code for responsible investing in SA (CRISA). Available at: http://www.iodsa.co.za/?page=crisa&hhSearchTerms="crisa"&#rescol_1666949 [accessed 2013-11-12]. [ Links ]
JENSEN, M.C. & MURPHY, K. 1990. Performance pay and top management incentives. Journal of Political Economy, 2:225-265. [ Links ]
KAY, I.T. 2004. CEO remuneration for performance : The solution to "managerial power". Journal of Corporation Law, 30(4):785-789. [ Links ]
KRAUTER, E. & DE SOUSA, A.F. 2013. Executive compensation and corporate financial performance: Empirical evidences on Brazilian industrial companies. Journal of Modern Accounting and Auditing, 9(5): 650-661. [ Links ]
KUBO, K. & SAITO, T. 2008. The relationship between financial incentives for company presidents and firm performance in Japan. The Japanese Economic Review, 59(4):401-418. [ Links ]
LAUX, C. & LAUX, V. 2009. Board committees, CEO compansation and earnings management. The Accounting Review, 84(3):869-891. [ Links ]
Lazear, E. P. 1989. Pay equality and industrial politics. Journal of Political Economy, 97(3):561-80. [ Links ]
LAZEAR, E.P. & ROSEN, S. 1981. Rank-order tournaments as optimum labor contracts. NBER Working Paper 401. Available at: http://www.nber.org/papers/w0401.pdf [accessed 2013-11-12]. [ Links ]
LILLING, M.S. 2006. The link between CEO compensation and firm performance: does simultaneity matter? Atlantic Economic Journal, 34:101-114. [ Links ]
MANDERS, T. 2012. Executive compensation structure and company performance. Unpublisshed thesis. Tilburg University, Netherlands. [ Links ]
MERHEBI, R., PATTENDEN, K., SWAN, P.L. & ZHOU, X. 2006. Australian chief executive officer remuneration: Pay and performance. Accounting and Finance, 46(3):481-497. [ Links ]
O'REILLY, C.A. & MAIN, B.G. 2010. Economic and psychological perspectives on CEO compensation: A review and synthesis. Industrial and Corporate Change, 19(3):675-712. [ Links ]
ORTIZ, I. & CUMMINS, M. 2011. Beyond the bottom billion. A rapid review of income distribution in 141 countries. Unicef, Social and Economic Policy Working Paper. Available at: http://www.unicef.org/socialpolicy/files/Global_Inequality.pdf [accessed 2014-12-13]. [ Links ]
OZKAN, N. 2011. CEO compensation and firm performance: An empirical investigation of UK panel data. European Financial Management, 17(2):260-285. [ Links ]
REITER, K.L., SANDOVAL, G.A, BROWN, A.D. & PINK, G.H. 2009. CEO compensation and hospital financial performance. Medical Care Research and Review, 66(6):725-38. [ Links ]
SALAZAR, A. & RAGGIUNTI, J. 2013. Why does executive greed prevail in the United States and Canada but not in Japan? The pattern of low CEO remuneration and high worker welfare in Japanese corporations. SSRN Electronic Journal, XIX (January). [ Links ]
SHAW, P. 2011. CEO remuneration-performance sensitivity in South African financial services companies. Unpublished thesis. University of Pretoria, South Africa. [ Links ]
SHEIKH, A. 2008. CEO annual bonus plans: Do performance standards influence the association between pay and performance? Journal of American Academy of Business, 12(2):39. [ Links ]
SHIWAKOTI, R.K. 2012. Comparative analysis of determinants of executive remuneration in the UK financial services sector. Accounting and Finance, 52(1):13-235. [ Links ]
SIGLER, K.J. & CAROLINA, N. 2011. CEO compensation and company performance. Business and Economics Journal, 31:1-8. [ Links ]
STIGLITZ, J.E. 1981. Alternative theories of wage determination and unemployment: The efficiency wage theory. Discussion paper no. 95, Woodrow Wilson School, Princeton University, New Jersey. [ Links ]
STRATHCLYDE UNIVERSITY. 2014. Ordinary least squares method - University of Strathclyde. Humanities and Social Sciences. Available at: http://www.strath.ac.uk/aer/materials/4dataanalysisineducationalresearch/unit4/ordinaryleastsquaresmethod/ [accessed 2014-06-02]. [ Links ]
THE HIGH PAY COMMISSION, 2010. Cheques with balances : Why tackling high pay is in the national interest. The High Pay Commission. Available at: www.http://highpaycentre.org/files/Cheques_with_Balances.pdf [accessed 2014-03-20]. [ Links ]
THEUNISSEN, M. & OBERHOLZER, M. 2013. Analysis to benchmark CEO remuneration: A South African study. The Journal of Applied Business Research, 29(5):1509-1522. [ Links ]
VAN BLERCK, T.G. 2012. The relationship between executive remuneration at financial institutions and economic value added. Unpublished thesis. University of Pretoria, South Africa. [ Links ]
ZHOU, X. 2010. CEO remuneration , firm size , and corporate performance : Evidence from Canada. The Canadian Journal of Economics, 33(1):213-251. [ Links ]
ZULFIQAR, S., SHAH, A., JAVED, T. & ABBAS, M. 2009. Determinants of CEO compensation empirical evidence from Pakistani listed companies. International Research Journal of Finance and Economics, 32:148-159. [ Links ]
Accepted: May 2015
Appendix 1


