


Services on Demand
Article
 English (pdf)
 Article in xml format
 Article references
Indicators

Related links
-
 Cited by Google
 -
 Similars in Google
Share

 Permalink
South African Journal of Economic and Management Sciences
On-line version ISSN 2222-3436
Print version ISSN 1015-8812
S. Afr. j. econ. manag. sci. vol.18 n.4 Pretoria 2015
http://dx.doi.org/10.17159/2222-436/2015/V18N4A5
ARTICLES
Value relevance and corporate responsibility reporting in the South African context: An alternate view post King-III
Adrian MarciaI; Warren MarounI; Chris CallaghanII
ISchool of Accountancy, University of the Witwatersrand
IISchool of Economic and Business Science, University of the Witwatersrand
ABSTRACT
This study tests for the value relevance of corporate responsibility reporting (CRR) based on a sample of companies listed on the Johannesburg Stock Exchange (JSE). It also provides evidence of the statistical significance of the potential contribution of CRR to share price values in the South African context at a particular point. On the basis of a sample of 82 companies on the JSE, hierarchical regression analysis was used to test the contribution of levels of corporate social responsibility disclosures to company share prices, over and above the contribution of the size of a firm's equity and net income. In contrast with other findings which predict a positive relationship between company share price and levels of corporate social responsibility disclosures, the latter are found to have no significant association with company share price over and above the associations of the size of a firm's equity and net income. Bivariate associations, however, indicate a significant association between share price and levels of corporate social responsibility disclosures. On the basis of these findings, it is argued that disclosures increase for firms with larger endowments of equity, yet corporate social responsibility disclosures do not necessarily add value to company share price.
Key words: corporate responsibility reporting, Ohlson model, South Africa, value relevance
1 Introduction
From the perspective of stakeholder theory, CRR recognises the importance of providing more than just financial information for companies' shareholders (cf. De Meuse, Vanderheiden & Bergmann, 1994; Carroll & Shabana, 2010; Solomon, 2011). For organisations to be sustainable in the short, medium and long term, the general position is that effective disclosure of non-financial information is paramount (Institute of Directors in Southern Africa [IOD], 2009; Integrated Reporting Committee of South Africa [IRCSA], 2011; Solomon, 2011; Atkins & Maroun, 2015).
By providing a competitive advantage reducing risk levels or contributing to reputational benefits, effective CRR should positively contribute to the value of the particular organisation (Hassel, Nilsson & Nyquist, 2005; Carroll & Shabana, 2010; De Klerk & De Villiers, 2012). The result is that the last five years have seen a significant increase in the extent of CRR.
A survey by KPMG, for example, reports that 95 per cent of the world's 200 largest companies provide at least some disclosure on their corporate social responsibility activities and related governance issues (KPMG, 2011). Similarly, the number of sustainability reports being filed with the Global Reporting Initiative (GRI) has increased exponentially, with the United States of America (USA), China, Japan, Spain and South Africa boasting the highest number of GRI reports in 2012 (Hughen, Lulseged & Upton, 2014). These trends confirm the position taken by the International Integrated Reporting Council (IIRC) (2011; 2013), IOD (2009) and GRI (Hughen, Lilseged & Upton, 2014) that there is a clear business case for including non-financial information in annual or integrated reports (KPMG, 2008; IRCSA, 2011).
Nevertheless, market-based research on the value relevance of CRR has reported mixed results (cf. Hassel et al., 2005; Jones, Frost, Loftus & Van Der Laan, 2007). Furthermore, much of the prior research on CRR is based in the USA or Europe, making it difficult to draw conclusions on the importance (in financial terms) of CRR for South African companies. A notable exception is a fairly recent study by De Klerk and De Villiers (2012) which found that CRR provides additional information for shareholders which is being priced into the market value of the shares of the 100 largest South African companies. The study is, however, based on data from 2007 and 2008. In this context, the objective of this paper is to provide additional evidence on the value relevance of CRR by considering more recent data from 2011 and 2012. In doing so, this research makes a number of important contributions. Firstly, prior research on CRR in South Africa has not taken important corporate-governance developments into account. The release of King-III during 2009/2010 necessitates additional research on the correlation between share prices of JSE-listed companies and CRR metrics, as recommended by King-III1. Secondly, the increasing emphasis on non-financial disclosure by the JSE (2011; 2013), King-III (IOD, 2009) and the IRCSA (2011) means that corroborating or disputing the findings of prior research in favour of CRR is important. This is especially true given that the prior research on CRR in South Africa has relied on data predating the introduction of integrated-reporting mindsets (cf. Buys, Bosman & Van Rooyen 2009; De Villiers & Van Staden, 2010a). Thirdly, from an academic perspective, additional research adds to the body of knowledge and, over time, allows for meta-analysis of multiple findings in order to reach more statistically rigorous conclusions (Scargle, 2000; Rosenthal, 1979). Finally, the research makes an important practical contribution. It should be of interest for practitioners grappling with the trade-off between the cost of additional non-financial reporting and the financial benefits of CRR. At the same time, the study provides indirect evidence on the integrated-reporting initiative. If the correlation between share prices and the level of CRR -reported by De Klerk and De Villiers (2012) - no longer holds, this could suggest that integrated reports are not providing a sufficient account of how South African organisations are managing non-financial indicators. It may also be the case that, despite the considerable emphasis placed on integrated reporting by the IIRC and King-III, an integrated approach to investment appraisal -which specifically takes CRR into account - is yet to take hold.
To ensure comparability with the leading prior research, this study adopts a similar method to that used by De Klerk and De Villiers (2012), using a modified Ohlson model to explore the value relevance of CRR in respect of a sample of companies listed on the JSE. Unlike De Klerk and De Villiers (2012), however, the research does not make use of a CRR data set developed by one of the Big 4 audit firms. Instead, it makes use of an interpretively constructed disclosure checklist which is based on the recommended environmental, social and governance disclosures in King-III. This includes, inter alia, economic and social sustainability, governance of risk, and the role and functions of boards of directors and their committees2. The interpretatively constructed disclosure matrix is used to collect data from 2011/2012 integrated reports, and initial results from the modified Ohlson model are subject to hierarchical regression analysis (see Section 3). The intention is not to prove a causal relationship between CRR and share prices.
The remainder of this paper is organised as follows: Section 2 provides a theoretical frame of reference and develops two hypotheses in the context of prior CRR research. Section 3 discusses the method. Section 4 presents the results, followed by a brief discussion of the findings in Section 5. Section 6 contains the conclusion and identifies areas for future research.
2 Literature review and hypothesis development
Agency theory predicts that a divergence of interests between shareholders and managers necessitates the use of a system of checks and balances in order to mitigate residual losses (Jensen & Meckling, 1976). Early corporate governance mechanisms serve as an example, with independent directors, committees of the board, and the use of internal and external auditors designed to reduce information asymmetries between agents and principals and to lower agency costs (Watts & Zimmerman, 1983; Solomon, 2010). As explained by Shleifer and Vishny (1997:737), most efforts at effective corporate governance can be interpreted, from a financial point of view, as being concerned with "the ways in which suppliers of finance to corporations assure themselves of getting a return on their investment".
In this light, the development of corporate reporting can also be attributed, in part, to the need to address information asymmetries and facilitate the efficient allocation of capital. Despite the prevalence of neo-liberal paradigms at the heart of contemporary financial reporting, accountability and stewardship remain relevant considerations for users of financial statements, including current investors and creditors (Whittington, 2008; Murphy, O'Connell & Ó hÓgartaigh, 2013; Zhang & Andrew, 2013). In theory, high-quality financial reporting provides information which is useful to the users of financial statements in making assessments about the amount, timing and certainty of the reporting entity's future cash flows (IASB, 2010). By providing "decision-useful information" (IASB, 2010), comparability of financial information is improved, estimation uncertainty is reduced, and efficient allocations of capital ensure a lower cost of capital and debt (Ball & Brown, 1968; Ball, 2006; Barth, 2008). If the centrality of the shareholder in agency theory is relaxed, and provision is made for a broader group of stakeholders, a similar conclusion is reached regarding the development of non-financial disclosures (cf. Laffont & Martimort, 2009; Solomon, 2011).
From the 1960s to the start of the 1990s, CRR was seen as a theoretical and ethical debate, rather than business practice, neither required nor actively encouraged by shareholders (Carroll, 1999). With the realisation that companies owe a fiduciary duty not only to shareholders, but also to a large number of interested parties, a case can be made for more thorough reporting which places emphasis on both financial and non-financial metrics (IOD, 2009; IRCSA, 2011; Solomon, 2011). Carroll and Shabana (2010), for example, argue that CRR has a positive effect on the financial performance of an organisation, benefitting shareholders (and other stakeholders) mainly in the form of increased competitive advantage, gains from risk reduction, and reputational benefits for the reporting entity (cf. IOD, 2009; IRCSA, 2011; Solomon 2011). In particular, as the threats posed by population growth, climate change, worker unrest and resource scarcity become more serious, those companies with more evolved CRR initiatives are predicated to outperform their counterparts as the marketplace takes into consideration the importance of ethically responsible and sustainable business practice (IRCSA, 2011; King, 2012).
Lo and Sheu (2007) reach a similar conclusion, arguing that maximisation of a firm's value requires more than the implementation of short-term profit strategies. Ethical standards, environmental awareness and socially sound business practices are key considerations for stakeholders when pricing a firm's equity (King, 2012; IIRC, 2013). Similarly, Freedman and Patten (2004) suggest that firms with poor pollution records suffer negative market reactions, particularly when inadequate environmental disclosures have been provided. The perceived significance of environmental information may vary, depending on the term of the investment or level of experience of the investor (Holm & Rikhardsson, 2008), but environmental information continues to be relevant for assessing organisations' sustainability and future earnings potential (Hassel et al., 2005). Although there have been some findings suggesting that environmental and social disclosures have only a limited association with equity prices or the cost of finance (Jones et al., 2007), a "wider social movement has already led to an exponential growth" in the socially responsible investment sector as providers of capital "become concerned with how their money is invested" (Friedman & Miles, 2001:523). Consequently, whether as a result of the importance of accountability or the relevance of social and environmental practices for long-term financial sustainability, the general consensus is that social and environmental disclosures are important for investment decision making (cf. Hughes, 2000; Hassel et al., 2005; De Villiers & Van Staden, 2010b). This sentiment is shared by the IRCSA (2011) and IIRC (2011; 2013) dealing with the relevance of non-financial information in integrated reports (Karaibrahimoglu, 2010; IRCSA, 2011).
In this context, the last decade has seen a proliferation of non-financial information (including CRR disclosures) being made available by large corporations (Antonites & De Villiers, 2003; Hughen et al., 2014). The KPMG International Survey of Corporate Responsible Reporting, for example, shows an increasing percentage of the 250 largest global companies reporting their CRR activities, rising from 64 per cent (2005) to 83 per cent (2008), and, finally, to 95 per cent in 2011 (KPMG, 2005; KPMG, 2008; KPMG, 2011). Prior research suggests that this trend applies equally in developing economies (Lin & Walker, 2000; Dhaliwal, Li, Tsang & Yang, 2009; McGee, 2009). South Africa is no exception, with CRR evolving from an ideal to a strategic consideration for companies listed on the JSE.
In addition to the business case for comprehensive reporting of financial and non-financial metrics made by King-III (IOD, 2009) and the IRCSA (2011), for example, De Villiers and Van Staden (2010a) find that sound environmental disclosures are important for investors in gauging management's stewardship and assessing investment decisions. These findings are consistent with evidence suggesting that South African companies complying with the GRI reporting guidelines reported superior financial performance - measured in terms of earnings per share, headline earnings per share, return on assets, and returns on equity - than those organisations which did not comply with the guidelines (Buys et al., 2009). In support of these findings, and based on the assumption that CRR can reduce information asymmetries, De Klerk and De Villiers (2012) used a modified Ohlson model to test the value relevance of CRR, concluding that CRR disclosures are correlated with higher share prices. These findings are fully consistent with the increased pressure on companies to manage actively CRR issues documented in the corporate-governance literature (Brennan & Solomon, 2008; Carroll & Shabana, 2010). The De Klerk and De Villiers (2012) study is also in line with the conclusions of King-III (IOD, 2009) and the IIRC (2011; 2013) that only those companies mindful of their social and environmental impact will be able to operate in the long term and generate sustainable returns for stakeholders (Dhaliwal et al., 2009).
Given the frequently cited importance of CRR disclosures (IIRC, 2013; Hughen et al., 2014), providing evidence to support or refute the assertions of De Klerk and De Villiers (2012) is important. In particular, the paper by De Klerk and De Villiers (2012), while being the most recent and comprehensive examination of CRR disclosure in South Africa, relies on a broad composite measure of organisations' CRR without specifically taking into account the disclosure recommendations of King-III. Reassessing the value relevance of CRR is also necessary given that the KPMG data, collected from information available between 2007 and 2008, has not taken into consideration the change in reporting context introduced by the discussion papers on integrated reporting (cf. IRCSA, 2011; IIRC, 2013). Related to this, the study may have overstated the extent of integrated CRR disclosures by relying on "corporate responsibility information available in the public domain between 2007 and 2008" (De Klerk and De Villiers, 2012:26), rather than only information contained in the primary reporting documents.
Consequently, the first hypothesis is:
H1: Higher levels of CRR in South African integrated reports are significantly associated with higher share prices.
As with De Klerk and De Villiers (2012), this research is primarily concerned with the empirical relationship between CRR information and the share-market value of an equity for the 2011/2012 financial year-ends of a sample of listed companies under review (Ali & Hwang, 1999; Holthausen & Watts, 2001). The hypothesis is consistent with that used by De Klerk and De Villiers (2012), but it should be stressed that the research uses a South African-specific CRR data set, taking into account the recommended disclosures of King-III (discussed in more detail in Section 3).
Secondly, rather than test for the significance of any statistical relationship as a robustness check when applying the modified Ohlson model (Hassel et al., 2005; De Klerk and De Villiers, 2012), this study relies on a hierarchical regression model, in addition to the modified Ohlson model, in order to provide further evidence in support of the assertion that CRR is value-relevant:
H2: CRR in South African integrated reports will explain additional variance in share prices over and above the influence of the size of a firm's equity and the firm's net income.
In developing H1 and H2, the researchers were also mindful of the criticisms of early integrated reports. Despite the existence of a business case for CRR (KPMG, 2008; King, 2012), there is no guarantee that integrated reports include high-quality and decision-useful non-financial information. Hindley and Buys (2012), for example, find that there has been an increase in the extent of compliance with the GRI Guidelines by the South African mining industry, but that the practical relevance of this information may be limited. A similar conclusion is reached by Carels, Maroun and Padia (2013), who find significant repetition and the inclusion of only generic CRR disclosure by listed South African mining houses, contrary to the recommendations of the IIRC (2013) and the IRCSA (2011). These criticisms apply equally to non-mining companies, with early analysis of the integrated reports of South Africa's largest listed companies suggesting that there is considerable room for improvement when it comes to the disclosure of non-financial information (Ernst & Young, 2012; Solomon & Maroun, 2012; PwC, 2013). If the South African market is, at least, semi-strong form-efficient, these findings would suggest that, contrary to the general position, CRR is not necessarily value-relevant.
3 Method
3.1 Data
To test the impact of CRR on the share price of a company, two data sets are needed. The first measures the level of CRR. The second includes share prices and certain financial information about South African companies.
Data set 1: CRR data
Three potential CRR data sets exist: the JSE's Socially Responsible Investment (SRI) Index (JSE, 2004 to 2012), the KPMG International Survey on Corporate Responsible Reporting 2008 (KPMG, 2008), and the data used by Makiwane and Padia3 (2013).
The first data set has been developed by the JSE, using a rating process for listed companies complying with King-III (JSE, 2004 to 2012). The JSE, in addition to having an advisory committee of independent experts, assesses companies according to three broad categories: (1) environmental, (2) societal, and (3) governance and related sustainability concerns. The assessment includes a review of the extent to which each metric has been include in a company's policy, strategy, performance and reporting (JSE, 2013). The index was, however, unsuitable for the purpose of this study. The exact processes used for evaluating the companies, detailed scoresheets, expert commentary, and validity-reliability safeguards are not disclosed. Furthermore, the subcategories within the three broad assessment categories are not elaborated on. The weighting of each category, scale and range of scores are also not available4.
The KPMG (2008) survey is based on a comprehensive study of CRR. The report assimilates relevant CRR information from 2007 to 2008 from 100 of the largest companies in 22 countries, including South Africa. Data were compiled from information found in annual reports, stand-alone CRR reports and the companies' websites (KPMG, 2005; KPMG, 2008; KPMG, 2011). Although arguably the most comprehensive global report on CRR (De Klerk & De Villiers, 2012), the KPMG database was of limited use in this study. The data set does not take into consideration South African-specific information, most notably the provisions of King-III. In addition, KPMG restricted access to the full data set.
As a result, a normative CRR scale - developed by Makiwane and Padia (2013) - was used. The coding instrument concentrated on the corporate, societal, environmental and governance information referred to in King-III. Where necessary, the guidance provided by the GRI (2011) was used to complement the instrument and aggregate-disclosure requirements. This was in line with the intention to develop a South African-specific coding instrument based on the non-financial reporting metrics recommended by the country's code of corporate governance (IOD, 2009; Carels et al., 2013).
A content analysis of King-III was used to identify specific disclosure requirements, which were grouped under 111 subcategories. Examples of disclosure categories included in the final checklist are, inter alia: ethical leadership, corporate citizenship, boards and directors, committees of the board, the governance of information technology, legal compliance, stakeholder relationships, and integrated reporting (Makiwane & Padia, 2013). For ease of analysis, each of these disclosure categories was aggregated under 14 theme headings (adapted from King-III and the GRI Guidelines) such as "corporate governance", "risk management", "environmental disclosures" and "social disclosures" (Makiwane & Padia, 2013). Details are provided in Appendix 1.
An interpretive text analysis (see Merkl-Davies, Brennan & Vourvachis, 2011) was used to analyse the extent to which social-, environmental- and governance-specific information (as per the disclosure checklist) was included in the annual reports of the companies under review (Makiwane & Padia, 2013). The checklist was applied to a final sample of the 2011/2012 integrated reports of 82 companies listed on the JSE. A Likert scale ranging from "1" (low disclosure) to "5" (high disclosure) was used to gauge the extent of non-financial reporting by the same companies under review5 by computing an aggregated CRR score for each company. This score was reduced to a percentage representing the included CRR disclosures as a ratio of the total possible disclosures. As part of this process, each disclosure requirement was treated as equally relevant for users of financial statements. Although this simplifying assumption introduces a limitation to the research, it avoids the use of excessive judgement to rank the importance of specific disclosure requirements6.
The data collection and scoring process was subject to detailed peer review by the support researchers to ensure research quality. Where possible, the CRR score was also compared with information available from the SRI index and the results of a pilot study7. The absence of an objective scale for measuring CRR is, however, an inherent limitation of this study.
Data set 2: Financial information
The second data set included key financial metrics, including share prices. The data was obtained directly from the McGregor BFA database.
3.2 Sample size
The population consisted of all companies listed on the JSE. Owing to the fact that the Ohlson model specifies the use of the market value of equity as a dependent variable, unlisted companies are not included in the analysis.
The population was split into industries. Five companies were selected from each industry (as per the JSE), resulting in an initial sample of 92 listed companies. After excluding companies for which a CRR score - and the relevant financial information - was not available, a total of 82 companies was included in the final analysis. No companies were eliminated from the sample due to outlying CRR disclosure scores. The final sample size was consistent with comparable studies (cf. De Klerk & De Villiers, 2012). The adequacy of the sample size was also confirmed by tests for normality and independence of variables.
3.3 The tested model
The Ohlson model is a valuation technique based on accounting information, namely the book value of equity and future abnormal earnings, which can incorporate non-accounting information into a valuation (Lundholm, 1995; Ohlson, 1995). The model is well established and has been successfully applied by various studies examining the correlations between different variables and equity prices (Lundholm, 1995; Ohlson, 1995). It therefore offers a generally accepted technique for examining the value relevance of CRR in a South African context while ensuring a comparable methodological basis between studies.
Similar to the model proposed by Gordon (1959), where equity prices are a function of future dividends, Ohlson uses abnormal earnings, being current-period earnings less a capital charge for generating these earnings, in place of dividends (Gordon, 1959; Ohlson, 1995). The replacement of dividends with abnormal earnings is an accepted measure, as discussed in further detail by Peasnell (1982) and Edwards and Bell (1961). The model, in its simplest form, attempts to show a relationship between the book value of equity (the carrying value of assets less liabilities) and the present value of future abnormal earnings to the market value of a firm's equity (Ohlson, 1995). The model used in this study is expressed as:
Equation 1:
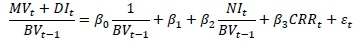
This final model, as shown in Equation 1, represents the cum-dividend market value of an equity,MVt + DIt, as a linear function of the opening balance of a firm's equity, , and net income at time t,
 , variables have been deflated by opening book value to control for size, as per the precedent of previous research (cf. Kothari & Zimmerman, 1995). Further, the model includes other value-relevant information represented by CRR disclosure at time t, CRRt,and a random error term, εt.
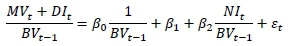
Stage one in the value-relevance assessment is to regress purely financial information against the value of the firm's equity. This process is done using Equation 2, which is identical to Equation 1 in most respects, except for the lack of relevant non-financial information (CRR):
Equation 2:
The data required to perform the valuation, namely cum-dividend market value, book value of equity and net income, are available on the McGregor BFA database. Using this data, a regression of the financial information alone yields a correlation coefficient (R), being a statistical measure of linear dependency. The square of the correlation coefficient (R2) is then used to determine how well the observed outcome is explained by the model.
The second stage of the value-relevance process involves regressing both financial and non-financial information. Following a process similar to that in Stage one, Equation 2 is used to determine the correlation coefficient and coefficient of determination of both financial and non-financial information. To perform the regression, two sets of data are required, one being financial and the other being relevant CRR information. All financial data was obtained from the McGregor BFA database. CRR information was obtained from the study by Makiwane and Padia (2013), as discussed in Section 3.1. A regression analysis on the data from the 82 companies yields a second set of correlation coefficients and a coefficient of determination representing both financial and CRR information.
The final stage in determining whether there is value relevance in CRR involves comparing the coefficient of determination derived from the financial information alone (Stage one) and that derived from both financial and CRR information (Stage two). As the coefficient of determination describes the explanatory strength (value in prediction) of the variables, the information with most value relevance will be that with the highest coefficient of determination (Colin Cameron & Windmeijer, 1997).
3.4 Validity and reliability
To increase the robustness of this research, the data from the sample of JSE-listed companies has been tested for normality using two goodness-of-fit tests: (1) Kolmogorov-Smirnov and (2) Shapiro-Wilk. Following prior research (e.g. Hassel et al., 2005; De Klerk and De Villiers, 2012) and statistical best practices (as described by Kenney & Keeping, 1962; Stephens, 1974; Colin Cameron & Windmeijer, 1997), the data has been tested for normality in the original, the square-rooted and the logarithmic form. The significance scores are maximised, under both the Kolmogorov-Smirnov and Shapiro-Wilk tests, when the data is transformed to a logarithm of base 10. Normality is best achieved in the variables' logarithmic form to a base of 10. In addition to the significance scores, the histograms and the Quantile-Quantile plots of the variables reflected a reasonable representation of a standard normal distribution for all of the variables.
Next, the tests for value relevance assume a linear relationship between the predictor variables and the dependent variable (Ohlson, 1995). For the purpose of this study, it is assumed that there is a linear relationship between the cum-dividends value of equity and the predictor variables: opening book value of equity, net income over the period and CRR information. To test the assumed linearity, a bivariate analysis (a Spearman's rank correlation coefficient) was performed (Siegel, 1957; Savage, 2012). Both the requirements for ordinality and monotonicity (Siegel, 1957) were met.
The Durbin-Watson test is then used to show the degree of independence that the error terms have from each other (Neter, Wasserman & Kutner, 1996). The untabulated results indicated that the critical value falls within the critical range for the D-score of 1.5-2.5 and is very close to the ideal statistic of 2. As such, serial correlation is not a major constraint to the predictions of the model.
The final assumption of linear regression is that of homoscedasticity (Draper, Smith & Pownell, 1966). To test whether the three predictor data sets (the opening book value of equity, net income and CRR score8) are homoscedastic in conjunction with the dependent variable (closing share prices expressed in logarithmic form), a one-way analysis of variance (ANOVA) and error term plotting is used (Hoaglin & Welsch, 1978). The results of these tests suggest that the data sets used in this study are relatively homoscedastic.
4 Results and discussion
Having satisfied the assumptions for using hierarchical linear regression and, thus, for the modified Ohlson model, the next stage of the research tested whether there is more predictive power in a model which includes CRR information than one based purely on financial information.
The first process comprised the regression analysis performed to test the associations between the independent variables (Log10BVEquityBoY and Log10NetIncome) and the dependent variable (Log10ShareEoY). This model returned an R value of .690, an R2 of .476, an adjusted R2 of .463, and a standard error of the estimate value of .578. These results suggest that almost half of the statistical variance in the dependent variable is accounted for by the independent variables (Tabachnick, Fidell & Osterlind, 2001). The results of the first process are shown by Model 1 in Table 1.
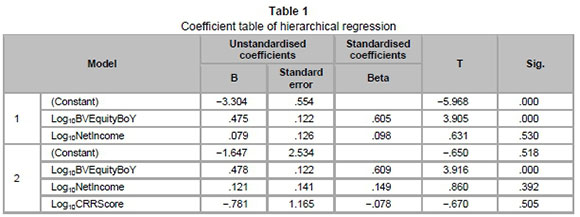
The second process comprised the regression analysis performed to test the associations between the same independent variables as in the first process, but with the variable Log10CRRScore included. The results are reported in Table 1. This model returned an R value of .692, an R2 value of .479, an adjusted R2 of .459, and a standard error of the estimate of .5804.
Table 1 shows the coefficient values of the financial model (Model 1) and mixed model (Model 2). The only variable with a Sig. value less than the critical value in both models is Log10BVEquityBoY. The adjusted R2 of the second model indicates that approximately 46 per cent of the change in Log10ShareEoY is attributable to the three predictor variables, Log10BVEquityBoY, Log10NetIncome and Log10CRRScore. This is effectively the same as the variance explained by the initial two variables included in the model. The adjusted R2 (which takes into account the number of variables in the equation) has decreased by .004 when the CRR measure is added to the equation. Furthermore, the CRR score is not significant in the equation. (This was the case irrespective of industry type, although the relatively small sample sizes prevent a definitive conclusion on the relevance of the industry type). Hypothesis 1 and Hypothesis 2 are both rejected. Their corresponding null hypotheses are accepted.
Other research has found a positive association between CRR and companies' net income (Dhaliwal et al., 2009) or share price (De Klerk and De Villiers, 2012). These findings are consistent with the results presented in Section 4, with a 0.710 bivariate correlation found between the CRR score and net income (in logarithmic form). This relationship, however, is not reflected in the multivariate association between CRR reporting and a firm's share price, notwithstanding the significant and positive bivariate association found for these variables. In other words, despite the significance of the associations between all the independent variables (size of a firm's equity, income, and levels of CRR) and share value in bivariate tests, in the multivariate model - which includes the "value of equity" and "income" variables - the CRR variable is not significantly associated with share value.
The similarity, or dissimilarity, in the movements of predictor variables and the dependent variable does not necessarily indicate causality (Tabachnick et al., 2001). By taking into account the influence of other variables, using multivariate testing, a clearer perspective of the underlying relationships is, however, provided. The decrease in the variance explained in share price when the CRR measure is added to the equation suggests that levels of CRR are associated with share price, but, according to bivariate tests, levels of CRR do not contribute to the prediction of share price over and above the influence of the size of a company's equity and its earnings. This is in contrast to the findings of De Klerk and De Villiers (2012), who suggest that CRR is value-relevant. With almost half of the variance in share prices explained by the size of a firm's equity, these findings indicate that just over half of the variance in share prices may be explained by factors external to the model. In turn, this implies that, contrary to the position of the IRCSA (2011) and King-III (IOD, 2009), the market was not responding to higher levels of CRR during the time period under review (financial years ending 2011 or 2012).
A possible explanation for this unexpected result is that the relationship between corporate social responsibility activity and reporting is unclear to the users of annual or integrated reports. Initial reviews of the first sets of integrated reports highlighted a gap between financial and non-financial metrics and criticised the absence of a clear link between strategy, risk, financial performance and non-financial indicators (Solomon & Maroun, 2012; PwC, 2013). In particular, there is the risk that generic CRR (Ernst & Young, 2012; Hindley & Buys, 2012) provides little insight into how organisations are managing their natural, human and social capital in the manner envisaged by the IIRC (2013), thus explaining the lack of contribution by CRR to the model. Alternatively, where companies have provided comprehensive disclosure on corporate responsibility activities, CRR could reduce firm-value by highlighting more clearly the risk and total cost of doing business.
A more critical explanation is provided in a study by Atkins and Maroun (2014) exploring South African institutional investors' views on local integrated reports. These researchers find that integrated reporting has begun to promote a holistic assessment of firm-performance, but that the focus remains strongly on financial measures. Investors are not necessarily including CRR as a significant component of their valuation and appraisal process (Atkins & Maroun, 2014) and, as argued by Gray (2012), are too often concerned with short-term profits thereby resulting in a marginalisation of non-financial reporting. Unfortunately, the Ohlson model cannot be used to show the extent to which different information being reported by South African organisations is being discounted into share prices. More exploratory research will, therefore, be needed to examine the relationship between CRR and the perceived relevance of non-financial reporting in the eyes of investors.
5 Conclusion
This study examines how CRR, as opposed to purely financial information, can help explain the predictive capacity of a modified Ohlson model. Two hypotheses were considered: (1) that CRR will be value-relevant when determining an equity price of a company listed on the JSE; and (2) that value relevance is significantly associated with CRR. Both hypotheses were rejected, suggesting that the predictive power of CRR reported by De Klerk and De Villiers (2012) may be overstated. Based on the lack of an incremental positive change in the R2 statistic when CRR information was added to the modified Ohlson model, these results suggest that CRR is not value-relevant in a South African context, despite the emphasis being placed on non-financial disclosures by the integrated-reporting initiative.
A possible explanation is that an increase in the level of CRR is not consistent with the provision of more useful information for users of the integrated reports. This may be due to deficiencies in the nature and extent of reporting, with the latest sets of integrated reports not doing enough to make the link between financial and non-financial measures sufficiently clear to investors (Solomon & Maroun, 2012; PwC, 2013). Alternatively, the null findings in Section 4 are indicative of a disconnect between the information being included in corporate reports and actual commitment to corporate responsibility in the eyes of stakeholders. Consistent with an emerging body of critical research, it may also be the case that integrated reporting (including CRR) has simply become a compliance exercise which does little to encourage the investor community to move away from a short-term focus on profits to a more balanced assessment of the ability of organisations to create and sustain value in the long run.
These findings and interpretations need to be considered in the context of the limitations associated with this type of research. Firstly - as with the study by De Klerk and De Villiers (2012) - the results are dependent on a normative disclosure scale. While every effort was taken to reduce the risk of researcher bias, there is an inherent degree of subjectivity involved in evaluating non-financial disclosures. The study has also assumed that the content and quality of the disclosures do not affect the relationship between CRR and share prices, something which future studies should address by including an appropriate measure as a moderator variable. Similarly, the value relevance of CRR may be influenced by a host of social, political or cultural factors which change over time (Solomon, Solomon, Joseph & Norton, 2013; Carels et al., 2013), but which the modified Ohlson model assumed were constant. Further research is, therefore, needed to develop a more comprehensive model which explains the value variance contributed by CRR to a firm's share price in the South African context. Longitudinal research could extend this body of research.
The primary limitation of this study is that it follows a process of incremental advancement of knowledge. It is limited to a sample of 82 companies listed on the JSE using information found in the 2011/2012 integrated reports and, owing to the nature of the Ohlson model, cannot prove a causal relationship between share price and CRR. In the context of a null finding, it is acknowledged that this research can do little more than "reduce the problem space" around CRR in the South African context. Nevertheless, the study makes an important contribution. Although all sources of variance between value relevance and CRR could not be modelled, this is a limitation common to previous research in this area. In addition, the model tested was based on theoretical foundations, allowing the study to contribute to the ongoing debate on the value relevance of CRR. In particular, publication bias is typically present in most disciplines because of the increased likelihood of papers being published when they report statistically significant relationships between the variables under review (Scargle, 2000). From a purely academic perspective, condemning papers with a "null finding" to the "file drawer" is an impediment to "combining the statistical results of studies" and reaching a scientifically sound conclusion on the relationship between CRR and share prices (cf. Scargle, 2000:91; Rosenthal, 1979:638). Testing the contribution of CRR to share price is an issue more complex than it might seem. Consequently, it is important for researchers to report all findings on the value relevance of CRR to ensure that meta-analyses over time offer additional insight into the boundary conditions under which CRR does or does not contribute to share price in the contemporary South African context.
Finally, the results of this research should be interpreted with the overriding understanding that the techniques used in the study are quantitative and based on a bounded rational financial model. Only empirical evidence of relationships between variables is highlighted. The qualitative dimensions of CRR need to be examined in more detail, as does the possible disconnect between CRR and how organisations are actually engaging with stakeholders to address important environmental, social and governance issues. To this end, further research dealing with the social construction of CRR paradigms - such as the relevance of CRR for organisational legitimacy or impression management - would complement the largely quantitative body of work on CRR and better highlight the causal links which underlie the findings of this paper.
References
ALI, A. & HWANG, L.-S. 1999. Country-specific factors related to financial reporting and the value relevance of accounting data. Available at: http://papers.ssrn.com/sol3/papers.cfm?abstract_id=181279 [accessed 2013-09-01]. [ Links ]
ANTONITES, E. & DE VILLIERS, C.J. 2003. Trends in South African corporate environmental reporting: A research note. Meditari Accountancy Research, 11(1):1-10. [ Links ]
ATKINS, J. & MAROUN, W. 2014. South African institutional investors' perceptions of integrated reporting. In: ACCA (ed.) London: The Association of Chartered Certified Accountants. [ Links ]
ATKINS, J. & MAROUN, W. 2015. Integrated reporting in South Africa in 2012: Perspectives from South African institutional investors. Meditari Accountancy Research, 23(2):197-221. [ Links ]
BALL, R. & BROWN, P. 1968. An empirical evaluation of accounting income numbers. Journal of Accounting Research, 6(2):159-178. [ Links ]
BALL, R. 2006. International Financial Reporting Standards (IFRS): Pros and cons for investors. Accounting & Business Research (Wolters Kluwer UK), 36:5-27. [ Links ]
BARTH, M.E. 2008. Global financial reporting: Implications for US academics. The Accounting Review, 83(5):1159-1179. [ Links ]
BRENNAN, N.M. & SOLOMON, J. 2008. Corporate governance, accountability and mechanisms of accountability: An overview. Accounting, Auditing & Accountability Journal, 21(7):885-906. [ Links ]
BUYS, P., BOSMAN, P. & VAN ROOYEN, S. 2009. Do socially conscious companies provide better financial performance? An exploratory study. Studia Universitatis Babes Bolyai -Oeconomica, 1:3-15. [ Links ]
CARELS, C., MAROUN, W. & PADIA, N. 2013. Integrated reporting in the South African mining sector. Corporate Ownership and Control, 11(1):991-1005. [ Links ]
CARROLL, A.B. & SHABANA, K.M. 2010. The business case for corporate social responsibility: A review of concepts, research and practice. International Journal of Management Reviews, 12(1):85-105. [ Links ]
CARROLL, A.B. 1999. Corporate social responsibility. Business & Society, 38(3):268-295. [ Links ]
COLIN CAMERON, A. & WINDMEIJER, F.A. 1997. An R-squared measure of goodness of fit for some common nonlinear regression models. Journal of Econometrics, 77(2):329-342. [ Links ]
DE KLERK, M. & DE VILLIERS, C. 2012. The value relevance of corporate responsibility reporting: South African evidence. Meditari Accountancy Research, 20(1):21-38. [ Links ]
DE MEUSE, K.P., VANDERHEIDEN, P.A. & BERGMANN, T.J. 1994. Announced layoffs: Their effect on corporate financial performance. Human Resource Management, 33 (4):509-530. [ Links ]
DE VILLIERS, C. & VAN STADEN, C.J. 2010a. Shareholders' corporate environmental disclosure needs. South African Journal of Economic and Management Sciences, 13(4):437-446. [ Links ]
DE VILLIERS, C. & VAN STADEN, C.J. 2010b. Shareholders' requirements for corporate environmental disclosures: A cross country comparison. British Accounting Review, 42(4):227-240. [ Links ]
DHALIWAL, D.S., LI, O., TSANG, A. & YANG, Y.G. 2009. Voluntary non-financial disclosure and the cost of equity capital: The case of corporate social responsibility reporting. Available at: http://www.ncsr-id.org/wp-content/uploads/2011/05/CSR_Reporting_Voluntary_Nonfinancial_Disclosure_the_Cost_of_Equity_Capital_(AAA-2011)_small.pdf [accessed 2013-09-01]. [ Links ]
DRAPER, N.R., SMITH, H. & POWNELL, E. 1966. Applied regression analysis. New York: Wiley. [ Links ]
EDWARDS, E.O. & BELL, P.W. 1961. The theory and measurement of business income. California: University of California Press. [ Links ]
ERNST & YOUNG. 2012. Ernst & Young's excellence in integrated reporting awards 2012. Available at: http://www.ey.com/Publication/vwLUAssets/Excellence_in_Integrated_Reporting_Awards_2012/$FILE/120830%20Excellence.indd.pdf [accessed 2011-04-02]. [ Links ]
FREEDMAN, M. & PATTEN, D. 2004. Evidence on the pernicious effect of financial report environmental disclosure. Accounting Forum, 28(1):14. [ Links ]
FRIEDMAN, A. & MILES, S. 2001. Socially responsible investment and corporate social and environmental reporting in the UK: An exploratory study. The British Accounting Review, 33(4):548. [ Links ]
GORDON, M.J. 1959. Dividends, earnings, and stock prices. The Review of Economics and Statistics, 41(2):99-105. [ Links ]
GRAY, R. 2012. Integrated reporting: Integrated with what and for whom? Available at: https://risweb.st-andrews.ac.uk/portal/en/researchoutput/integrated-reporting-integrated-with-what-and-for-whom(f9797689-51b2-4bb0-b158-e3a6ab0904ca).html [accessed 2014-07-07]. [ Links ]
HASSEL, L., NILSSON, H. & NYQUIST, S. 2005. The value relevance of environmental performance. European Accounting Review, 14(1):41-61. [ Links ]
HINDLEY, T. & BUYS, P.W. 2012. Integrated reporting compliance with the Global Reporting Initiative framework: An analysis of the South African mining industry. The International Business & Economics Research Journal (Online), 11(11):1249-n/a. [ Links ]
HOAGLIN, D.C. & WELSCH, R.E. 1978. The hat matrix in regression and ANOVA. The American Statistician, 32(1):17-22. [ Links ]
HOLM, C. & RIKHARDSSON, P. 2008. Experienced and novice investors: Does environmental information influence investment allocation decisions? European Accounting Review, 17(3):537-557. [ Links ]
HOLTHAUSEN, R.W. & WATTS, R.L. 2001. The relevance of the value-relevance literature for financial accounting standard setting. Journal of Accounting and Economics, 31(1):3-75. [ Links ]
HUGHEN, L., LULSEGED, A. & UPTON, D.R. 2014. Improving stakeholder value through sustainability and integrated reporting. CPA Journal, 57-61. [ Links ]
HUGHES, K.E. 2000. The value relevance of nonfinancial measures of air pollution in the electric utility industry. The Accounting Review, 75(2):209-228. [ Links ]
IASB (International Accounting Standards Board). 2010. The conceptual framework for financial reporting. Pietermaritzburg: LexisNexus (International Accounting Standards Committee Foundation Publications Department). [ Links ]
IIRC (International Integrated Reporting Council). 2011. Towards integrated reporting: communicating value in the 21st century. Available at: http://theiirc.org/wp-content/uploads/2012/06/Discussion-Paper-Summary1.pdf [accessed 2012-06-05]. [ Links ]
IIRC (International Integrated Reporting Council). 2013. International integrated reporting framework. Available at: http://www.theiirc.org/wp-content/uploads/2013/12/13-12-08-THE-INTERNATIONAL-IR-FRAMEWORK-2-1.pdf [accessed 2012-06-05]. [ Links ]
IOD (Institute of Directors in Southern Africa). 2009. The King code of governance for South Africa (2009) and King report on governance for South Africa (2009) (King-III). Johannesburg, South Africa: Lexis Nexus South Africa. [ Links ]
IRCSA (Integrated Reporting Committee of South Africa). 2011. Framework for integrated reporting and the integrated report. Available at: www.sustainabilitysa.org [accessed 2012-06-05]. [ Links ]
JENSEN, M.C. & MECKLING, W.H. 1976. Theory of the firm: Managerial behavior, agency costs and ownership structure. Journal of Financial Economics, 3(4):305-360. [ Links ]
JOHANNESBURG SECURITIES EXCHANGE. 2013. JSE listing requirements. Available at: http://www.jse.co.za/How-To-List/Listing-requirements/JSE-listing-requirements.aspx [accessed 2013-02-01]. [ Links ]
JONES, S., FROST, G., LOFTUS, J. & VAN DER LAAN, S. 2007. An empirical examination of the market returns and financial performance of entities engaged in sustainability reporting. Australian Accounting Review, 17(41):78-87. [ Links ]
JSE. 2004 to 2012. Socially responsible investing index [Online]. Johannesburg Stock Exchange. Available at: http://www.jse.co.za/Products/SRI.aspx [accessed 2013-09-12]. [ Links ]
JSE. 2013. Johannesburg stock exchange SRI index [Online]. Available at: http://www.jse.co.za/Products/SRI.aspx [accessed 2013-09-12]. [ Links ]
KARAIBRAHIMOGLU, Y.Z. 2010. Corporate social responsibility in times of financial crisis. African Journal of Business Management, 4(4):382-389. [ Links ]
KENNEY, J.F. & KEEPING, E.S. 1962. Mathematics of statistics (3rd ed.) New York: Van Nostrand. [ Links ]
KING, M.E. 2012. Comments on: Integrated reporting and the integrated report. Public lecture. International Corporate Governance Conference. Johannesburg, South Africa, 23 October. [ Links ]
KOTHARI, S.P. & ZIMMERMAN, J.L. 1995. Price and return models. Journal of Accounting and Economics, 20(2):155-192. [ Links ]
KPMG. 2005. KPMG international survey of corporate responsible reporting. [ Links ]
KPMG. 2008. KPMG international survey of corporate responsible reporting. [ Links ]
KPMG. 2011. KPMG international survey of corporate responsible reporting. [ Links ]
LAFFONT, J.-J. & MARTIMORT, D. 2009. The theory of incentives: The principal-agent model. Princeton University Press. [ Links ]
LIN, S. & WALKER, M. 2000. FRS3 earnings, headline earnings, and accounting-based valuation models. Accounting and Business Research, 30(4):299-306. [ Links ]
LO, S.-F. & SHEU, H.-J. 2007. Is corporate sustainability a value-increasing strategy for business? Corporate Governance: An International Review, 15(2):345-358. [ Links ]
LUNDHOLM, R.J. 1995. A tutorial on the Ohlson and Feltham/Ohlson models: Answers to some frequently asked questions. Contemporary Accounting Research, 11(2):749-761. [ Links ]
MAKIWANE, T. & PADIA, N. 2013. Evaluation of corporate integrated reporting in South Africa post King-III release in South Africa: An exploratory enquiry. Journal of Economic and Financial Sciences, 26(2):421-438. [ Links ]
MCGEE, R.W. 2009. Corporate governance in developing economies. Springer. [ Links ]
MERKL-DAVIES, D., BRENNAN, N. & VOURVACHIS, P. 2011. Text analysis methodologies in corporate narrative reporting research. 23rd CSEAR International Colloquium. St Andrews, United Kingdom. [ Links ]
MURPHY, T., O'CONNELL, V. & Ó HÓGARTAIGH, C. 2013. Discourses surrounding the evolution of the IASB/FASB conceptual framework: What they reveal about the "living law" of accounting. Accounting, Organizations and Society, 38 (1):72-91. [ Links ]
NETER, J., WASSERMAN, W. & KUTNER, M.H. 1996. Applied linear statistical models. Chicago: Irwin. [ Links ]
OHLSON, J.A. 1995. Earnings, book values, and dividends in equity valuation. Contemporary Accounting Research, 11(2):661-687. [ Links ]
PEASNELL, K.V. 1982. Some formal connections between economic values and yields and accounting numbers. Journal of Business Finance & Accounting, 9(3):361-381. [ Links ]
PwC. 2013. The value creation journey: A survey of JSE Top-40 companies' integrated reports. Available at: http://www.pwc.co.za/en_ZA/za/assets/pdf/integrated-reporting-august-2013.pdf [accessed 2014-05-10]. [ Links ]
ROSENTHAL, R. 1979. The "file drawer problem" and tolerance for null results. Psychological Bulletin, 86:638-641. [ Links ]
SAVAGE, N. 2012. Comments on: Commentary on Spearman's rank correlation, 14 November 2012. [ Links ]
SCARGLE, J.D. 2000. Publication bias: The "file-drawer" problem in scientific inference. Journal of Scientific Exploration, 14(1):91-106. [ Links ]
SHLEIFER, A. & VISHNY, R.W. 1997. A survey of corporate governance. The Journal of Finance, 52(2):737-783. [ Links ]
SIEGEL, S. 1957. Nonparametric statistics. The American Statistician, 11(3):13-19. [ Links ]
SOLOMON, J. & MAROUN, W. 2012. Integrated reporting: The new face of social, ethical and environmental reporting in South Africa? In: ACCA (ed.) London: The Association of Chartered Certified Accountants. [ Links ]
SOLOMON, J. 2010. Corporate governance and accountability (3rd ed.) West Susex, United Kingdom: John Wiley & Sons. [ Links ]
SOLOMON, J. 2011. Corporate governance and accountability (4th ed.) West Susex, United Kingdom: John Wiley & Sons. [ Links ]
SOLOMON, J.F., SOLOMON, A., JOSEPH, N.L. & NORTON, S.D. 2013. Impression management, myth creation and fabrication in private social and environmental reporting: Insights from Erving Goffman. Accounting, Organizations and Society, 38(3):195-213. [ Links ]
STEPHENS, M.A. 1974. EDF statistics for goodness of fit and some comparisons. Journal of the American Statistical Association, 69(347):730-737. [ Links ]
TABACHNICK, B.G., FIDELL, L.S. & OSTERLIND, S.J. 2001. Using multivariate statistics. Journal of the American Statistical Association. [ Links ]
WATTS, R.L. & ZIMMERMAN, J.L. 1983. Agency problems, auditing, and the theory of the firm: Some evidence. Journal of Law and Economics, 26(3):613-633. [ Links ]
WHITTINGTON, G. 2008. Fair value and the IASB/FASB conceptual framework project: An alternative view. Abacus, 44(2):139-168. [ Links ]
ZHANG, Y. & ANDREW, J. 2013. Financialisation and the conceptual framework. Critical perspectives on accounting (In press). [ Links ]
Accepted: June 2015
1 The research does not take into account the guidelines provided by the International Integrated Reporting Committee's framework on integrated reporting. The document was only released during 2013 and was not, therefore, at the time of carrying out this study, applied by South African companies when preparing their integrated reports.
2 De Klerk and De Villiers use an international data set developed by KPMG. Although arguably one of the most comprehensive international data sets on CRR, it does not concentrate specifically on the requirements contained in King-III.
3 The researchers are grateful to these authors for making their data sets available for the purpose of this study.
4 In summary, only two ranks are shown by the SRI, namely "Top performers" and "Consistently top performers" (JSE, 2004 to 2012), which, in the context of this study, are of limited use. Upon request, the authors were denied access to any additional information.
5 To ensure reliability of the data, the primary researcher was responsible for determining the initial score, with the results subject to review by the support researcher. The disclosure checklist was also piloted (Makiwane & Padia, 2013).
6 The authors would like to thank Makiwane and Padia (2013) for providing access to their disclosure instrument (and data).
7 The results of the pilot study were presented at the Southern African Accounting Association Conference, Cape Town (2012). Special thanks go to the conference participants and the two anonymous reviewers.
8 Log10BVEquityBoY, Log10NetIncome and Log10CRRScore.
9 The source of each "indicator" is provided. "Paragraphs" or "principles" refer to the paragraphs or principles quoted in a chapter of King-III. Whenever a paragraph or principle referring to the King III report is provided, it is also important to note the chapter from which the paragraph or principle was extracted. Each chapter is provided next to the main category. Categories obtained from the GRI Guidelines are identified as "GRI indicators". Categories derived by an interpretive analysis of the corporate-governance literature by Makiwane and Padia are marked "interpretive indicator". "Paragraph numbers" refer to the relevant principles quoted in King-III. The corresponding chapter in King-III is also provided.
Appendix 1: The disclosure checklist
The following 14 categories and 111 subcategories form the basis for the normative metric derived by Makiwane and Padia (2013)9. The "disclosure categories" were obtained from three sources: (1) King-III, (2) the GRI Guidelines (2011), and (3) indicators identified by Makiwane and Padia (2013) from an interpretive analysis of the corporate-governance literature.
Ethical leadership and corporate citizenship [King III - Chapter 1]
1 Effective leadership based on ethical values such as integrity, honesty, independence, accountability and trust can be ascertained from the integrated report. [Par. 1]
2 Company strategies and vision are clearly outlined. [Par. 7, 9, 35]
3 Mission statement and company values are provided. [Par. 9, 10]
4 Ethical standards are articulated in the code of conduct. [Par. 12-15]
5 Independent assurance of ethics by internal audit or external assurance providers. [Par. 52]
Boards and directors [King III - Chapter 2]
6 Company is governed by a unitary board of directors. [Par. 62]
7 Directors are appointed through a formal process. [Principle 2.19, par. 80-82]
8 Board is comprised of the majority of non-executive directors. [Par. 64]
9 Of the non-executive directors, the majority are independent. [Par. 64]
10 Board is chaired by a non-executive independent director. [Par. 38]
11 Board has appointed a lead independent director, if the chairperson is not independent. [Par. 38]
12 The CEO (chief executive officer) is a board member. [Par. 47, 73]
13 The financial director (or chief financial officer [CFO]) is a board member. [Par. 47, 73]
14 Qualifications and experience of directors are disclosed. [Par. 88]
15 Board is assisted by a competent, suitably qualified and experienced company secretary. [Principle 2.21]
16 Board is regulated by a formal charter which sets out the role of the board and each director. [Par. 1]
17 Appointment of well-structured committees to deal with key functions of the board, which include separate audit, risk, remuneration and nomination committees as a minimum. [Principle 2.23, par. 130]
18 Committees are regulated by formal charters which set out the role of individual committees. [Par. 125-126]
19 Board meets at least four times a year. [Par. 1]
20 Satisfactory attendance of board meetings as per the attendance register. [Interpretive indicator]
21 Induction programme for new directors is in place. [Par. 89-90]
22 Ongoing training for all directors is in place. [Par. 92]
23 Performance of the board, individual directors and committees is evaluated on a regular basis. [Par. 109-114]
24 Share option scheme is not available to non-executive directors. [Par. 154]
25 Policy is in place for appointment and retirement of directors. [Par. 74-75, 80-82]
26 Remuneration of directors and senior executives is disclosed. [Par. 180]
27 Remuneration of the three most highly paid employees (other than directors) is disclosed. [Par. 180]
28 Remuneration policy regarding directors is approved by the shareholders. [Par. 186]
Audit committees [King III - Chapter 3]
29 Audit committee is appointed by the board (through the nomination committee) and is approved by the shareholders. [Par. 3]
30 Formal charter and processes are in place outlining the functions of the audit committee. [Par. 6 of Audit Committees, par. 125, 126, 129 & 134 of Boards & Directors]
31 Suitably skilled and experienced independent non-executive directors. [Principle 3.2, par. 12-15]
32 Comprised of at least three non-executive, independent directors. [Par. 10]
33 Chairperson of the board is not a member of the audit committee. [Par. 11]
34 Chaired by a non-executive, independent director, other than the chairperson of the board. [Principle 3.3]
35 Meets at least two times a year. [Par. 7]
36 Satisfactory attendance of audit committee as per attendance register. [Par. 7]
37 Oversees internal and financial controls. [Par. 30, 64, 66-70]
38 Oversees internal audit function. [Par. 66-70, principle 7.4 of Internal Audit Function]
39 Oversees financial risk management (and other risks if necessary). [Par. 64, 65]
40 Assesses the performance, expertise and skills of the financial function, including the financial director. [Par. 51, 52]
41 Oversees the preparation of the integrated report (including sustainability issues). [Principle 3.4, par. 24-29]
42 Audit committee (or company as a whole) applies a combined assurance model in providing assurance on activities such as risk, compliance, internal audit and governance. [Principle 3.5, par. 46-48]
43 Evaluates independence and credentials of the external auditor. [Par. 77]
44 Evaluates performance of the external auditor. [Par. 77]
45 Reports to the board and shareholders how it carried out its responsibilities. [Principle 3.10, par. 83-85]
Risk-management committee [King III - Chapter 4; interpretive indicators]
46 Board appoints risk and/or audit committee to oversee risk management. [Par. 16]
47 Risk (or audit) committee consists of at least three directors (both executive and non-executive). [Par. 20, 21]
48 It is chaired by an independent non-executive director, other than the chairperson of the board or the executive director (not required by King III but considered necessary for the purposes of this research). [Interpretive indicator]
49 Formal charter and processes are in place outlining the functions of the risk/audit committee. [Par. 5]
50 Risk (or audit) committee meets at least two times a year. [Par. 22]
51 Satisfactory attendance of risk (or audit) committee as per attendance register. [Interpretive indicator]
52 Risk committee (or audit/board) identified key financial risks and quantified them, if possible. [Par. 31-34, 40, 41-43]
53 Risk committee (or audit/board) identified key non-financial risks and quantified them, if possible. [Par. 31-34, 41-43]
54 Risk committee (or audit/board) explains how the identified financial risks will be addressed. [Par. 31-34, 40, 41-43]
55 Risk committee (or audit/board) explains how the identified non-financial risks will be addressed. [Par. 31-34, 41-43]
56 Risk committee (or audit/board) sets levels of risk tolerance. [Principle 4.2, par. 11-15]
57 Risk committee (or audit/board) expresses its views on the effectiveness of the company's risk-management processes. [Par. 4]
Remuneration committee [King III - Chapter 2]
58 Remuneration committee comprises at least two non-executive and independent directors. [Interpretive indicator]
59 It is chaired by an independent non-executive director, other than the chairperson of the board or executive director. [Par. 131 of Boards & Directors]
60 Formal charter and processes are in place outlining the functions of the remuneration committee. [Par. 125, 126 & 134 of Boards & Directors]
61 Remuneration committee meets at least two times a year (not required by King III but considered necessary for the purposes of this research). [Interpretive indicator]
62 Satisfactory attendance of remuneration committee as per attendance register. [Interpretive indicator]
63 Remuneration committee or other structure determines remuneration of executive and non-executive directors. [Par. 150 of Boards & Directors]
Nomination committee [King III - Chapter 2]
64 Nomination committee comprises at least two non-executive and independent directors. [Interpretive indicator]
65 It is chaired by an independent non-executive director, who can also be the chairperson of the board, other than the executive director. [Par. 131 of Boards & Directors]
66 Formal charter and processes are in place outlining the functions of the nomination committee. [Par. 125, 126 & 134 of Boards & Directors]
67 Nomination committee meets at least two times a year (not required by King III but considered necessary for the purposes of this research). [Interpretive indicator]
68 Satisfactory attendance of nomination committee as per attendance register. [Interpretive indicator]
69 Nomination committee or other structure recommends the appointment and dismissal of executive and non-executive directors. [Par. 79 of Boards & Directors]
70 Directors nominated by the committee or other structure are presented for approval by the shareholders. [Par. 80 of Boards & Directors]
Internal audit function [King III - Chapter 7]
71 Internal audit function has been set up (within the company or externally). [Par. 1]
72 Internal audit function reports to the audit committee. [Par. 24, 33]
73 Internal audit is headed by the chief audit executive (CAE) or external company. [Par. 11]
74 Internal audit (or its CAE)/external company attends audit committee meetings and board meetings by invitation. [Par. 28, 29, 34]
75 Internal audit/other structure provides assurance on the effectiveness of internal control environment. [Principle 7.3, par. 2, 12-17]
76 Internal audit/other structure provides assurance on the effectiveness of risk management. [Principle 7.3, par. 2, 12-17]
77 Internal audit/other structure provides assurance on the effectiveness of governance (including ethics). [Par. 2]
78 Internal audit is subjected to an independent quality review. [Par. 23]
79 Internal audit follows a risk-based approach to its plan. [Principle 7.2, par. 7, 18]
Governance of information technology (IT) [King III - Chapter 5]
80 Board or other structure monitors and evaluates significant IT investments and expenditure. [Principle 5.4]
81 A suitably qualified and experienced chief information officer (CIO) is appointed to manage IT. [Par. 20]
82 Board or other structure ensures that IT complies with IT-related laws, rules, codes and standards. [Par. 33]
83 Risk committee or other structure oversees overall risk implications of IT. [Par. 30-34, 43-47]
84 Audit committee or other structure oversees financial risk implications of IT. [Par. 47]
85 Board receives an independent assurance on the effectiveness of IT through internal audit function and/or external assurance providers. [Par. 28]
Compliance laws, rules, codes and standards [King III - Chapter 6]
86 Compliance function has been set up by the company. [Par. 16]
87 Compliance function/other structure oversees compliance with laws, rules, codes and standards. [Principle 6.1]
88 Company discloses non-binding rules, codes and standards to which it adheres. [Par. 6]
Governing stakeholder relationships [King III - Chapter 8; GRI indicator]
89 Board identifies key stakeholders and their interests on a regular basis. [Par. 7 & 8 of King III]
90 Interests of key stakeholders are taken into account in the integrated report. [Par. 7 & 9 of King III]
91 Explanation of the process used for rating topics in the order of priority. [GRI indicator]
Integrated reporting [King III - Chapter 9; GRI indicators; interpretive indicators]
92 Financial and sustainability issues relating to economic, social and environmental impacts all covered in one or more documents of integrated report. [Par. 1]
93 Tone in respect of integrated reporting components is articulated and summarised in the introductory section, chairperson's report or CEO's report within the integrated report. [Interpretive indicator]
94 Information on integrated reporting components is harmonised and a link drawn to show interdependencies between these components in the integrated report. [Interpretive indicator]
95 Sustainability issues and disclosures are independently assured (under the auspices of the audit committee or other structure). [Principle 9.3, par. 17-21]
96 Report clearly indicates whether King III/II guidelines have been followed. [Interpretive indicator]
97 Report clearly states areas of improvement on King III/II guidelines. [Interpretive indicator]
98 Report clearly indicates whether GRI guidelines have been followed. [GRI indicator]
99 Report clearly states areas of improvement on GRI [GRI indicator, interpretive indicator]
100 Index is provided as per GRI Guidelines. [GRI indicator]
101 Glossary of terms provided as per GRI Guidelines or other guidelines. [GRI indicator]
102 Report provides proper referencing with page numbers for each major issue covered. [GRI indicator]
Economic sustainability [GRI indicator; interpretive indicators]
103 Value-add statement and other economic/value-add information are provided. [GRI indicator]
104 Quantification of economic efforts. [Interpretive indicator]
105 Report is easy to read. [Interpretive indicator]
Social sustainability [GRI indicator; interpretive indicators]
106 Involvement in CSI programmes for employees and communities such as training, education, sports, HIV/AIDS, donations, bursaries. [GRI indicator]
107 Quantification of costs as well as the number of social projects/programmes. [Interpretive indicator]
108 Report is easy to read. [Interpretive indicator]
Environmental sustainability [GRI indicator; interpretive indicators]
109 Implementation of sound environmental programmes. [GRI indicator]
110 Quantification of costs incurred and efforts to curb environmental damage. [Interpretive indicator]
111 Report is easy to read. [Interpretive indicator]

