


Services on Demand
Article
 English (pdf)
 Article in xml format
 Article references
Indicators

Related links
-
 Cited by Google
 -
 Similars in Google
Share

 Permalink
South African Journal of Economic and Management Sciences
On-line version ISSN 2222-3436
Print version ISSN 1015-8812
S. Afr. j. econ. manag. sci. vol.18 n.2 Pretoria 2015
http://dx.doi.org/10.17159/2222-3436/2015/v18n2a6
ARTICLES
Revisiting the relationship between different financial risk measures and the market return on ordinary shares in South Africa
Elda du Toit
Department of Financial Management, University of Pretoria
ABSTRACT
The main aim of this study was to test whether there is a positive relationship between different financial risk measures and the expected return of a share. This study was performed in 1995 by Brummer and Wolmarans, who obtained results contrary to those of a similar study in the United States of America in 1988. The reasons for the difference were not established. This study follows up the one by Brummer and Wolmarans to determine whether the passing of 19 years could have brought about any difference in the results. This process was initiated by testing a set of variables from a sample size of 107 JSE-listed companies from 2002 to 2012 for linearity. As there was no such linear relationship between any of the variables, no assumptions can be made about any relationship between share return and the risk measures tested here. If investors were risk averse, one would expect a positive relationship between different financial risk measures and the expected return of a share. This is not the case in the South African market.
Key words: beta, debt-equity ratio, financial risk, leverage, linearity, required return, return risk, share return
1 Introduction
'The greater the proportion of debt in the firm's capital structure the more likely it is that shareholders will lose everything or strike it rich ' (Arditti, 1967)
Investors are interested in minimising the risk associated with their investments, while at the same time attempting to maximise the return. The search continues for the best measure for assessing investment risk. As Arditti states above, the proportion of debt (leverage) in a company's capital structure has, for a long time, been considered a good indication of expected return. The question arises as to whether the presence of leverage in the capital structure of a company increases or decreases the return that can be expected from the company's shares. If a clear relationship exists, investors can use accounting information about a company's leverage, in conjunction with market information, to evaluate the expected share performance.
The risk versus return principle is a general assumption in the field of financial management. It means that potential return rises with an increase in risk. Low levels of risk are therefore associated with low potential returns, while high levels of risk are associated with high potential returns. An investor therefore, according to preferences of risk adversity, accepts only a given level of risk if an accepted level of compensation (return) can be earned. This also relates to what is known as the indifference point (Lambrechts, 1990), which can be defined as the point at which the use of financial leverage over the use of equity capital does not give rise to any improvement on earnings per share (EPS), creating indifference in investors.
The relationship between leverage and expected share returns has been a contentious issue among scholars for many years. Both positive and negative relationships have been identified, but no final conclusion has yet been reached. Researchers like Bhandari (1988), Fama and French (1992) and Gomes and Schmid (2010) have observed a positive relationship between share returns and leverage. Other researchers, such as Penman, Richardson and Tuna (2007), George and Hwang (2010), Garlappi and Yan (2011) and Obreja (2013), have observed a distinctly negative relationship between share returns and leverage.
In this study, the debt-equity ratio is used to represent leverage and to explain the expected return on ordinary shares. The studies mentioned above indicated that it could not be assumed that company shares with high debt-equity ratios always pose a high risk. Other factors, such as operating risk, may play a compensatory role. One can, however, expect that the debt-equity ratio will correlate positively with the risk associated with ordinary shares. If this is the case, the debt-equity ratio can be used in conjunction with beta as proxies for the risk inherent in a company's ordinary shares. If it is assumed that investors are generally risk-averse, there ought to be a positive relationship between leverage and the return on ordinary shares, because investors would expect a specific level of return for the additional risk they face.
This study aims to investigate the fact that Bhandari (1988) observed a positive relationship between leverage and share returns when the study was conducted in the United States of America (as expected from the risk-return theory), while Brümmer and Wolmarans (1995) found a negative relationship when the study was replicated in South Africa. The hypotheses of the study can therefore be defined as:
HOA: Expected common share returns are linearly related to certain forms of risk.
H0B: The relationship between share returns and certain risk measures is positive.
The author maintains that the changes that have taken place in South African politics and in the South African market since 1995 may have caused a change in investors' perceptions of leverage. This may mean that the relationship between leverage and market return is now a positive one, similar to the results from the study performed by Bhandari (1988). This ought to be investigated, for two main reasons. First, the original article was published in Afrikaans, which limits its usefulness to a wider international audience. Secondly, the JSE has more listed companies with more local and international investors who could benefit from the updated evidence presented here.
The first factor to have possibly played a role in changing the market environment was the number of legislative changes that affected the Johannesburg Stock Exchange, South Africa (JSE) in 1995, shortly after the study by Brümmer and Wolmarans (Johannesburg Stock Exchange, 2014). The changes resulted in the deregulation of the JSE with the introduction of limited liability corporate and foreign membership. Standards were set for stockbrokers' qualification. In 1997, the trading system was automated and dual trading capacity and negotiated brokerage were introduced. The introduction of the Securities Exchange News System (SENS) ensures the early and wide distribution of company announcements and price-sensitive information. With a zero-failed trade record, the JSE became an international player, attracting foreign investment. Other major changes occurred, including the introduction of a focus on Social Responsibility and the listing of JSE Ltd on the Main Board on 5 June 2006 (Johannesburg Stock Exchange, 2014).
The second factor was the first democratic election that took place in 1994 and the subsequent changes in the political playing field. Consequently, the trading and economic environments in South Africa have undergone significant changes over the past 20 years. For instance, after sanctions were lifted, international borrowing and lending became possible. Owing to the development of information technology, South African investors are now better informed than they were in 1995. Information technology has also allowed South Africa to become part of the international market scene. All these factors would suggest a new set of findings that are more in line with the results obtained in studies performed in the United States of America, which support the risk-return theory.
The empirical section of the study consists of an analysis of the financial risk factors and the share price returns for 107 companies listed on the Johannesburg Stock Exchange from 2002 to 2012. The results of the study demonstrate that the relationship between the debt-equity ratio of a company and the returns that can be expected from its ordinary shares cannot be determined, as there is no linear relationship among any of the variables.
The next section provides a literature overview of the topics relevant to the study. This is followed by a brief discussion of the research methodology. The results are discussed in the conclusion to the study.
2 Literature review
2.1 Risk versus return and the measures of risk
To invest in the shares of a company means to accept risk. A company sells its shares to the public to gain capital, which will be used to earn value for the company. The investor viewpoint is largely the same: to invest in order to gain benefits in the form of increased value and/or dividends. However, there is an inherent risk that the company may perform poorly, which will result in a reduction in value and small or no dividends being paid. In the worst-case scenario, a company could fail and the total investment be lost.
Risk and return go together in investors' minds. This is based on an assumption generally made in finance which holds that a rational investor would not take more risk without the expectation of a higher return (Bodie, Kane & Marcus, 2010). This relationship has been tested in theoretical and empirical research since the early 1950s.
Investors have to evaluate the risk of available companies in which they would like to invest. This is done mostly by evaluating specific aspects of a company to quantify its riskiness. One of the best-known measures for market risk is beta. Beta indicates the extent to which share and market returns rise and fall together (Jarvela, Kozyra & Potter, 2009). The value of beta reflects the value with which a share would move at a given movement in the market, where a beta of one means that a share's returns rise and decline at the same rate as that of the market. The beta sign is an indication of the direction of expected movement. If beta is positive, it means that the share will move in the same direction as that of the market, and vice versa. The difference between levered and unlevered beta is a distinction in betas that has to be taken into account. Levered beta can be termed the 'true beta" of a company. It is a calculation of beta that includes the financial risk faced by the company as a result of debt (Hamada, 1972; Conine Jr & Tamarkin, 1985). Unlevered beta is a formula applied to levered beta to remove the risk brought by debt to a company's beta.
The relationship between beta and risk was proved by Beaver and Manegold (1975). They observed that beta would increase as a company increased its leverage. Beta was shown to be empirically associated with several factors, including leverage, earnings variability, pay-out, and growth, as well as an accounting earnings beta. However, in more recent studies it has been found that beta is not necessarily the best or the most accurate means of evaluating risk. Bhandari (1988) indicated that beta may be an inadequate measure of risk and that there was a need for additional measures. Beaver and Manegold (1975) pointed out that the beta concept was an ex ante concept, while betas are measured from ex post return data; hence measured betas are subject to error. Given that, the debt-equity ratio is more current than beta, being calculated on a yearly basis. If a positive relationship exists between share returns and leverage, based on the principle of risk being equal to return, leverage can be used as a measure of risk if no other measure is available.
Both Beaver, Kettler and Scholes (1970) and Elgers and Murray (1982) investigated the relationship between accounting measures for risk (such as the debt-equity ratio) and market measures for risk as represented by beta. In all the cases, accounting data provided a superior forecast of the market-determined risk measure for the periods studied. This provides tangible proof that accounting data can lead to an improvement in prediction at the level of the individual decision-maker. Accounting risk measures can therefore be applied to decision-setting when market-determined risk measures are not available.
According to observations by Elgers and Murray (1982), accounting researchers have extensively studied the relationship between beta and various accounting risk measures in order to determine the ability of such measures to give an indication of company-specific risk and to assess the possible usefulness of accounting risk measures to develop beta estimates. Bhandari (1988) suggested that leverage, in the form of the debt-equity ratio, was a natural proxy for the risk of common equity of a company. Based on the principle of the risk/return argument, one would expect a positive relationship between leverage and share returns if investors are risk averse. This study focuses on the use of leverage to evaluate the potential returns that can be expected from a company's shares.
It has been proved that there is value in looking at leverage when evaluating risk, because the risk of debt is that it increases the variance of returns (Arditti, 1967). Ruefli, Collins and LaCugna (1999) indicate that high levels of debt are an indicator of increased risk in a company. Garlappi and Yan (2011) underscore the importance of financial leverage to understanding a broader set of cross-sectional properties of both share and bond returns. For that reason, the debt/equity ratio can be seen as an indicator of the level of risk a company is facing. As a company's debt-equity ratio increases, so the risk borne by the shareholder increases and the expected utility of the investment decreases. The only way in which the investment can retain its appeal for the shareholder is for the expected utility of the investment to increase, or at least remain constant. For this to occur, the expected or required return from the investment must increase.
The findings by Beaver, Kettler and Scholes (1970) are confirmed by Hamada (1972), who observed that a significant amount of the observed systematic risk of ordinary shares can be explained by the financial risk taken on by companies through the use of debt. This means that leverage does play a considerable role. The effect of leverage on share returns makes sense if one considers that the prices of shares are the net result of the decision processes of the entire investor community. Share prices are also the ultimate decision variables that determine both the return and the risk an investor incurs while holding a share. The process is like a circle or a loop: decisions by the investor affect share value and the actions of the company, while the actions of the company and the value of its shares, in turn, affect the actions of the investor.
These findings correlate with the findings by Jarvela, Kozyra and Potter (2009), who concede that there is a need for accounting information in capital markets. For CAPM to be effective, it is assumed that investors in the market are rational and risk-averse, and are privy to all the information in the market with instant reaction times according to the efficient market hypothesis (EMH). The EMH reflects ideal circumstances, but, in reality, the proper evaluation of information and the use of estimates are required. Accounting data is available for investors to assess information about a company in which they are interested, albeit not necessarily at the time they need it.
Taking into account that the results obtained by Beaver, Kettler and Scholes (1970) are applicable in ideal conditions; the effects can be at least partly used in a real-world application. The findings are useful for two reasons (Jarvela, Kozyra & Potter, 2009):
- it means a forecast of accounting data can be used to forecast beta; and
- accounting data can be used as a replacement if beta is not available.
2.2 Findings related to leverage and share returns
Numerous scholars have researched the relationship between leverage and share returns, but with inconsistent results. One of the first researchers to observe a positive relationship was Bhandari (1988), who indicated that beta is not an adequate measure for risk and suggested that other factors should be considered together with beta to improve its worth. Bhandari suggested that the debt-equity ratio be used as a natural proxy if beta was not worthy and found that there was a positive relationship between leverage and share returns. The same positive relationship between leverage and share returns was reported by Fama and French (1992), as well as by Gomes and Schmid (2010).
A number of other researchers have found a negative relationship between leverage and share returns. Penman, Richardson and Tuna (2007) state that leverage is negatively associated with future share returns. Even though rational models of capital structure assume that adding financing leverage to operating risk should be rewarded with higher return, Penman et al. found that market leverage correlates negatively with subsequent returns. The same observations were made by George and Hwang (2010), Garlappi and Yan (2011) and Obreja (2013).
All the studies mentioned above were conducted in the United States of America, using information from the New York Stock Exchange (NYSE). However, this study focuses on a particularly relevant one, that by Brümmer and Wolmarans (1995). Their study was based on a study by Bhandari (1988), but it was conducted in a South African setting. Brümmer and Wolmarans found a negative relationship between leverage and share returns. This means that the South African market community in 1995 may have been so averse to risk that increased risk resulted in a decrease in the market value of shares. However, since 1995, many changes have affected the South African market.
2.3 Factors that affected the economic environment in South Africa
The legislative amendments made to the JSE in 1995 resulted in its deregulation, with the introduction of limited liability corporate and foreign membership. The South African Institute of Stockbrokers was formed to represent, train and set standards for the qualification of stockbrokers. In 1996, trading was centralised and automated. Dual trading capacity and negotiated brokerage were introduced. Another major change affecting the availability of information was the introduction of SENS (Securities Exchange News Service), a real-time news service for the dissemination of company announcements and price-sensitive information (Johannesburg Stock Exchange, 2014). SENS ensures early and wide distribution of all the information that may affect the prices of the securities that trade on the JSE.
The new Insider Trading Act of 1998 was introduced, consequent on recommendations by the King Committee on Corporate Governance as appointed by the Institute of Directors. The JSE also established, in collaboration with South Africa's four largest commercial banks, an electronic settlement system (STRATE) so that the process for settling securities listed on the JSE electronically can be carried out on a continuous, contractual and guaranteed basis.
By 2002, all the listed securities were successfully migrated to the STRATE electronic settlement environment. The JSE has a zero-failed trade record, indicating an improvement in market integrity and representing a major milestone in winning both local and international investor confidence (Johannesburg Stock Exchange, 2014). The JSE also introduced the London Stock Exchange's (LSE) LMIL system, known in South Africa as InfoWiz, to provide a world-class information distribution system and improve the distribution of real-time market information (Mhlanga, 2013). The introduction of JSE SETS also represents a strategic alliance forged with the LSE, which has improved the international visibility of the JSE.
The JSE took an important step forward in its campaign to modernise its operations with the launch of a free float indexing system in conjunction with FTSE, namely the FTSE/JSE African Index Series (Johannesburg Stock Exchange, 2014; Mhlanga, 2013). This has enhanced the investment potential of South African shares by providing foreign investors with an indexing system with which they are familiar. In 2004, the JSE launched the Socially Responsible Investment (SRI) Index, which measures compliance by companies with triple bottom-line criteria regarding economic, environmental and social sustainability (Mhlanga, 2013). Finally, in June 2006, JSE Ltd was listed on the Main Board.
Apart from the specific changes that took place on the JSE, South Africa also experienced changes in its political, economic and governmental framework. In 1994, South Africa held its first democratic election, which significantly changed the political scene. A new democratically-elected government came to power and economic policies and legislation changed. International investment was encouraged and South Africa then entered the international arena.
3 Method
The principle of the interrelatedness of risk and return suggests that there should be a linear relationship between share returns and leverage and other measures of risk. The objectives of this study are to deliver evidence that:
- expected common share returns are linearly related to leverage and other forms of risk; and
- the relationship between share returns and leverage is positive.
For the empirical test, a methodology was used similar to that of the studies by Bhandari (1988), and Brümmer and Wolmarans (1995). In order to test the relationship between share returns and leverage, the method described in the next section was followed.
3.1 Statistical model
The empirical findings by Bhandari (1988) and Brümmer and Wolmarans (1995) suggest that the expected common share returns should be linearly related to beta and the total value of common equity. This study proposes, as a first approximation, that the expected common share returns are linearly related to the debt-equity ratio. As a second approximation, an analysis could be conducted to determine whether the relationship is positive or negative.
In order to accomplish the research objectives, the study made use of a multiple regression model, comparing for each of the 107 companies (i) over a period of 10 years (t) common equity, beta and leverage, as follows:

Where
E(Rit) = return on a share
Xo = the intercept on the y-axis
X1LTEQit = logarithm of the monetary value of total shareholders' equity
Χ2βUίt = unlevered beta
Χ3βLίt = levered beta
X4DERit = the debt/equity ratio of each company
The return on a share is determined in three ways: the actual yearly return per share; the required return based on levered CAPM and the required return based on unlevered CAPM. The calculations are explained below.
3.2.1 Actual share return (AR)
The actual share return is the actual return on a company's share, calculated over a year. The equation is as follows:

Dividends are not taken into account when calculating the share return in order to derive a 'pure' return on the share price alone.
3.2.2 Levered and unlevered beta (βUi and βLi) as well as the required rate of return based on CAPM using levered and unlevered beta (KeUi and KeLi)
Beta shows how the price of a share reacts to market forces. This is found by relating the historical returns of a share to the historical returns of the market (Brümmer, n.d.). This is done by regression of the share returns against the market returns.
When calculating the beta, there are three variables to take into account:
- The historical period over which the calculation is going to be done, that is, five three, one or even ten years. From a statistical point of view, the longer the period, the more data points will be used in the regression and the better the statistical fit. It must be remembered that the beta is simply the slope of the regression line.
- The frequency, that is, weekly, bi-weekly, four weekly (monthly) or even the daily returns used in the regression analysis.
- The proxy for the market that will be used, that is, overall, industrial or any other index.
In addition, beta, which is normally calculated by using levered values, can be adjusted for financial risk. This is done by means of an equation that removes from beta the effect of debt on the risk level of a company.
The levered and unlevered required rates of return are calculated by using the CAPM formula:

To derive a levered and an unlevered required rate of return, the levered and unlevered betas are used respectively in the same equation.
3.2.3 Debt-equity ratio (DERj)
The debt-equity ratio (denoted as DER in the equation) is calculated at accounting year-end as:

The formula for DER as denoted above was selected only because it was used by Brümmer and Wolmarans (1995). The author recognises that this is not a pure accounting measure, as is explained in Section 2.1. Under ordinary circumstances, the book value would have been used as a more independent variable relative to market return.
3.2.4 Long-term equity (LTEQi)
LTEQ is calculated as the logarithm of total shareholder equity, which is calculated as the total number of shares at year-end multiplied by the share price at year-end to derive a monetary value. The natural log transformation is used in order to induce normality and stabilise variances
3.3 Defining the sample
The sample was constructed according to all the companies that trade on the JSE. To create a representative sample, all the shares from the All Share Index were selected. The analysis was performed for the period 2002 to 2012.
The McGregor BFA was chosen as the source of financial data because of its reliability. Both the market and the accounting risk measures were readily available, thereby also reducing the data collection necessary for performing the analysis. The consistency of the source for financial information also ensured that the measurements retrieved were calculated uniformly. It is difficult to approximate the bias that may have come into play when constructing and choosing the sample in this fashion, but it is believed that this sample is an adequate representation of the population.
Companies that were not listed on the JSE over the entire period or that did not have the required data for the ten-year period were eliminated from the analysis, leaving a sample of 107 companies.
To test the validity of the data to be used in the statistical model, tests are first performed for linearity and normality. All the tests were conducted at a five per cent significance level.
4 Results
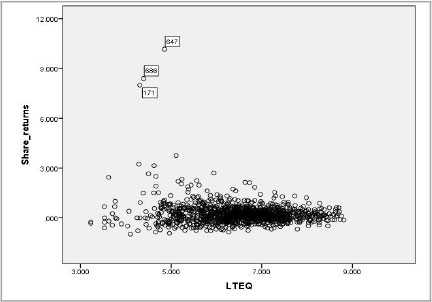
The data set was put through a rigorous pre-test to determine the validity of the statistical analysis to be performed. The data set failed this initial set of tests. There is no indication of normality or linearity between any of the variables. The following graphs represent scatter plots that were prepared to test for and indicate the presence of a linear relationship between share returns and the different variables that are perceived risk measures. Graphs for only a selection of relationships are reproduced here.
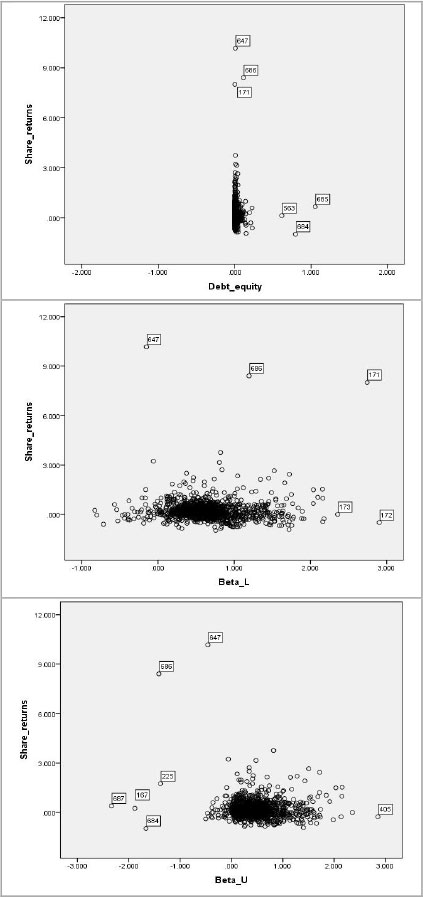
The following scatter plots indicate that the same non-linearity can be observed if the graphs are prepared on a per-year basis between two variables.
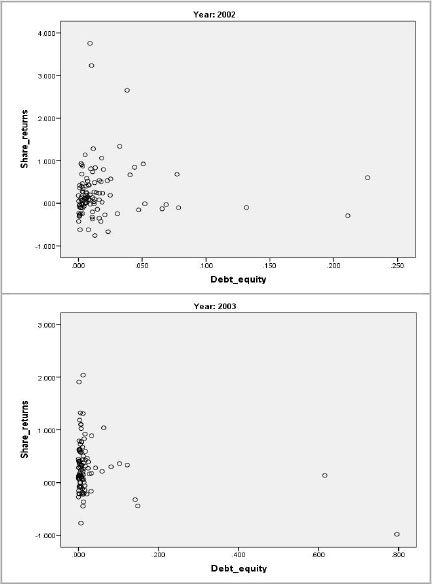
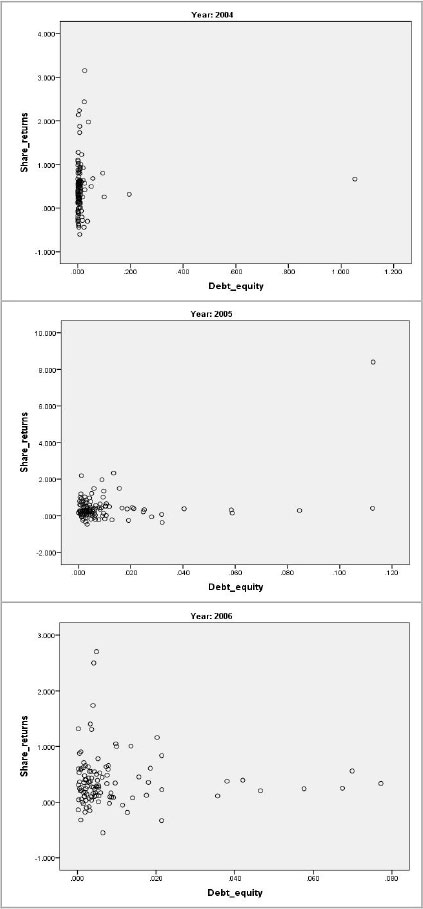
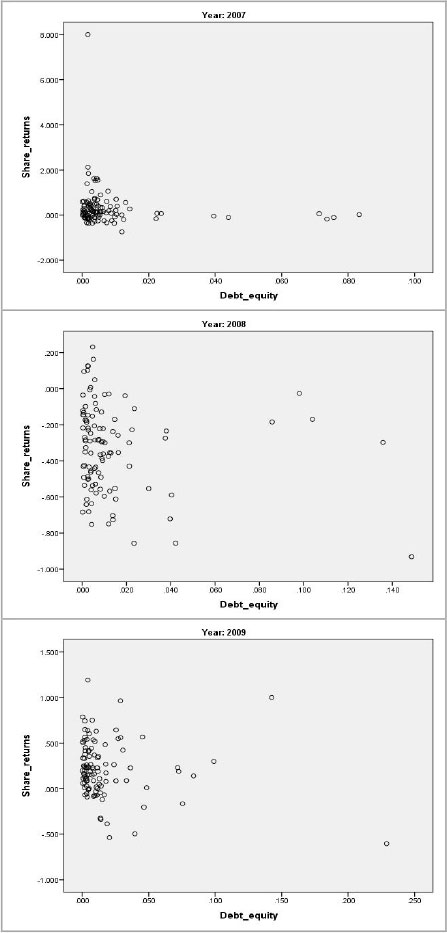
The non-linearity of the data is a clear indication that there is no linear relationship between the variables, implying that regression analysis is not a feasible statistical test, as there is no relationship or correlation between share returns and the financial measures that are perceived to be risk measures. Similar tests were performed for Unlevered CAPM and Levered CAPM with the same results of nonlinearity. In the interest of space, the graphs are not reproduced here.
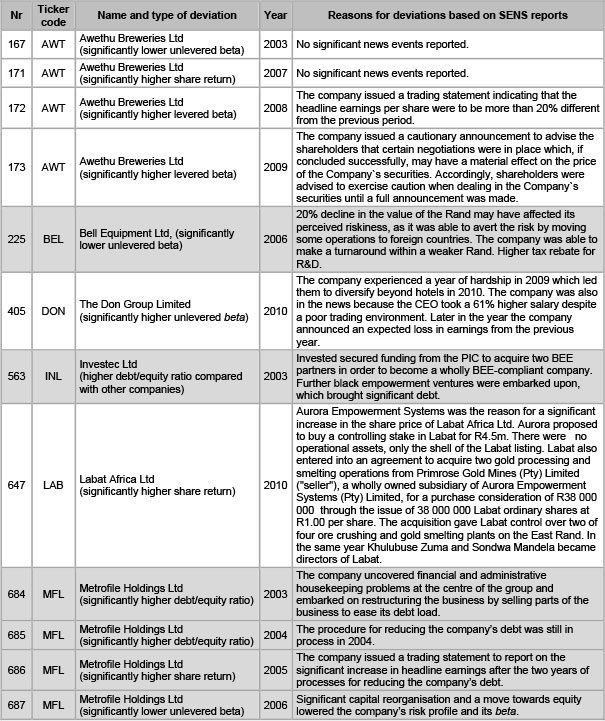
From the first set of graphs, the reader can observe certain deviations in share price when they are compared with the rest of the data set. In the reader's interest, these line items were individually analysed to determine the reason for the deviation. The outcome was, for the most part, clear from the SENS that were released for the companies in the year under investigation. The individual companies and the reasons for the deviations are as follows:
Even though they represent deviations from the perceived "norm", none of these items had a significant effect on the outcome of the tests for linearity.
Patterns can be observed for some of the graphs. This can be investigated to determine whether there are any other conclusions to be reached in terms of the relationship between risk and return.
5 Conclusion
It was necessary to revisit the study by Brümmer and Wolmarans (1995) for a number of reasons. The most important of these can be summarised as:
- Markets have become more sophisticated owing to developments over time;
- The South African market can be perceived to be more sophisticated in a new political landscape;
- The article by Brümmer and Wolmarans (1995) was published in Afrikaans, limiting its use by a wider, perhaps international, audience.
In the introduction, it was asserted that the debt-equity ratio and other financial risk factors ought to correlate positively with the risk associated with ordinary shares and that the debt-equity ratio can be used in conjunction with beta and other risk measures as proxies for the risk inherent in the ordinary shares of a company. However, that is not the case when it comes to the sample of 107 companies listed on the Johannesburg Stock Exchange from 2002 to 2012. There seems to be a negative relationship between leverage and the return on ordinary shares.
After testing for linearity and indicating that there was no linear relationship between any of the variables, the results prove or disprove the hypotheses as follows:
H1A: Expected common share returns are not linearly related to any form of risk.
H0B was not addressed any further, seeing that H0Aproved false. The conclusion to be derived from the analyses is that no linear relationship exists between share returns and any of the variables in the statistical model. This means that the statistical model cannot be developed, tested or analysed any further without casting doubt on the integrity of the results.
The results in this study could derive from a number of factors but, as stated by Brümmer and Wolmarans (1995), it may firstly be the result of market participants being so averse to risk that any indication of increased risk results in a decrease in the market value of shares. A second factor may also be the presence of too many variables influencing the market returns of the Johannesburg Stock Exchange. However, the outcome could also be a combination of these two factors.
References
ARDITTI, F.D. 1967. Risk and the required return on equity. The Journal of Finance, 22(1):19-36. [ Links ]
BEAVER, W. & MANEGOLD, J. 1975. The association between market-determined and accounting-determined measures of systematic risk: Some further evidence. Journal of Financial & Quantitative Analysis, 10(2):231-284. [ Links ]
BEAVER, W.H., KETTLER, P. & SCHOLES, M. 1970. The association between market- determined and accounting-determined risk measures. The Accounting Review, 45(4):654-682. [ Links ]
BHANDARI, L.C. 1988. Debt/equity ratio and expected common stock returns: Empirical evidence. The Journal of Finance, 43(2):507-528. [ Links ]
BODIE, Z., KANE, A. & MARCUS, A. 2010. Investments. (9th ed.) Columbus: McGraw-Hill. [ Links ]
BRÜMMER, L.M. & WOLMARANS, H.P. 1995. Die verhouding van skuld tot eienaarsbelang en die verband met die verwagte opbrengskoers op gewone aandele. Meditari, 3:17. [ Links ]
BRÜMMER, L.M. N.d. Financial models: Understanding the capital asset pricing model (beta). McGregor BFA: Johannesburg. [ Links ]
CONINE JR, T.E. & TAMARKIN, M. 1985. Divisional cost of capital estimation: adjusting for leverage. Financial Management, 14(1):54-58. [ Links ]
ELGERS, P.T. & MURRAY, D. 1982. The impact of the choice of market index on the empirical evaluation of accounting risk measures. The Accounting Review, 57(2):358-375. [ Links ]
FAMA, E.F. & FRENCH, K.R. 1992. The cross-section of expected stock returns. Journal of Finance, 47(2): 427-465. [ Links ]
GARLAPPI, L. & YAN, H. 2011. Financial distress and the cross-section of equity returns. Journal of Finance, 66(3):789-822. [ Links ]
GEORGE, T.J. & HWANG, C. 2010. A resolution of the distress risk and leverage puzzles in the cross section of stock returns. Journal of Financial Economics, 96(2010):56-79. [ Links ]
GOMES, J. & SCHMID, L. 2010. Levered returns. Journal of Finance, 65(2):467-494. [ Links ]
HAMADA, R.S. 1972. The effect of the firm's capital structure on the systematic risk of common stock. Journal of Finance, 27(2):435-452. [ Links ]
JARVELA, M., KOZYRA, J. & POTTER, C. 2009. The relationship between market- and accounting- determined risk measures: Reviewing and updating the Beaver, Kettler, Scholes (1970) study. College Teaching Methods & Styles Journal, 5(1):1-9. [ Links ]
JOHANNESBURG STOCK EXCHANGE, South Africa. 2014. JSE Overview. Available at: https://www.jse.co.za/about/history-company-overview [accessed 2014-10-22]. [ Links ]
LAMBRECHTS, I.J. 1990. Finansiële bestuur. Pretoria: Van Schaik. [ Links ]
MHLANGA, D. 2013. Johannesburg Stock Exchange history. Available at: http://www.property24.com/articles/johannesburg-stock-exchange-history/16977 [accessed 2014-10-23]. [ Links ]
OBREJA, I. 2013. Book-to-market equity, financial leverage, and the cross-section of stock returns. The Review of Financial Studies, 26(5):1146-1189. [ Links ]
PENMAN, S.H., RICHARDSON, S.A. & TUNA, I. 2007. The book-to-price effect in stock returns: Accounting for leverage. Journal of Accounting Research, 45(2):427-467. [ Links ]
RUEFLI, T.W., COLLINS, J.M. & LACUGNA, J.R. 1999. Risk measures in strategic management research: Auld lang syne? Strategic Management Journal, 20(2):167. [ Links ]
Accepted: November 2014

