


Services on Demand
Article
 English (pdf)
 Article in xml format
 Article references
Indicators

Related links
-
 Cited by Google
 -
 Similars in Google
Share

 Permalink
South African Journal of Economic and Management Sciences
On-line version ISSN 2222-3436
Print version ISSN 1015-8812
S. Afr. j. econ. manag. sci. vol.18 n.2 Pretoria 2015
http://dx.doi.org/10.17159/2222-3436/2015/v18n2a4
ARTICLES
Gender-based discrimination in South Africa: A quantitative analysis of fairness of remuneration
Renier SteynI; Leon JacksonII
IGraduate School of Business, UNISA
IIPotchefstroom Business School
ABSTRACT
Equity is important to most individuals and its perceived absence may impact negatively on individual and organisational performance. The concept of equity presupposes fair treatment, while discrimination implies unfair treatment. The perceptions of discrimination, or being treated unfairly, may result from psycho-social processes, or from data that justifies discrimination and is quantifiable.
OBJECTIVES: To assess whether differences in post grading and remuneration for males and females are based on gender, rather than on quantifiable variables that could justify these differences
METHOD: Biographical information was gathered from 1740 employees representing 29 organisations. The data collected included self-reported post grading (dependent variable) and 14 independent variables, which may predict the employees' post gradings. The independent variables related primarily to education, tenure and family responsibility
RESULTS: Males reported higher post gradings and higher salaries than those of females, but the difference was not statistically significant and the practical significance of this difference was slight. Qualification types, job specific training, and membership of professional bodies did not affect post grading along gender lines. The ways in which work experience was measured had no influence on post grading or salary for either males or females. Furthermore, family responsibility, union membership and the type of work the employees performed did not influence the employees' post grading. The only difference found concerned the unfair treatment of males, particularly those who were well-qualified
CONCLUSIONS: Objective evidence of unfair gender-based discrimination affecting post grading and salary is scarce, and the few differences that do occur have little statistical and practical significance. Perceptions of being discriminated against may therefore more often be seen as the result of psycho-social processes and are not necessarily the result of justifiable differences in education, tenure and family responsibility.
Key words: gender, discrimination, fairness, remuneration, South Africa
1 Introduction
Unfair gender-based discrimination is unlawful in South Africa. This is set out in the South African Employment Equity Act (EEA), which states that no person may unfairly discriminate, directly or indirectly, against an employee in any employment policy or practice, on one or more grounds, including race, gender, pregnancy, marital status, family responsibility, ethnic or social origin, colour, sexual orientation, age, disability, religion, HIV-status, conscience, belief, political opinion, culture, language or birth (RSA, 1998). The EEA states, with specific reference to gender discrimination, that this type of discrimination may refer to any distinction, exclusion or restriction made on the basis of sex, including pregnancy, marital status, domestic or family responsibilities which are aimed at or have the effect of impairing or nullifying the recognition, enjoyment or exercise for women or men. The authors of the act then state that this definition of recognition, enjoyment or exercise specifically includes employment opportunities.
Discrimination in the South African context can also be fair, which is stated as "not unfair discrimination" in the EEA (RSA, 1998:8). Discrimination is fair when it is the result of affirmative action measures or when measures "distinguish, exclude or prefer a person on the inherent requirement of a job or a situation" (RSA, 1998:8). Affirmative action and specific job requirements therefore constitute legally valid reasons for discrimination.
The fact that discrimination is legal, or is based on legal grounds or job-specific requirements, does not negate the fact that some individuals perceive discrimination to occur in the workplace. Adams' (1963) equity theory is relevant in this respect. The theory, with roots in cognitive dissonance theory, exchange theory (see Luthans, 2011) and social comparison theory (see Moorhead & Griffin, 2014), states that discord occurs when "a person perceives that the ratio of his or her outcomes to inputs and the ratio of a relevant others' outcomes and inputs are unequal" (Luthans, 2011:170). "The person's assessment of inputs and outputs for both self and others is based partly on objective data (for example, the person's own salary) and partially on perceptions (such as the relevant-other's level of recognition)" (Moorhead & Griffin, 2014:102). In the workplace, certain inputs and outputs are likely to be considered relevant by most of the individuals in that setting (Hollyforde & Whiddett, 2002). Experience, skills and seniority are listed as examples of workplace inputs, whereas pay, benefits and job satisfaction are seen as examples of outputs by Hollyforde and Whiddett (2002). It is worth noting that Luthans (2011) includes gender (which he refers to as sex), as an input variable, along with age, education, social status, organisational position, qualifications and how hard the person works. Luthans (2011) states further that outcome variables consist primarily of rewards like pay, status, promotion and intrinsic interest in the job. Moorhead and Griffin (2014) refer to very similar input and outcome variables. They cite education, experience, effort and loyalty as input variables and pay, recognition, social relationships and intrinsic rewards as outcomes. There seems to be reasonable consensus among all in the workplace as to what constitutes workplace inputs and subsequent compensatory outcomes. In many ways, the equity theory complements the just-world theory (Lerner, 1980), which, in its simplest form, states that people expect to obtain what they deserve, and expect others to deserve what they (the others) get (Myers, 2008), because the world is just. Social comparison and the input-outcome ratio also seem to be at play in the just-world theory.
The aim of this research was to gather information and report on the workplace inputs and outputs that may be used when males and females compare themselves with each other and that may contribute to dissonance (disequilibrium) and feelings of discrimination in the workplace. Operationalised, the aim was to assess whether the differences in post grading and remuneration of males and females are based on gender, rather than on quantifiable variables, which could justifiably account for these differences. Should differences in post grading and salary be based on gender rather than on just and quantifiable variables, the perceptions of gender-based discrimination would be valid.
2 Literature
When it comes to gender-based discrimination in wages, salaries and earnings, these are often discussed under the heading of the gender wage gap. Some researchers suggest that there is no significant gender-based wage discrimination (Deininger, Jin & Nagarajan, 2013). Others find that salary differences exist, but there is no evidence (Gravelle, Hole & Santos, 2011; Nadeau, Walsh & Wetton, 1993) or else there is weak evidence of gender discrimination (Gravelle et al., 2011). Some researchers (see Stanley & Jarrell, 1998) maintain that there is considerable agreement on the existence of gender wage discrimination, but say that the estimates of its magnitude vary widely. In general, the male gender has been associated with higher salaries (Shainbrook, Roberts& Triscari, 2011).
Regarding extent of the gender wage gap, it is estimated to be approximately 30 per cent (Kara, 2006). An American demographic study shows that women working full-time with two or fewer years of experience earn 72 per cent of what men with the same experience might earn (Isaacs, 1995). The difference in income and wages is worth noting. The income of female family doctors in the United Kingdom is 70 per cent of that of their male counterparts and their wages (hourly income) constitute 89 per cent of male doctors' wages (Gravelle et al., 2011). Meta-regression analysis reveals that the estimated gender gap has been steadily narrowing (Stanley & Jarrell, 1998). However, women consistently earn less money than men in almost every industry (Isaacs, 1995). Louis, Alexandros and Konstantinos (2013) reported on the gender wage gap in 26 European countries, taking into account the annual earnings and hourly wages. In all these countries, women earned less than men, and in only two countries did women report higher wages than those of men. South African research (Haroon & Sumayya, 2013) reported that in 2007 the ratio of the average female to male wages for those in the sample stood at 82.2 per cent.
When estimating the wage gap, it is crucial to calculate the wage rate (Stanley & Jarrell, 1998). Many factors other than gender may contribute to this. Kara (2006) states that it is important to control for education, experience, occupation, region and the selection effects when considering discriminatory wage data. Pudney and Shields (2000) state that models developed should include estimates of the influence of gender, ethnicity, training and career interruptions. Shainbrook et al. (2011) showed that the years of experience, the educational level, certification and the gender elements all relate to salary.
The influence of most of these factors will be discussed shortly. However, Isaacs (1995) states that the salary gap is found even in studies that equate someone's years of experience, their level of education and the industry (Isaacs, 1995). The extent of this adjusted wage gap varied between 12 and 15 per cent of the average male wage up to 1989, after which the size of the gap increased to approximately 14-18 per cent (Johansson, Katz & Nyman, 2005). Some estimates are a little lower, in the region of 11.5 per cent (Solberg, 1999).
Factors linked to the above, the EEA and authors discussing equity theory (Adams, 1963) provide some guidelines on the variables which may be used as input and outcome variables when situations are evaluated in terms of equity theory. The EEA refers to matters like gender, pregnancy, marital status and domestic and family responsibility (possible inputs), which may impair or nullify the recognition, enjoyment or exercise of women or men. These include employment opportunities (possible outcomes). The EEA also cites the inherent requirements of a job or a situation (RSA, 1998) which can be regarded as an input variable. Luthans (2011), discussing equity theory, includes as input variables gender, age, education, social status, organisational position, qualifications and how hard the person works, while Hollyforde and Whiddett (2002) list experience, skills and seniority as examples of workplace inputs. Outcome variables in the workplace consist primarily of pay, status, promotion and intrinsic interest in the job (Luthans, 2011), as well as benefits and job satisfaction (Hollyforde & Whiddett, 2002). Similar inputs and outcomes are mentioned by Moorhead and Griffin (2014).
Given the aforementioned similarities in the literature and the parallels found between the given literature and the legislation, the following discussion emphasised the roles of education, work experience and family responsibility (as input variables) on the position of women, particularly on the post level and salary (as outcome variables).
2.1 Gender, education and workplace outcomes
Several authors report on how education differentially influences workplace outcomes along gender lines. The earning trajectory is a function of education (Ornstein, 2011), and the level of education of business owners relates positively to their ability to increase business growth (Brijlal, Naicker & Peters, 2013).
Differences in the educational requirements for jobs, and the education traditionally afforded to women have contributed considerably to gender earning inequality (Johansson et al., 2005; Solberg, 2004). Policy-makers should promote women's education, as education reduces the inequalities between genders. This is demonstrated by the narrowing gap in wage differentials for higher levels of education (Kara, 2006).
Education is important, but it is not adequate in creating gender equality. Yamauchi and Tiongco (2013) report evidence supporting the notion that females, particularly young women, are advantaged by education. However, when employed, they tend to suffer disadvantage in the labour markets, as was observed in the Philippines. Furthermore, not all education is equally beneficial to women. Gender inequality in annual earnings is less extreme among the well-educated than among those with less education (England, Gornick & Shafer, 2012). Addabbo and Favaro (2011) also show the extent of the differences in the gender wage gap in cases of diverse educational levels. In the case of less-educated workers, lower levels of education or less experience are deemed responsible for the wage gap. On the contrary, highly-educated females have better opportunities than highly-educated men, with high differences in returns, particularly at the extremes of the distribution.
The gender wage gap narrows with education (Kara, 2006). Shainbrook et al. (2011) showed that higher degrees, but not first degrees, are positively associated with higher salaries. These gender differences are robust when various estimation procedures are used and are particularly pronounced when it comes to more educated workers (Munasinghe, Reif & Henriques, 2008). Although education is important, the differences between women and men in job selection and qualifications can account for only between two-fifths and three-fifths of the gender wage gap (Johansson et al., 2005).
2.2 Gender, age, tenure, work experience and workplace outcomes
Several authors demonstrate how age can differentially influence workplace outcomes along gender lines. Ornstein (2011) showed that age was not an important factor in women's earnings before 1970. Between 1970 and 1980 women's earnings increased dramatically, and now the current age-income trajectory resembles that of men. Petit (2007) found significant hiring discrimination against young women (aged 25) applying for highly-skilled administrative jobs. According to Petit, young men are preferred to young women when it comes to employers offering long-term contracts. This discrimination may be on account of perceived future family constraints. The bias may be unjustified, as Petit (2007) found no further significant gender-based hiring discrimination practices among older single and childless applicants (aged 37). There was also no gender-based discrimination when male and female applicants who were single and childless or married with three children were compared. Shainbrook et al. (2011) showed that years of experience and gender relate to salary, and greater bias is likely when researchers omit experience or fail to correct for selection bias (Stanley & Jarrell, 1998). The median tenure in the United States of America from 1983 to 2002 was higher for men than for women (Anon, 2002). When considering all the female life stages, except for the 65 years+ bracket, women have a lower median tenure than that for men (Anon, 2006). Shainbrook et al. (2011) found that five or more years' experience (but not two to five years' work experience) at a particular organisation is positively associated with higher salaries. Ioakimidis (2012:31) found "that the wage gap and tenure were found to be positively correlated for approximately the first five years of within-firm employment, after which the correlation was near zero".
Sloane and Theodossiou (1993) examined the effect of gender and job tenure on earnings in the United Kingdom. The basic hypothesis is that earnings correlate positively with tenure. The results were consistent with the differential lifetime labour force behaviour of men and women. Similarly Munasinghe et al. (2008) present empirical evidence on gender disparities in wage returns relating to job tenure and experience. They found that the overall wage return on an extra year of labour market experience is lower for women than for men. A decomposition analysis shows that the wage return for job tenure is substantially lower for women than for men, and that the wage returns for experience are higher for women than for men. Ioakimidis (2012) similarly found that the returns for tenure were greater for men than for women, with a statistically significant breakpoint at the seven-year mark for men.
There are at least two explanations for the importance of tenure of experience to salary. The first is provided by Sloane and Theodossiou (1993), who argue that "the positive relationship between earnings and tenure is the result of either unobserved individual or job/firm match heterogeneity arising from the fact that higher earnings could reflect the quality of the employee-job or employee-firm match, which in turn induces longer tenure" (1993:421). Thus, while earnings depend on tenure, tenure depends on earnings, individual characteristics and job/firm characteristics. Secondly, Munasinghe et al. (2008) hypothesise that these observed gender disparities in wage returns are driven by the fact that women are less attached to their jobs than men are. The authors present some supportive evidence for their hypothesis that women are more likely to quit their jobs, or receive substantially fewer hours of company-provided training. A much higher fraction of women expects not to be working at age 35 for family-related reasons.
2.3 Gender, family responsibility and workplace outcomes
Several authors report on how family responsibility impacts differentially on workplace outcomes along gender lines. Ioakimidis (2012) attributes the gender wage gap to women's life and work cycles. Bornstein, Williams and Painter (2012) state that mothers and fathers who have caregiver responsibilities experience the strongest forms of discrimination in the workplace. They cite motherhood penalty, maternal wellbeing and the caregiver bias as manifestations of discrimination arising from family responsibilities. Bagraim and Harrison (2013a) found that mothers spend ten more hours of multitasking a week than fathers do, and that these additional hours are related mainly to time spent on housework and childcare. For mothers, multitasking activities are associated with an increase in negative emotions, stress, psychological distress and work-family conflict. By contrast, fathers' home multitasking is not a negative experience. However, it is not only actual work-family conflict that impacts on workplace outcomes for women. The anticipated work-family conflict lies in the belief that the future demands of work and family are going to be incompatible. Moderate differences in anticipated work-family conflict were reported across gender, with females evincing more anticipated conflict (Bagraim & Harrison, 2013b). Among married or cohabiting mothers, the better educated are more likely to be employed (England et al., 2012).
3 Method
In this section, the respondents, the procedure, the measuring instruments, the data analysis and the ethical considerations are discussed.
3.1 Respondents
The respondents in this study were groups of employees who shared a common working domain. Only the employees who were part of a relatively large organisational domain were involved. In order to qualify for inclusion in the study, the organisational domain had to have a diverse workforce of at least 30 male and 30 female employees. Furthermore, at least 30 respondents from each gender had to be willing to participate in the study. This requirement excluded senior executives or top managers, as in most cases these groups would not meet the specified domain size requirement, unless entire, very large organisations were targeted. The organisations approached were those to which students, enrolled in the Master of Business Leadership programme at the Unisa Graduate School of Business Leadership, had access, because they were employed in the organisations. These present a convenient sample (Rosnow & Rosenthal, 2008) of South African companies. Employees from 29 companies were approached. The financial service providers (7 organisations), the government (7 organisations) and the mining sector (4 organisations) were the best represented. Other sectors included the hospitality industry, the manufacturing industry and the agricultural sector.
3.2 Procedure
Individual employees in the organisations were recruited to participate in the study, using random selection from a personnel list. Informed consent forms were given to the potential participants and only those who gave consent and who were willing to participate were enrolled. This continued until the data from 30 males and 30 females per organisation had been collected. This was always done randomly and recognising the threat to anonymity. After giving consent, the employees were requested to answer a number of questions, including those applicable to this research. Biographical information was solicited for this research, as well as information on post grading, which is a proxy for salary. After completing the questionnaires, the employees were thanked for their participation and were assured that the data would be treated according to what they had consented to.
3.3 Measuring instruments
Data was gathered by means of a biographical questionnaire. The questions related to general matters like gender and race, but specific questions on education (five questions), work experience (three questions) and family responsibility (two questions) were also posed. The rationale for focusing on these variables was explained in the literature section above. The items are considered to have face and content validity, based on their grounding in variables used in previous research. The following is an example of the questions included in the questionnaire: "What is your gender?" (1) male; (2) female; "Are you registered with a professional body related to your present job?" (1) Yes; No (0). Respondents were asked to report their post grading (salary) according to the system with which they were acquainted and which was followed in their company.
3.4 Data analysis
First, the collected post grading data was converted. The data on post grading in the different companies was, as previously reported, collected on company-specific systems familiar to the employees in that company. All the collected data was converted to a common system, the Equate System, as most data could easily be converted to that format. This was done by using available conversion tables (Bussin, 2011). However, the 16 post gradings and the seven bands of the Equate System would not be very useful in cross tabulations, as the minimum requirements for calculating the Pearson Chi-Square have an expected count of at least five in each cell (Field, 2009; Pallant, 2010). For this reason, four post grading bins were created: Below Level 6; Levels 6 to 9; Level 10; and Level 11, as well as Level 12+. In each case, the term Level refers to the Equate System levels, while binning was done with due consideration of the Equate System bands and the frequency of observed cases. Presenting salary as a continuous variable was also useful. This was done by using the middle salary value in each of the post gradings to represent the salaries of all the respondents on that level (Anon, 2013). In this way, the categorical variable was converted into a continuous variable.
First, descriptive data was presented, continuous data as averages and standard deviation, and categorical data as frequencies. Of particular interest were the descriptive statistics for post grading and salary per gender. Means, standard deviations, kurtosis and skewness were calculated. The statistical mean is a measure of central tendency and the arithmetic average of the data, the standard deviation a measure of the spread or variability of the data dispersion, the kurtosis is a measure of the peakedness or flatness of the distribution, and the skewness is seen as a measure of the distribution deviation from symmetry (Blumberg, Cooper & Schindler, 2011). Regarding kurtosis, for a sample of 200, heavier tails (platykurtic shape) are below a value of -.47 and a sharper peak (leptokurtic shape) is higher than .62 (Doane & Seward, 2009). In the case of a sample of 200 the lower limit for skewness (skewed to the left) is -.281, with the upper limit (skewed to the right) standing at .281. These cut-off scores will be used in the comments on kurtosis and skewness.
T-tests were used to calculate differences in means. When differences were statistically significant (p<.01), effect sizes were calculated. The formula for the Cohen d-value is X1-X2/ sp, where X1 is the mean of the first group (say, males), X2 the mean of the second group (say, females), and sp the pooled standard deviation of both groups (Pallant, 2010). When d is >.8, the difference is practically significant. d Values between .8 and .5 indicate a moderate effect size, while a d statistic <.5 but >.2 indicates a small effect (Cohen, 1988; Steyn, 2000).
The Pearson Chi-Square (χ2) test was used to test whether the rows (say male and female) and columns (high and low pay) of the contingency were dependent. A significant x2-value (p<.01) indicates that the rows and columns are dependent, suggesting gender effects. If they are not significant, the rows and columns are independent. Effect size is reported as Cramer's V (Field, 2009; Pallant, 2010), as this value always varies between 0 and 1, unlike other measures, such as Phi and the contingency coefficient (Field, 2009). When Cramer's V values are larger than .5 the effect is large. When larger than .3, it is considered to be medium, and between .1 and .29, the effect is seen as small (Rosnow & Rosenthal, 2008).
In some cases it was necessary to test whether the association between variables was the same for males and females. As a first step, the Pearson product-moment correlation coefficient was calculated. The Pearson product-moment correlation coefficient is a measure of the covariance, or the association between two variables. For the purposes of this research, all the statistically significant correlations will be reported (p<.01) and correlations where the shared variance is greater than 20 per cent will be interpreted as practically meaningful (Cohen, 1988). For example, when a correlation of r=.13 (p<.01) is reported, the coefficient of determination is R2=.02 (.13x.13=.02), suggesting that the variance shared between the two constructs is only 2 per cent, and is not practically significant compared to the 20 per cent margin set by Cohen (1988). To calculate whether the associations (correlations) differ along gender lines, a strategy suggested by Field (2009) and Pallant (2010) was used. In this case, z-values, corresponding to the correlations, were looked up in a table (see Table, 2013) and inserted into the following formula:
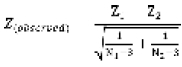
with z1 the z-value for the male correlation, z2 the value for the female group, N1 the size of the male group, and N2 the size of the female group. For the difference in correlation, z(observed) values larger than 1.96, or smaller than -1.96, were considered to be indicative of significant differences(Pallant, 2010).
Regression analysis was also performed. The R2-adjusted (multiply by 100) was interpreted as the percentage of the variance in the dependent variable explained by the model (Pallant, 2010). For example, if R2-adjusted is .108, almost 11 per cent of the variance in the dependent variable is explained by the model. The significance of the standardised beta was also interpreted. If the beta value of any of the independent variables was significant (p<.01), it was interpreted as indicating that the specific variable contributed uniquely and significantly to the variance declared in the dependent variable (Pallant, 2010). When the significance of the standardised beta for any independent variable was larger than .01, it was interpreted as indicating that the specific variable did not contribute uniquely and significantly to the variance declared in the dependent variable.
3.5 Ethical considerations
Several ethical considerations apply in this study. The first is the use of students as fieldworkers. The students benefited from collecting the data, as they can use it when writing their own research report for the Master of Business Leadership degree. A possible second ethical concern could be that students could access respondents in the organisation where they were working, suggesting that they had undue influence over the respondents. This is partially addressed by the requirement that the Chief Executive Officer or Director General would initially have to grant permission to conduct the study (suggesting that the student had no ultimate authority in the setting). Further, the respondents consented to taking part. The informed consent form explains clearly that participation in the survey was voluntary and that all the respondents had given their consent before entering into the study.
4 Results
Descriptions of the respondents are presented first, followed by data on gender differences in post grading and salary. Issues pertaining to gender and tenure, gender and education and gender and family responsibility will be discussed later.
4.1 Respondents
In total, data was captured from 1 740 questionnaires returned by employees from 29 companies. The following are the descriptive statistics for the respondents (missing data is not reported):
- Gender: Female=869 (46.1 per cent); Male=871 (46.2 per cent);
- Age: Mean=37.2; SD=9.2; Youngest=19 years; Oldest 64 years;
- Race: Asian=117 (6.2 per cent); Black=1227 (67.7 per cent); Coloured=99 (5.3 per cent); White=299 (12.1 per cent);
- Define the type of work you do. Support/Admin=556 (29.5 per cent): Management of Support/Admin=340 (18.0 per cent); Core Business/Operations=647 (34.3 per cent); Management of Core Business/Operations=179 (9.5 per cent);
- Number of companies you have worked for since the age of 18: Mean=2.9; SD=1.6; Most=10 companies; Least=1 company;
- Number of years in full-time employment since the age of 18: Mean=13.1; SD=9.1; Longest=45 years; Shortest=1 year (this was a measure of experience);
- Number of years with present employer: Mean=8.1; SD=7.3; Longest=40 years; Shortest=1 year (this was a measure of tenure);
- Years of formal schooling: Less than 12 years=129 (6.8 per cent); 12 years (matric) =30 (22.8 per cent); 1st Degree/Diploma=787 (41.8 per cent); Higher degree/Diploma=383 (20.3 per cent);
- Highest job-specific qualification: 1st Degree/Diploma=954 (50.1); Higher Degree/Diploma =359 (19.0 per cent);
- Area of qualification: BA=217 (11.5 per cent); B.Com=360 (19.1 per cent); BSc=202 (10.7 per cent);
- Did you receive any specialised certified training at this organisation? Yes=864 (45.8 per cent); No=872 (46.3 per cent);
- Are you registered with a professional body related to your present job? Yes=634 (46.3 per cent); No=1100 (58.4 per cent);
- Do you belong to an acknowledged trade union? Yes=861 (45.75 per cent); No=872 (46.3 per cent);
- Marital status: Single=613 (32.5 per cent); Married=948 (50.3 per cent); Divorced=125 (6.6 per cent);
- How many times have you been on maternity leave? (Only females): Mean=.77; SD=.97; Most=5 times; Least=0 times;
- How many children younger than 21 years stay with you in your house? Mean=1.5; SD=1.3; Most=8 children; Least=0 children;
- What is your post grading level? Level 1=16 (.8 per cent); Level 2=40 (2.1 per cent); Level 3=42 (2.2 per cent); Level 4=98 (5.21 per cent); Level 5=82 (4.4 per cent); Level 6=186 (8.9 per cent); Level 7=199 (10.6 per cent); Level 8=215 (11.4 per cent); Level 9=202 (10.7 per cent); Level 10=120 (6.4 per cent); Level 11=121 (6.42 per cent); Level 12=126 (6.6 per cent); Level 13=155 (8.2 per cent); Level 14=110 (5.8 per cent); Level 15=39 (2.1 per cent).
It is clear that a wide variety of respondents, and almost an equal number of males and females, completed the questionnaire.
4.2 Post grading and salary differences per gender
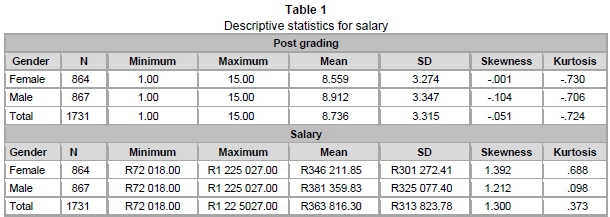
Gender differences in the post gradings and salaries were of particular interest. Descriptive statistics per gender on post gradings and salary are presented in Table 1.
The average post grading, expressed on the Equate System, was 8.736 (SD=3.315). Regarding skewness, all three distributions met the requirements for normality (Doane & Seward, 2009), but when it came to kurtosis, heavier tails (platykurtic shape) were found, as the statistics were lower than the set value of -.47 (Doane & Seward, 2009). Fortunately, these values were very similar for all three distributions. The means for males and females were thus comparable. The difference between the post gradings of males and females was .353, but this difference was not statistically significant (t(1729)=-2.219, p=.027)). Its practical significance was small (d=.10). A similar pattern was found when it came to matters of salary.
The average salary, expressed in South African Rand value, was R363 816.30 (SD= R313 823.78). This amount is almost equal to the average salary for White South Africans (R365 134.00) reported in the 2011 census (Statistics South Africa, 2012a). Regarding skewness, all three distributions were skewed to the right and did not meet the requirements for normality (Doane & Seward, 2009). Fortunately these values were very similar for all three distributions. For kurtosis, a sharper peak (leptokurtic shape), with a statistic higher than .62 (Doane & Seward, 2009), was found for females. Both the male group and the total group met the requirements of normality in terms of kurtosis. The mean difference was reported despite the limitations mentioned, and the difference between the salaries for males and females amounted to R35 147.98. The difference was not statistically significant (t(1729)=-2.333, p=.020)). The practical significance of this difference was small (d=.11).
4.3 Gender, post grading and education
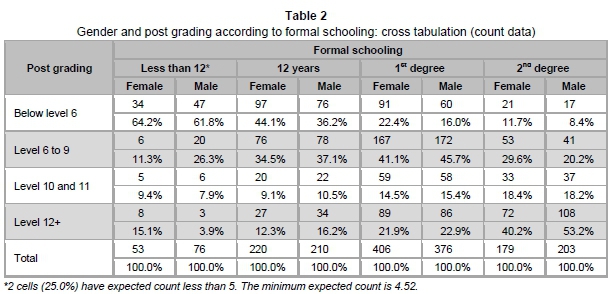
The respondents were asked five questions relating to education, all of which produced categorical data. The first question, while related to education, was specifically about formal schooling. The results are presented in Table 2.
To assess whether gender (columns) and post grading (rows) are dependent, given education (layer), cross tabulations were drawn and the Pearson Chi-Square test was performed. The Pearson Chi-Square values were reported, given 3 degrees of freedom, with asymptotic significance (2-sided) being reported. For those with qualifications of fewer than 12 years, the calculate χ2 value was 8.147 (p=.043). (The results pertaining to qualifications for fewer than 12 years should, however, be treated with caution, as two cells (25.0 per cent) have an expected count of less than 5. The minimum expected count was 4.52.) For 12 years of schooling, the χ2 was 3.243 (p=.356), for a first degree χ2 was 5.355 (p=.148), and for a second degree χ2 was 7.905 (p=.048). It is clear that the rows and columns are not dependent. As such, Cramer's V is not reported.
The same procedure was followed for post grading (rows) and gender (columns) by job specific qualifications. These results are reported in Table 3.
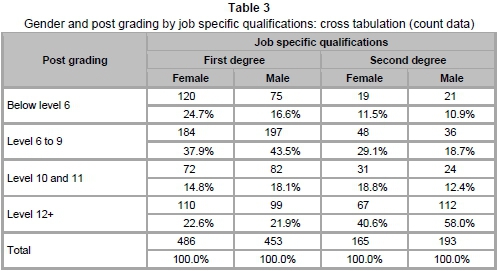
The Pearson Chi-Square value was calculated for each qualification level. In all cases, the degrees of freedom were 3, and asymptotic significance (2-sided) was reported. For respondents with a first degree, job specific qualification χ2 was 10.910 (p=.012) and for a second degree χ2 was 11.901 (p=.008; Cramer's V=.182). In the case of a second degree, gender had a slight effect on post grading. A close look at Table 4 reveals that more males in the Level 12+ group had second degrees, suggesting that males in this grouping were more highly qualified than females holding the same positions.
The same procedure was followed for gender (columns), post grading (rows) and types of qualifications (layer). The cross tabulation is not presented here, as all Chi-Squares calculated using that data were not significant. The same occurred with gender (column) and post grading (rows) when specialised job-specific training (layer) and professional registration (layer) were used. In none of these cases were the rows and columns of the contingency dependent, suggesting the absence of gender effects. In summary: Only having a job-specific qualification, specifically a second degree, influenced post grading, and in such a way that females in the upper post grading groups were less qualified than their male counterparts.
4.4 Gender, post grading and salary per age, tenure and experience
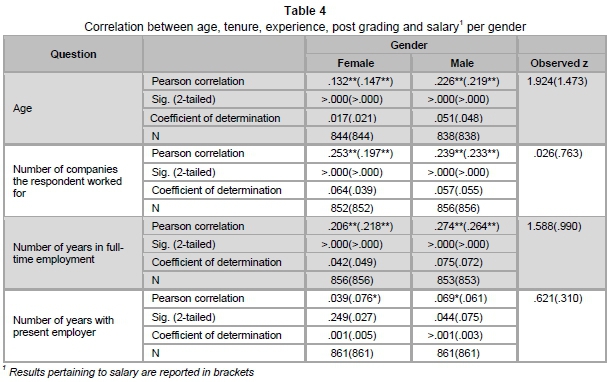
Three questions were asked on tenure and experience. These related to the number of companies the respondent had worked for since the age of 18, the number of years in full-time employment since the age of 18 (experience), and the number of years with the present employer (tenure). All these variables were treated as continued variables. The results in Table 4 reflect the correlation of these variables (and age) with post grading and salary (presented in brackets) per gender.
Table 4 shows that age, tenure and experience correlate, in some cases significantly, with post grading and salary. In the case of males, the number of years in full employment has the highest correlation (r=.274) with post grading, which is significant at the .01 level. This suggests a 7.5 per cent overlap between this variable and post grading, as reflected in the coefficient of determination (.075). Not one of the correlations met the requirement for being practically significant (20 per cent overlap), as set by Cohen (1988). Although none of the correlations met the practically significant criterion, it was still decided to test whether the correlations differed along gender lines, and observed z statistics were calculated. None of the correlations differed significantly from each other along gender lines, as values larger than 1.96 or smaller than -1.96 are considered to be indicative of such differences (Pallant, 2010). The number of years in full employment therefore does not significantly influence post grading or salary along gender lines, and the relationship that exists does not differ along the same lines.
As the four variables mentioned may collectively predict post grading better than when considered individually, a linear regression analysis was performed. The R2-adjusted was .110, with significant beta scores for three variables, excluding age (Standardised beta: age=-.098n/s; Number of companies the respondent worked for=.181, p<.001; Number of years in full-time employment= 3.75, p<.001; Number of years with present employer=-.131, p=.001). The variance in post grading is therefore explained by the tenure and experience variables. Adding the gender variable to the regression improved the model to .111, in other words by .1 per cent. With the latter calculation, the tenure and experience variables had significant betas, but not in the cases of age and gender. This suggests that gender contributes very little to the declared variance.
The same procedure was followed with salary. R2-adjusted was .097, with significant beta scores for all three variables, excluding age (Standardised beta: age=-.082n/s; Number of companies the respondent worked for=.144, p<.001; Number of years in full-time employment= 3.75, p<.001; Number of years with present employer=-.134, p<.001). Almost 10 per cent of the variance in salary is thus explained by the tenure and experience variables. Adding the gender variable to the regression improved the model to R2-being .098. With the latter calculation, the tenure and experience variables had significant betas, in contrast to age and gender.
4.5 Gender and post grading per family responsibility
As previously discussed, writers often point out that marital responsibilities hamper female career development. In Table 5 the results of a cross table with post gradings as rows and gender as columns, with marital status as layers, are presented.
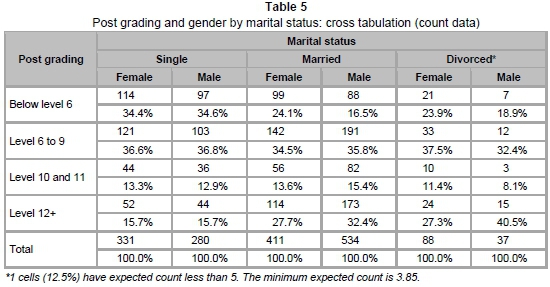
The Pearson Chi-Square values were calculated for each marital status grouping. In all cases, the degrees of freedom were 3 and asymptotic significance (2-sided) was reported. For single respondents, rows and columns were not dependent (χ2=.026; p=.999). The same applied to married respondents (χ2=9.028; p=.029) and divorced respondents (χ2=2.205; p=.531). (The results pertaining to divorced respondents should, however, be treated with caution, as 1 cells (12.5 per cent) have an expected count of less than 5. The minimum expected count is 3.85.) The salaries of males and females therefore do not seem to differ along the lines of marital status.
It is interesting that more males report living in households with children under the age of 21 than females (Mean=1.581; SD=1.371 versus mean=1.336; SD=1.224). The mean difference was .245, and this is statistically significant (t(1705.5)=.919; p<.001). The practical significance of this is, however, small (d=.188). The correlation between the number of children in your care and post grading for males was .065 (p=.058) while for females it was .013 (p=.707). These correlations are small and not significant. When it comes to salary, the number of children in your care correlates significantly with the salary for males (r=.09; p=.008), but not for females (r=.003; p=.930). The correlation is significant for males, but suggests only a .8 per cent overlap between this gender (male) and salary, as reflected in the coefficient of determination of only .0081.
It was previously pointed out that the mean times when females took maternity leave came to .77 occasions (SD=.97), the most times being 5 and the least zero. The results indicate a weak positive and statistically significant correlation between taking maternity leave and post grading (r=.105; p=.003). Add to this that older females are on higher post gradings than younger ones are (r=.132; p<.001), then the reported correlation provides even less direction. When it came to salary, the results were very similar (r=.113; p=.001 and r=.147; p<.001). Given the coefficient of determination, taking maternity leave overlaps 1.1 per cent with post grading and 1.2 per cent with salary. This is a very small overlap.
5 Discussion
The literature showed that gender wage differences exist in most countries. It is also apparent from the literature and relevant quoted legislation that factors such as education, age, tenure and work experience, as well as family responsibility, should be considered when wage differences between those of men and women are discussed and when there are deliberations on fair and unfair gender-based discrimination.
The respondents in this sample represented males and females almost equally, which was to be expected, as the sample was stratified along gender lines. In total, 869 females and 871 males reported their gender.
Most respondents were Black (67.7 per cent), with smaller portions of Coloured (5.3 per cent), Asian (6.2 per cent) and White (12.1 per cent) participants. Given the national demographics, Whites and Asians were somewhat overrepresented, while Coloureds and Blacks were under/represented. The 2011 National Census stated that 79.2 per cent of the population is Black, with 8.9 per cent Coloured, 2.5 per cent, Asian and 8.9 per cent White (Statistics South Africa, 2012b). The representation of Whites in this sample is, however, a good reflection of workforce demographics, where the labour force participation rate "among black Africans is lowest while that among the white population group is highest" (Statistics South Africa, 2012b: 51).
The mean age of the respondents was 37.2 years (SD=9.2). This suggests a relatively mature group of employees. This is echoed in the 13.1 years' (SD=9.1) work experience reported. Here it is important to note that gender-based discrimination is often related to age (Ornstein, 2011) and tenure (Shainbrook et al., 2011) cohorts. This matter is discussed further in the limitations section of the paper.
The respondents were from 29 companies, which included financial service providers, government, the mining sector, the hospitality industry, the manufacturing industry and agriculture. Although they were not representative of all South African organisations, a wide variety of organisations was involved. Those who use this research are nevertheless cautioned to be tentative when making generalisations.
Evidence of gender-based wage differences was found in this selection of South African companies. Males reported higher post gradings (.353 Equate points higher) and salary (R35 147.98 higher) compared with those of females, but the difference was not statistically significant and its practical significance was small. This suggests a numerical but not a statistical or practical meaningful wage gap.
Qualification types, job-specific training and membership of professional bodies systematically did not affect post grading along gender lines. The only difference found indicated the unfair treatment of males, particularly well-qualified males. These results are contrary to those of previous research, which reported that females with high qualifications were particularly advantaged (Addabbo & Favaro, 2011; England et al., 2012). The absence of discrimination against females, and even discrimination against males, may be a function of the Constitution of the Republic of South Africa, which specifically states its aim of creating a society that reflects non-sexism. It may also be owing to the Commission for Gender Equality, which, inter alia, performs the function of monitoring, investigating and lobbying to create gender equality (RSA, 1996). This, coupled with the affirmative action legislation (RSA, 1998; 2000) which advances the position of females, may explain the findings.
None of the three ways in which work experience was measured influenced post grading or salary differently for males and females. The same results were found for age. The results therefore do not reflect gender-based discrimination. Using age and tenure as distinct variables may however be problematic. Age (Ornstein, 2011) and tenure (Shainbrook et al., 2011) affects gender-based wage discrimination per cohort and the linear techniques used in this study, for example, linear regression and Pearson correlations, may be insufficient to describe the relationship. Despite this limitation, it should be emphasised that no gender-based discrimination was found using the techniques employed in this research.
Family responsibility, which included variables like marital status, the number of children, and the number of maternity leaves was used, did not affect employee outcomes along gender lines. These results are contrary to those from some authors (see Bagraim & Harrison, 2013a; Bornstein et al., 2012; Ioakimidis, 2012), who link gender discrimination in the workplace to matters related to family life and responsibilities associated with it. A possible explanation for these results is the role of extended families in caring for children, which is common in South Africa, particularly among Black South Africans (Duflo, 2003). As stated earlier, the majority of the respondents were from the Black community.
6 Conclusion
Objective evidence of unfair gender-based discrimination affecting post grading and salary is sparse, and the few differences that do occur have little statistical and only slight practical significance. Perceptions of being discriminated against may thus rather be seen as the effect of psycho-social processes than the result of verifiable differences in education, tenure, experience and family responsibility. The objectively measured ratios of the outcomes of inputs for males and females seem to be equal, and neither males nor females should, based on these results, perceive that others' outcomes and inputs are unequal to their own. The results provide empirical evidence for the justification of perceptions of gender equity. Employees are therefore urged to assess the inputs and outcomes for both self and others on objective data, rather than on stereotypical perceptions of such ratios or dated research in this regard. Equity persists and the world seems just, as people get what they deserve, and others deserve what they get. It may thus be important to provide employees with statistics like these to prevent perceptions of discrimination, which may, in fact, not exist. This would eliminate the negative effects of such perceptions (Abbas, Athar & Herani, 2010). Judging by these results, it would also seem that the use of South African legislation may indeed have resulted in a fair and just world for South African males and females. The use of legislation seems effective in redressing gender-related disparities (Nel & Steyn, 2012).
The research has some limitations. Although 29 organisations were selected and 1 740 employees were sampled from those organisations, organisation selection was not done randomly. This limited the generalisability of the results. Future researchers are encouraged to apply randomisation to the full. The use of linear statistical techniques, when analysis of cohorts could be more effective, is not recommended. This limitation could be overcome by using non-linear techniques or cohort analysis, which is recommended for future research. The use of post grading to reflect salaries may be questioned by some and future researchers may prefer to ask for responses directly related to salary. However, this route was not followed, as it was believed that respondents would have accurate knowledge relating to post grading, rather than exact salaries.
References
ABBAS, S.M.N., ATHAR, S.A. & HERANI, G. 2010. Gender based wage discrimination and its impact on performance of blue collar workers: Evidence from Pakistan. KASBITBusiness Journal, 3(1):45-63. [ Links ]
ADAMS, J.S. 1963. Towards an understanding of equity. Journal of Abnormal and Social Psychology, 67: 422-436. [ Links ]
ADDABBO, T. & FAVARO, D. 2011. Gender wage differentials by education in Italy. Applied Economics, 43(29):4589-4605. [ Links ]
ANON. 2002. Gender differences in employee tenure. Compensation and Working Conditions, Sep:0. [ Links ]
ANON. 2006. Gender differences in job tenure. Economic Trends, Oct:13. [ Links ]
ANON. 2013. An Overview: Choosing the correct statistical test. Available at: http://www-users.cs.umn.edu/~ludford/stat_overview.htm [accessed 2013-10-11]. [ Links ]
BAGRAIM, J.J. & HARRISON, E. 2013a. Revisiting the gender gap in time-use patterns: Multitasking and well-being among mothers and fathers in dual-earner families. American Sociological Review, 76(6):809-833. [ Links ]
BAGRAIM, J.J. & HARRISON, E. 2013b. The anticipated work-family conflict of future business managers: Does gender and maternal employment matter? South African Journal of Business Management, 44(3):41-45. [ Links ]
BLUMBERG, B., COOPER, D.R. & SCHINDLER, P.S. 2011. Business research methods (3rd ed.) Berkshire: McGraw-Hill Education. [ Links ]
BORNSTEIN, S., WILLIAMS, J.C. & PAINTER, G.R. 2012. Discrimination against mothers is the strongest form of workplace gender discrimination: Lessons from US Caregiver Discrimination Law. International Journal of Comparative Labour Law and Industrial Relations, 28(1):45-62. [ Links ]
BRIJLAL, P., NAICKER, V. & PETERS, R. 2013. Education and SMMe business growth: A gender perspective from South Africa. International Business and Economics Research Journal, 12(8):855-866. [ Links ]
BUSSIN, M. 2011. The remuneration handbook for Africa. A practical and informative handbook for managing reward and recognition. Randburg: Knowres Publishing. [ Links ]
COHEN, J.W. 1988. Statistical power analysis for behavioral sciences (2nd ed.) Hillsdale, NJ: Lawrence Erlbaum Associates. [ Links ]
DEININGER, K., JIN, S. & NAGARAJAN, H. 2013. Wage discrimination in India's informal labor markets: Exploring the impact of caste and gender. Review of Development Economics, 17(1):130-147. [ Links ]
DOANE, D.P. & SEWARD, L.E. 2009. Applied statistics in business and economics. Boston, MA: McGraw-Hill. [ Links ]
DUFLO, E. 2003. Grandmothers and Granddaughters: Old-age pensions and intrahousehold allocation in South Africa. World Bank Economic Review, 17(1):1-25. [ Links ]
ENGLAND, P., GORNICK, J. & SHAFER, E.F. 2012. Women's employment, education, and the gender gap in 17 countries. Monthly Labor Review, 135(4):3-12. [ Links ]
FIELD, A. 2009. Discovering statistics using SPSS (3rd ed.) Los Angeles, CA: Sage. [ Links ]
GRAVELLE, H., HOLE, A.R. & SANTOS, R. 2011. Measuring and testing for gender discrimination in physician pay: English family doctors. Journal of Health Economics, 30(4):660-674. [ Links ]
HAROON, B. & SUMAYYA, G. 2013. The gender wage gap in Post-Apartheid South Africa: A reexamination. Journal of African Economics. Available at: http://jae.oxfordjournals.org/content/early/2013/05/15/iae.ejt008.full [accessed 2013-05-15]. [ Links ]
HOLLYFORDE, S. & WHIDDETT, S. 2002. The motivation handbook. London: Chartered Institute of Personnel and Development. [ Links ]
IOAKIMIDIS, M. 2012. Gender wage gap and earnings: Predicted by tenure in the Czech Republic. Journal of Developing Areas, 46(1):31-43. [ Links ]
ISAACS, E. 1995. Gender discrimination in the workplace: A literature review. Communications of the ACM, 38(1):58-59. [ Links ]
JOHANSSON, M., KATZ, K. & NYMAN, H. 2005. Wage differentials and gender discrimination: Changes in Sweden 1981-98. Acta Sociologica, 48(4):341-364. [ Links ]
KARA, O. 2006. Occupational gender wage discrimination in Turkey. Journal of Economic Studies, 33(2): 130-143. [ Links ]
LERNER, M.J. 1980. The belief in a just world: A fundamental delusion. New York: NY: PLENUM. [ Links ]
LOUIS, N.C., ALEXANDROS, P. & KONSTANTINOS, V. 2013. Gender wage gaps, 'sticky floors' and 'glass ceilings' in Europe. Labour Economics, 21:86-102. [ Links ]
LUTHANS, F. 2011. Organizational behavior: An evidence-based approach (12th ed.) Boston, MA: McGraw-Hill. [ Links ]
MOORHEAD, G. & GRIFFIN, R.W. 2014. Managing organizational behavior (11th ed.) Florence, KY: South-Western Cengage Learning. [ Links ]
MUNASINGHE, L., REIF, T. & HENRIQUES, A. 2008. Gender gap in wage returns to job tenure and experience. Labour Economics, 15(6):1296-1316. [ Links ]
MYERS, D.G. 2008. Social psychology (9th ed.) Boston, MA: McGraw-Hill. [ Links ]
NADEAU, S., WALSH, W. & WETTON, C. 1993. Gender wage discrimination: Methodological issues and empirical results for a Canadian public sector employer. Applied Economics, 25(2):227-42. [ Links ]
NEL, J. & STEYN, R. 2012. The effects of female parliamentary representation and gender quotas on scholastic empowerment of girls in sub-Saharan Africa: A test of the effects of in-group bias. International Journal of Psychology, 47:310. [ Links ]
ORNSTEIN, M. 2011. Cohort and period perspectives on gender, education, and earnings in Canada. Canadian Public Policy, 37:S95-S113. [ Links ]
PALLANT, J. 2010. SPSS survival manual (4rd ed.) Berkshire, UK: McGraw-Hill. [ Links ]
PETIT, P. 2007. The effects of age and family constraints on gender hiring discrimination: A field experiment in the French financial sector. Labour Economics, 14(3):371-391. [ Links ]
PUDNEY, S. & SHIELDS, M.A. 2000. Gender and racial discrimination in pay and promotion for NHS nurses. Oxford Bulletin of Economics and Statistics, 62(5):801-836. [ Links ]
ROSNOW, R.L. & ROSENTHAL, R. 2008. Beginning behavioural research: A conceptual primer (6th ed.) Upper Saddle River, NJ: Pearson/Prentice Hall. [ Links ]
RSA (Republic of South Africa). 1996. Constitution of South Africa, Act No.108 of1996. Available at: http://www.info.gov.za/documents/constitution/1996/a108-96.pdf [accessed 2012-03-07]. [ Links ]
RSA (Republic of South Africa). 1998. Employment Equity Act, Act No. 55 of1998. Available at: https://www.labour.gov.za/downloads/legislation/acts/employment-equity/Act-Employment Equity.pdf [accessed 2012-03-07]. [ Links ]
RSA (Republic of South Africa). 2000. Promotion of Equality and Prevention of Unfair Discrimination Act, Act No. 4 of 2000. Available at: http://www.justice.gov.za/legislation/acts/2000-004.pdf [accessed 2012-03-07]. [ Links ]
SHAINBROOK, J., ROBERTS, T.J. & TRISCARI, R. 2011. Research administrator salary: Association with education, experience, credentials and gender. Journal of Research Administration, 42(2):87-99. [ Links ]
SLOANE, P.J. & THEODOSSIOU, I. 1993. Gender and job tenure effects on earnings. Oxford Bulletin of Economics and Statistics, 55(4):421-437. [ Links ]
SOLBERG, E. 1999. Using occupational preference in estimating market wage discrimination: The case of the gender pay gap. American Journal of Economics and Sociology, 58(1):86-113. [ Links ]
SOLBERG, E.J. 2004. Occupational assignment, hiring discrimination, and the gender pay gap. Atlantic Economic Journal, 32(1):11-27. [ Links ]
TABLE. 2013. Fisher r to z. Available at: www.mtsu.edu/~dkfuller/tables/rtoztable.pdf [accessed 2013-10-11]. [ Links ]
STANLEY, T.D. & JARRELL, S.B. 1998. Gender wage discrimination bias? A meta-regression analysis. Journal of Human Resources, 33(4):947-973. [ Links ]
STATISTICS SOUTH AFRICA. 2012a. The South Africa I know, the home I understand. Available at: http://www.statssa.gov.za/Census2011/Products/Census_2011_Pictorial.pdf [accessed 2013-08-23] [ Links ]
STATISTICS SOUTH AFRICA. 2012b. Census 2011: Statistical release (Revised). Available at http://www.statssa.gov.za/Publications/P03014/P030142011.pdf [accessed 2013-08-23] [ Links ]
STEYN, H.S. 2000. Practical significance of the differences in means. Journal of Industrial Psychology, 26(3):1-3. [ Links ]
YAMAUCHI, F. & TIONGCO, M. 2013. Why women are progressive in education? Gender disparities in human capital, labor markets, and family arrangement in the Philippines. Economics of Education Review, 32:196-206. [ Links ]
Accepted: October 2014

