


Servicios Personalizados
Articulo
 Inglés (pdf)
 Articulo en XML
 Referencias del artículo
Indicadores

Links relacionados
-
 Citado por Google
 -
 Similares en Google
Compartir

 Permalink
South African Journal of Economic and Management Sciences
versión On-line ISSN 2222-3436
versión impresa ISSN 1015-8812
S. Afr. j. econ. manag. sci. vol.18 no.2 Pretoria 2015
http://dx.doi.org/10.17159/2222-3436/2015/v18n2a2
ARTICLES
Regional economic impacts of events: A comparison of methods
Lukas van WykI; Melville SaaymanI; Riaan RossouwII; Andrea SaaymanII
ITREES: Tourism Research in Economic Environs and Society, North-West University
IISchool of Economics, North-West University
ABSTRACT
The purpose of this paper is to provide an overview and comparison of three related methods for modelling the short-run economic impact of events, namely the partial Input-Output (I-O), Social Accounting Matrix (SAM) and Computable General Equilibrium (CGE) models. An analysis of strengths and limitations of these different methods suggests that it may be considerations such as the underlying assumptions specific to each model, data collection, expected output, research objectives, and costs involved that determine the choice of modelling framework. Data from surveys conducted at the Aardklop National Arts Festival during 2010 were used in the comparative analyses, which were executed by means of two regional (i.e. provincial-level) models and one small-region (i.e. place-specific) model constructed for the small town.
Key words: event tourism, regional CGE modelling, input-output models, social accounting models, South Africa
1 Introduction
During the early 20th century, the increased popularity of festivals in the United Kingdom (UK) led to their expansion into Europe to such an extent that festivals eventually became a global phenomenon (Bowdin & Williams, 2007:188). The global increase in the number of arts festivals emphasises the collective desire of communities to participate in activities that highlight their artistic culture. Schoombie (2003:10) remarks that, by 2003, more than 1.2-million international arts and cultural festivals were listed on the Internet.
Despite this remarkable growth, the financing of festivals is a contentious issue, considering the boosting of community support, socio-economic impact and spin-offs that are generated through such events. Only a handful of festivals are financially self-supporting, and very few events would be able to continue in the absence of sponsorships (Saayman & Saayman, 2012). In most cases, the shrinking, and, in some cases, withdrawal, of financial support by local authorities necessitates the sourcing of alternative funding from private or corporate sponsors, donors, and public contributions in order to ensure the continuance of festivals. In the context of the recent economic recession that currently hampers the recovery of global economies, it can be expected that sponsorships of, and donations for, festivals will be extremely limited. Private and public sectors that still provide financial support for arts festivals will most likely continue to do so because of a commitment to their wider social responsibilities and in anticipation of extensive exposure during the event.
Given this, Bowdin and Williams (2007:188) argue that event evaluation by conducting quantifiable economic impact studies has become a valuable tool to demonstrate the success and achievements of festivals. In recent years, several methods of conducting these economic impact studies have been developed and the most prevalent models utilised in surveys include multiplier models based on Input-Output (I-O) and the Social Accounting Matrix (SAM) and Computable General Equilibrium (CGE) models (Van Wyk, 2012). Where events take place in rural areas, proportional multiplier analysis has become increasingly popular. The proportional multiplier is derived from a small-scale (partial) I-O model that is constructed from local business survey data (Vaughan, Farr & Slee, 2000).
A critical assessment and comparison of these models might potentially add insight and value to their future use in the context of event impacts. However, this paper does not attempt to provide an exhaustive review of all aspects associated with the differences between these models. The goal of the paper is to provide a concise overview of the different approaches with the aim of demonstrating the differences that may be obtained in the results which can provide guidelines for organisers, practitioners and academics on the application of these models in small towns. One of South Africa's largest national arts festivals is the subject matter of the case study used in the comparison, namely the Aardklop National Arts Festival hosted in Potchefstroom in the North West province. After the literature review and a description of each model, the models are compared, first in a descriptive manner and then in terms of the model results. This is followed by a discussion of the main findings and of the implications for organisers, practitioners and academics. Finally, some concluding remarks are made.
2 Literature review
It is widely acknowledged that different models have different strengths and weaknesses and, in turn, "an important part of the modelling process is to select the type of model that can shed the most light on the issues considered to be most important while ignoring the smallest number of other elements of the problem that might be considered relevant" (Denniss, 2012:3). This implies that the choice of method that is used to assess the economic impact of festivals may have significant consequences. Serious consideration should therefore be given to the choice of model, as festivals can serve as a means to achieve socio-economic objectives. These objectives may include creating infrastructure, providing jobs, generating revenue, attracting investment, growing the arts, promoting a region, and building a better image (Saayman & Rossouw, 2010:255).
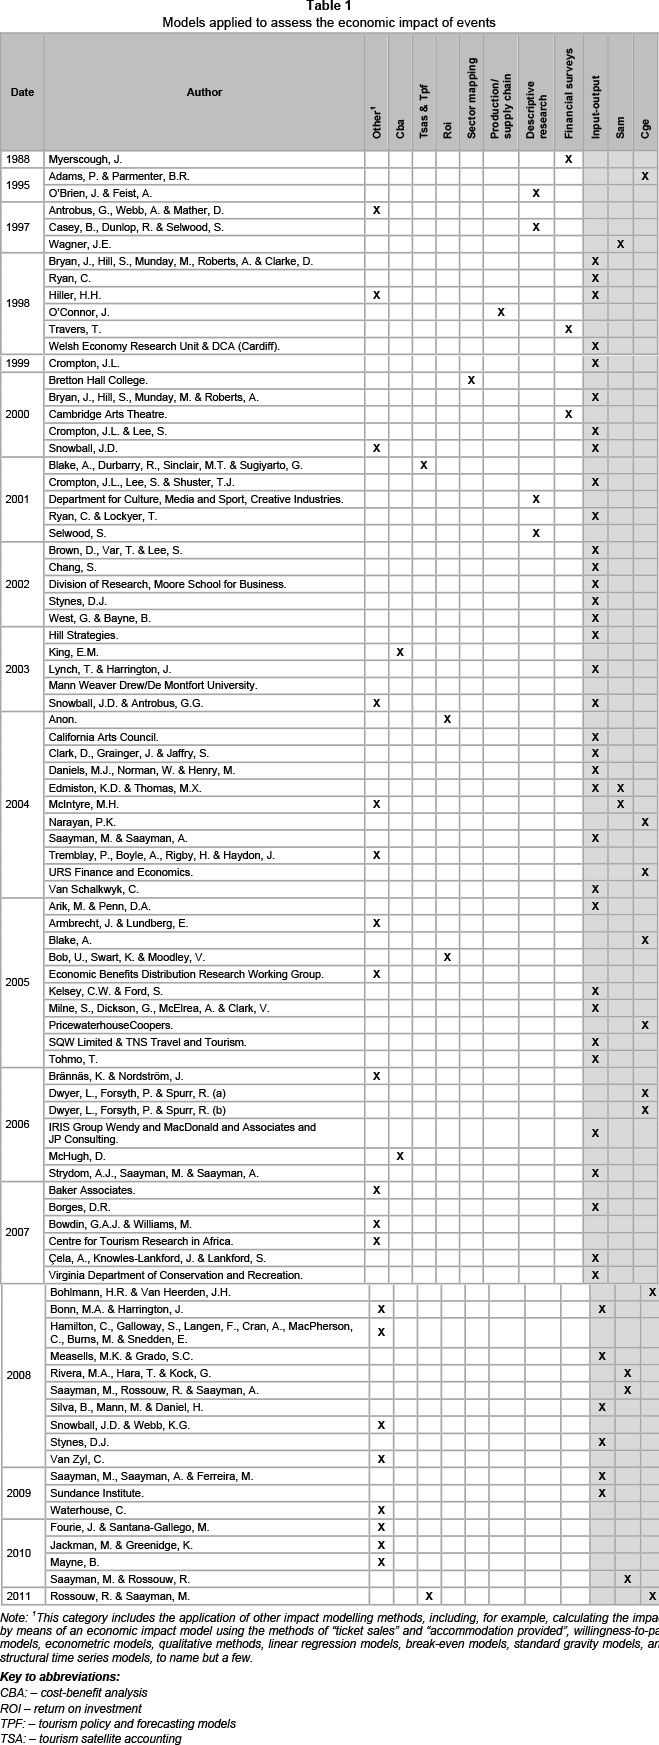
An exploration of the literature indicates that studies applying I-O, SAM and CGE models for assessing the economic impact of events are abundant and have increased significantly since the mid-1990s. This is clearly summarised in Table 1.
Despite numerous other methods being applied to assess the economic impact of events (as indicated in Table 1), the most prevalent seem to be I-O, SAM and CGE, and, in certain circumstances, these models have even been integrated or used in combination with other methods/models (see e.g. Rossouw & Saayman, 2011). I-O, SAM and CGE models belong to the same family of modelling, namely multisectoral models. Moreover, the first and second types are based on the third as a prior database. All three are suitable for specific questions. Even though the results of their applications have been so different so many times, they are ideally suited to assess the economy-wide impacts of events (as is clearly shown by the frequency of their use in various studies).
Since South African festivals have developed as a substantial segment of the leisure and tourism industry, the need to assess their economic impact has increased accordingly. This need has been highlighted in view of the fact that festivals usually require financial support to ensure sustainability. Unfortunately, well-founded criticism levelled at the integrity of these analyses and at the outcomes of economic impact studies is well documented. Crompton (1999:17) is of the opinion that, although most economic impact assessments are indeed completed with integrity, the accuracy and reliability of some of the assessments are questionable. For example, there are various instances of researchers and consultants applying inappropriate procedures and assumptions in order to generate highly favourable economic impact results (Denniss, 2012). Also, the tendency to make use of inflated multipliers that enhance the overall economic impact of an event and thus make the economic value more generous than accurate is of great concern to some researchers (Kelsey & Ford, 2005:7; Stynes, 1997:6). In other surveys, several underlying assumptions have been made that have an extensive impact on the outcomes (Gilbert, 2008:3; Bonn & Harrington, 2008:774).
Some researchers (i.e. Jaffee, 2009:12) criticise the accessibility and ease of use of off-the-shelf models and are of the opinion that, "in the wrong hands, the software will produce inflated results at best, and at worst, completely ridiculous projections". Andreatta (2009:1) reports that the economic impact of events may often be inflated, as assessors "rely on questionable attendance calculations and the application of what economists say is a misused mathematical formula for determining how money trickles through the economy". LeBeau's view, as quoted by Andreatta (2009: 1), that "economic impact studies are not an exact science but rather an education process -we've been working on this and trying to make it better every year", serves as confirmation that adopting incorrect assessment practices may have serious consequences for all stakeholders involved. Therefore, it is important to gain a better understanding of the models that are applied in these studies, and, specifically, the models under investigation in this paper.
3 Model comparison
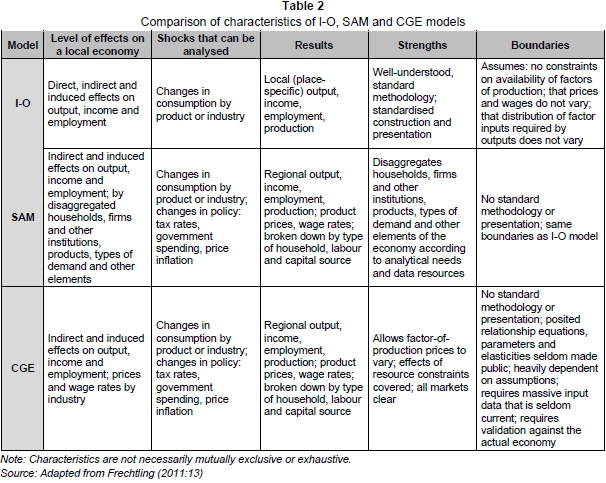
The models under investigation and applied in this paper are similar impact-type models, that is, single-region multisectoral models. The purpose of describing them is to highlight the relative strengths and weaknesses of such models rather than to determine which models are "the best". Put simply, the best model is the smallest, simplest and most transparent model that sheds light on the link between the variables of most concern to the modellers (Denniss, 2012:4). Table 2 provides a summary of the main characteristics of each model.
3.1 I-O model
As early as 1995, Lundberg, Krishnamoorthy and Stavenga identified I-O analysis as the most commonly used method for assessing economic impacts of projects or events. I-O analysis is an analytical framework with the fundamental purpose of analysing the interdependence of industries in an economy (O'Connor & Henry, 1975:1). An I-O model in its most basic form consists of a system of linear equations, each one of which describes the distribution of an industry's product throughout the economy. An I-O model makes provision for two kinds of activities on a sectoral level, namely (i) the purchase of intermediate and primary inputs and (ii) the supply of intermediate and final outputs. Total output of Sector 1 (X1) is therefore the sum of the intermediate outputs, plus final demand/ output of Sector 1 (F1), or, alternatively stated, final demand is the difference between output and intermediate demand:

where  represents the technical coefficients defined as the quantity of inter-mediate inputs which a particular sector requires from another sector in order to supply one rand unit of output. Equation (1) can be written in matrix format (in order to extend it over all sectors) as:

where F is a vector of final demand, I is an n x n identity matrix, A is the technical coefficient matrix and X is a vector of production. To assess the impact of a shock to final demand (F) on output, the Leontief inverse is applied, that is:

While I-O analysis is a widely accepted and useful means of economic impact analysis, it is limited in that it does not reveal the personal income distribution effects across different household income segments (Holland & Wyeth, 1993) and gives no consideration to industry occupation, skills and wages and the resulting income effects. Therefore, using I-O models to assess economic impacts will not allow for a clear picture to emerge, from the specified issue under review, of which household income groups are benefiting or suffering and which are not.
In South Africa, the available I-O models are economy-wide models, and small towns that host events are not expected to have the same economic structure as the economy. To account for this, Vaughan et al. (2000) propose the use of a small-scale (or partial) I-O model. For the purpose of this study, a business survey, as discussed in Section 4.1 below, was undertaken during 2010 (similar to that explained by Vaughan et al., 2000) and an eight-by-eight I-O model was constructed for the local economy. Using matrix inversion, the technical coefficients and corresponding output multipliers were derived. By applying the output multipliers to the direct spending of all visitors at the event, the total production effects of their spending can then be calculated.
By expanding the I-O table to a nine-by-nine matrix, the effect of household spending and wages, or the effect on income, can be determined. The expanded matrix is based on the assumption that the consumption pattern of the research area is similar to that of the national consumption pattern (as defined in the 2005 nationwide I-O table). The income generated as a result of one additional visitor is thereby calculated.
3.2 SAM multiplier model
A SAM is a data system that includes both social and economic data for an economy. The data sources for a SAM come from I-O tables, national income statistics, and household income and expenditure statistics (Cameron, 2003). A SAM is broader than an I-O table and typical national accounts, showing more detail about all kinds of transactions within an economy. The model structure is therefore similar to that of the I-O model described above. However, an I-O model records economic transactions irrespective of the social background of the transactors. A SAM, in contrast to national accounts, "attempts to classify various institutions [according] to their socio-economic backgrounds instead of their economic or functional activities" (Chowdhury & Kirkpatrick, 1994:58).
A SAM is a way of logically arranging statistical information concerning income flows in a country's economy during a particular time period (usually a year). It can provide a conceptual basis for analysing both distributional and growth issues within a single framework (Statistics South Africa, 1998:7). For instance, a SAM shows the distribution of factor incomes of both domestic and foreign origin over institutional classes, and the redistribution of income over these classes. In addition, it shows the expenditure of these classes on consumption and investment, as well as the savings made by them. King (1988) points out that a SAM has two main objectives: firstly, to organise information about the economic and social structure of a country over a period of time; and, secondly, to provide a statistical basis for the creation of a plausible model capable of presenting a static image of the economy as well as simulating the effects of policy interventions in the economy or of other economic impacts.
For the analysis, a SAM for the North West province as developed by Conningarth Consultants (2006) was used. This model makes use of a consistent and comprehensive data set in respect of all manual transactions among productive and institutional sectors of the province's economy. Using 2006 prices as a base, it distinguishes 55 sectors, 12 household types and 4 ethnic groups. With the application of multipliers according to the SAM for the North West province, the direct spending of visitors to Aardklop is converted into the linked increases in production, income and jobs in the region, represented by the indirect and induced impacts.
Finally, a SAM coupled with a conceptual framework that contains the behavioural and technical relationships among variables within and among sets of accounts can be used for the evaluation of the economy-wide effects of policy changes or other economic impacts rather than only for purely diagnostic purposes (Pyatt, 1988:349). The conceptual framework is Supplied in the form of a CGE model.
3.3 CGE model
While single-region CGE models have been applied in past studies (see e.g. Partridge & Rickman, 1998), such models have been designed for relatively small regions, such as Churchill County, Nevada (Seung, Harris, Englin & Netusil, 2000), Fort Collins, Colorado (Schwarm & Cutler, 2006), and for a specific purpose. Given the availability of a regional I-O table or SAM, single-region, general-purpose CGE models have been shown to be quite useful (Giesecke & Madden, 2013:401). A case in point is the AMOS model of Scotland (Harrigan, McGregor, Dourmashkin, Perman, Swales & Yin, 1991), which has been utilised for more than two decades.
A concern raised by Lofgren and Robinson (2002) regarding single-region models is that such models' results may be ambiguous, as they do not capture interregional and nation-region feedback. Giesecke and Madden (2013) show that such feedback effects are small when the regional economy is not a large contributor to national output. Moreover, the studies of McGregor, Swales and Yin (1999) and McGregor, Swales and Yin (1996) demonstrate that the region-specific effects of a demand shock in a single-region CGE model converge on a long-run I-O result in which almost all factors are interregionally mobile (Giesecke & Madden, 2013:401-402). However, the former study points out that, for the other aggregate region (i.e. the rest of UK), the long-run result yields an opposite sign. This is unlike an I-O result, thus creating a problem with the use of single-region models in a policy context. With the focus being purely on the effects in a single region, the possible (positive or negative) spillover effects to other regions are essentially ignored. This may lead to false results from such models, and the users thereof should clearly state such limitations (Giesecke & Madden, 2013).
The single-region CGE model used in this paper is a stand-alone model of a single subnational region. The model is based on a single-region ORANI-type CGE model of the state of Parana, Brazil, elaborated on by the Centre of Policy Studies at Victoria University in Australia (the original model [TPMH0060] is available from http://www.copsmodels.com/archivep.htm). The model is comparative-static and was developed for use with a regional SAM (Rolim & Kureski, 2006). This basic model was taken and adapted with data from the SAM for the North West province of South Africa. The resultant model has 46 sectors and accords with traditional neoclassical theories of economic rationality, that is, each sector minimises production costs, dependent on constant returns of scale with known input prices, and households use their earnings in line with traditional functions of utility maximisation (Rolim & Kureski, 2006). World trade consists of two regions, namely the rest of South Africa and the rest of the world, with imports being a composite good used in varying shares in all sectors.
In the model applied, the primary factor input demand equations are based on the assumption that each industry within the region faces primary factor substitution possibilities described by CES functional forms. The result is cost-minimising input demand and unit cost equations that can be expressed as percentage changes (Giesecke & Madden, 2013:436), that is:


where  is the percentage change in demand for factor ν by regional industry j,r;
  is the percentage change in the technical efficiency of primary factor input ν in regional industry j,r; yj,r is the percentage change in the output of regional industry j,r;
  is the percentage change in the price faced by regional industry j,r; for factor ν; pj,r is the percentage change in the average price of primary factors faced by regional industry j,r; σ is the elasticity of substitution between primary factor inputs; and
  is the share of payments to factor ν in industry j,r's total primary factor costs (Giesecke & Madden, 2013:436).
The adapted SAM used as the model database makes no distinction between activities and products. Instead, the commodity entries indicate purchases of a compound good made up of provincial (North West) and imported commodities (from the rest of South Africa and the world). Imported products are only used directly by firms and thus sectors get a dual role of producing and joining compound goods that use their own product plus the equivalent in imported goods. Furthermore, the model assumes that local households receive all payments for production factors (Rolim & Kureski, 2006).
To be able to compare the results from the CGE model with those of the I-O and SAM models, a short-run traditional I-O closure rule is used. In this closure. all factors (and imports) are in elastic supply at fixed nominal prices, and thus there are no relative price changes and the model acts like a typical I-O model. Also, household consumption is linked to regional income with subsequent strong multiplier effects.
4 Empirical results and comparison
The next step is to commence with an empirical comparison of the models. Since the I-O model is only a partial (small-city) model derived from primary data, the collection of primary data for the model is first described. Secondly, multipliers are derived and compared, and then a case study of the impact of visitor expenditures at Aardklop on the local and regional economy is described, which further highlights the differences between the models.
4.1 Business survey
For the construction of the partial I-O for the festival area, a local business survey that encompassed all business sectors was conducted during July 2010. The purpose of this particular survey was to determine the extent to which goods and services needed to hold the festival were sourced from outside the local community. The survey included specifically sampled businesses in order to ensure the representation of all sectors within the local economy.
The sample selection for collecting primary data was based on data obtained from the Potchefstroom Business Chamber. The total number of accommodation establishments in Potchefstroom was estimated at 70 (Cilliers, 2009). In view of the fact that the accommodation sector represents approximately 4 per cent of the total number of businesses, it was estimated that, in Potchefstroom there were in the region of 2 000 business establishments. All geographical business areas in town were identified and each business was listed by means of a door-to-door survey. In order to identify businesses that did not operate from formal business premises, the Yellow Pages (2009/2010) of the North West province and the Potchefstroom Business Directory 2010 were consulted.
During the survey, a partial approach was applied to the Potchefstroom business population of 1 000, implying that 45.54 per cent of businesses would be included. Considering that the estimated business population in Potchefstroom is around 1 000, a 25 per cent sample implies that 250 questionnaires needed to be distributed for this survey. In order to ensure a proportional business sector representation for Potchefstroom during this survey, questionnaires were distributed to the respective business sectors as indicated in Table 3.
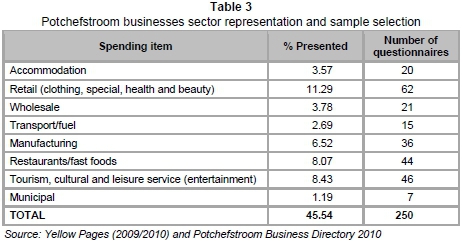
The questionnaire developed for this study covered specific business spending and was based on the business survey questionnaire proposed by Vaughan et al. (2000), and that by Saayman and Saayman (2006) and Saayman, Saayman and Ferreira (2009). Participants' responses were accurately captured by making use of the recall method or by consulting authentic data resources such as financial statements.
4.2 Multiplier comparison
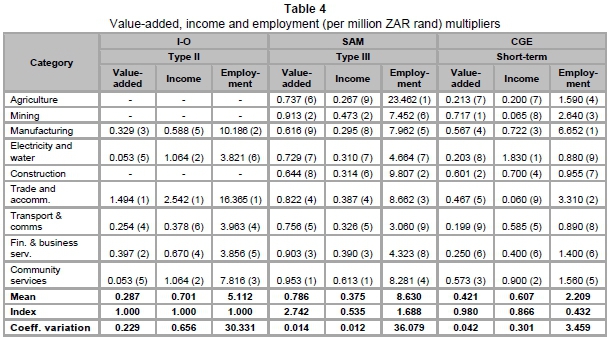
The value-added, income and employment multipliers for each modelling method are presented in Table 4. These multipliers represent the change in value-added, income and employment per million-rand increase in final demand expenditure of the sector in question.
The multipliers (see Table 4) are derived from three models, which include: (i) a partial I-O (Type II) model, which delivers proportional multipliers, since it only models a specific part of the economy; (ii) a SAM (Type III) model; and (iii) a CGE model under a short-term closure scenario (the closure scenario for the CGE model holds capital supply fixed, which represents a standard short-run assumption (West, 1995).
With regard to the value-added multipliers in Table 4, the SAM model produces the largest multipliers, with an average value of 0.786 (or 274.2 per cent of the average Type II proportional I-O multiplier value), because of the additional induced demographic effects. Similarly, the short-term CGE model produces the smallest multipliers, with an average value of 0.421 (or 98.0 per cent of the average proportional I-O multiplier), as a result of the constraints on capital supply. One would also expect the SAM model to produce smaller multipliers than the I-O model because of the marginal rather than average household-induced relationships, and, similarly, with the long-term CGE model, except that the multipliers should get closer to those of the I-O model as supply restrictions are relaxed. However, since both the SAM and CGE models are at the regional level (at the provincial level) and the partial I-O at a place-specific (small town/ region, i.e. Potchefstroom) level, these expected differences are not observed.
However, there are also some significant differences in the distributions of the multi-pliers for each model. For example, trade and accommodation has the largest proportional I-O multiplier at 1.494, while the largest SAM multiplier is 0.953 for community services. The largest CGE multiplier occurs in mining, with a value of 0.717 in the short term. The overall spread of values from the CGE model is also greater as a result of the additional limited resource factor. Sectors which have limited access to capital will experience additional dampening effects, while sectors which can easily draw capital from other sectors will show relatively larger multiplier effects (West, 1995).
In terms of relative sizes of the income and employment multipliers, the same general conclusions can be reached as for the production multipliers (also shown in Table 3), except for a greater variation in the SAM model. The CGE model gives marginally greater relative multiplier values as a result of the Keynesian-type closure.
While the multipliers form one basis for comparison between these models, they can be misleading in some ways if taken as a general guide to the relative differences in any given application. The reason is that impact situations are usually more complex, involving multiple changes across a range of sectors. In the following section, a case study is used to highlight further the differences between the models. These results should be viewed in the context of the festival under review.
4.3 Visitor survey
Since 2002, visitor data has been collected annually by means of surveys at the Aardklop National Arts Festival. The aim of the surveys was to understand visitor spending patterns of a selected sample of visitors. The collated information included participants' demographic details, their activities during the festival, the length of their stay, and, specifically, their expenditure patterns.
The data-collection process was administered by interviewers during face-to-face interviews with respondents in the selected sample. Maree and Pietersen (2010:158) list the following as being some of the advantages of using this method: a high response rate is obtained, it is possible to use lengthy questionnaires, and the interviewer is able to render immediate assistance to respondents, as a result of which the literacy level of respondents becomes irrelevant.
For purposes of this study, the visitor survey was used to determine the shock in final demand due to the festivals. Expenditure was based on spending information obtained by means of the survey conducted during the 2010 festivals. The visitor survey was utilised in order to calculate the average spending pattern per visitor group for the various spending items. The spending per visitor was calculated by dividing the estimated average spending per visitor group by the number of visitors per visitor group.
In order to provide for the leakage principle (i.e. where expenditure that leaks out of the hosting community's economy is excluded when assessing economic impact), the research follows the work by Stynes (1999) and the following adjustments have been adopted. A weighting factor of 0.15 was applied to performance spending due to the large portion being paid over to artists, Computicket (ticket sales agency) and SARS (South African Revenue Service). The food and restaurant spending weighting factor was adjusted to 0.718 in order to allow for food stalls operated by entrepreneurs from outside the hosting community. A weighting factor of 0.06 was applied to curios and memorabilia spending, as only 6 per cent of entrepreneurs operating these stalls were from the hosting community. Because many visitors did not need to travel long distances to the event and therefore ensured sufficient fuel intake before leaving their home town, the spending weighting factor in respect of transport to the event was adjusted to 0.5. With the necessary leakages provided for, the total direct spending was calculated for visitors, which represents the change in final demand.
As proposed by Stynes and White (2006), a segmentation strategy was followed where the expenditure data were split according to the origin of the visitors. Three groups were identified, namely (i) visitors from the North West province in which the festival is held, (ii) visitors from the rest of South Africa, and (iii) foreign visitors. By splitting the respondents into various groups, a more accurate value for spending can be determined (Saayman, Saayman & Du Plessis, 2005).
It is often argued that spending by locals (in this instance, visitors from North West province) should be excluded, since it only represents a shift in expenditure patterns and not new money that flows into the region. However, Crompton (2006) indicates that there are two circumstances when local spending can be included: (i) when the existence of the festival caused the residents to stay at home rather than take a trip elsewhere, referred to as the "deflected impact"; and (ii) when a study of the significance of the festival is made, that is, of the size and nature of the influence that the festival has on local economic activity. Since visitors travel within the province to visit the festival, it implies that they would travel to another province if the festival took place elsewhere. Therefore, there is a strong case that option (i) mentioned above is true and the spending by visitors from North West province is therefore included in the analysis. The contribution is, however, always listed separately in the analysis to allow economic impact estimation with and without locals' spending.
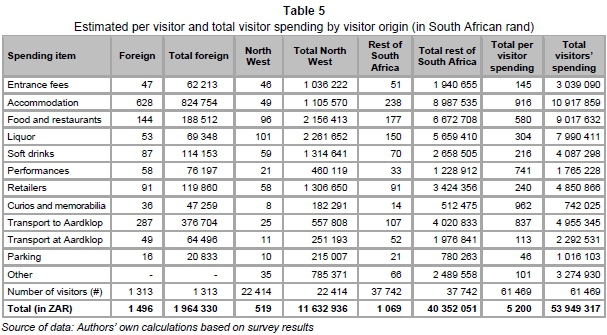
A questionnaire is used to gather expenditure information from visitors, but some visitors travel with fellow visitors (i.e. in groups). The spending per group thus includes spending by visitors and fellow visitors. To determine the spending per visitor, spending on entrance fees was used. Given the amount spent on entrance fees to the festival, North West visitors travel in visitor groups of 2.10, other South African visitors in visitor groups of 2.06, and foreign visitors in visitor groups of 2.88. The magnitude of spending for each category was therefore divided by the number of visitors in the group in order to derive the value of spending per visitor. Table 5 indicates this spending per visitor based on the survey results (Columns 2, 4, 6 and 8), as well as the visitors per group. Note that this spending includes the accompanying persons for whom the visitor is financially responsible. Table 5 also shows the total visitor expenditure per origin in the festival area (Columns 3, 5, 7 and 9), which is derived from the total visitor numbers.
Table 5 presents a breakdown of the activity sectors where expenditure was incurred. The total direct spending that takes place in the North West economy amounts to R83.9 million, of which R11.6 million is contributed by local visitors and R40.4 million and R2.0 million by visitors from the rest of South Africa and abroad, respectively. The estimated spending allows adjustments to exclude direct spending that took place outside the North West province. Such exclusions encompassed the remuneration paid to the majority of artists residing outside Potchefstroom, production tax paid to SARS in Pretoria, and commissions payable to Computicket in Johannesburg.
4.4 Case study results
The impact scenario chosen for this study is the impact, on the North West economy, of expenditures by visitors who attended Aardklop in Potchefstroom in 2010. This application presents a comparison of the three models that is as near as possible to being a valid comparison, since visitor expenditures can be classified as final demand (final consumption expenditure of visitors) in all the models.
The total spending by visitors from different origins was allocated to the categories of the I-O model and the North West SAM. Since a multiplier approach is followed, distinct multipliers for each expenditure-related economic activity are applied. The subsequent change in commodity demand is therefore translated into a change in economic activity by using the partial (small-scale) I-O- and SAM-calculated multipliers - the so-called "corrected" direct impact of the festival. The multipliers then convert the spending into the associated increase in production, income, and employment opportunities due to the circulation of the additional spending through the local economy.
The expenditure data by visitors have been deflated to 2006 values, allocated to industry sectors and converted to producers' values, as shown in Table 5, in order to be compatible with the partial I-O, SAM and CGE data. All results are expressed in 2006 values. The implementation of the impact analyses in all the models is similar, in that the visitor expenditures are incorporated into the models as final demand shocks.
What is also important when performing economy-wide impact analyses is to know the duration of the festival in days. The length of the festival can determine which technique is the most appropriate. Lastly, when big changes occur due to the presence of events (such as Aardklop) that affect various other parts of the economy, it is necessary to apply some reliable form of modelling which will explicitly and accurately capture the potential economy-wide effects of such potentially valuable events. Accordingly, the following sections provide a brief overview of some of the most common types of economic modelling used in South African events modelling.
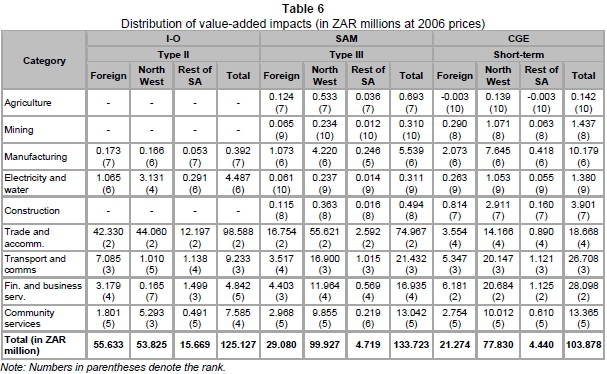
The results pertaining to the impact scenario on value-added, income and employment are given in Tables 6, 7 and 8, respectively. They show the value impact of visitor expenditure over the industrial sectors in terms of total impact on the North West economy. Across comparable industries (multipliers for agriculture, mining and construction could not be calculated for the partial I-O model from the business survey data and can therefore not be compared with the SAM and CGE results for these industries), and in contrast with a priori expectations, the total impacts derived from the Type II partial I-O model are not greater than those from the other static models (for most industries), while those obtained from the CGE model are also not the smallest (although they are smaller relative to the SAM results). It can be expected that the impacts from the SAM model will be the largest because of the additional induced geographic effects.
In terms of the aggregate impacts, the estimated value-added (Table 6) from the partial I-O model is R125.13 million. The SAM model's estimate is slightly more at R133.72 million (or 106.9 per cent of the partial I-O model), while the short-term CGE model produces the lowest estimate of R103.88 million, or only 83 per cent of the partial I-O model's value. The corresponding multipliers are 0.431, 0.403 and 0.519, respectively.
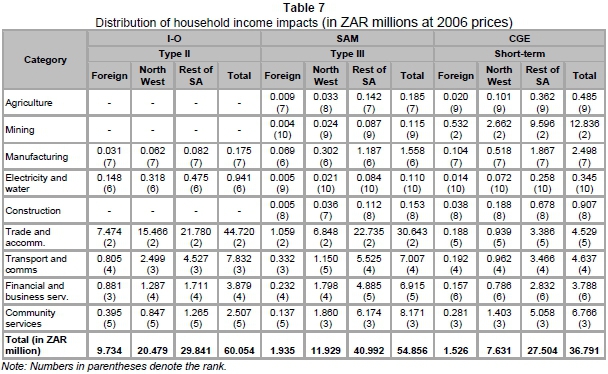
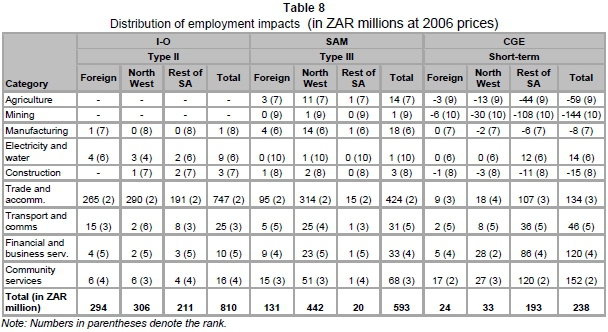
This last point is brought out in Tables 7 and 8, which show that the income and employment flow-ons are much smaller relative to the partial I-O model than those for value-added, indicating the greater role played by marginal labour productivity changes. For example, the SAM model produces only 91.3 per cent of the household income impact and 73.2 per cent of the employment impact of the partial I-O model, while the short-term CGE model falls to 61.3 per cent for income and 29.4 per cent of the I-O value for employment.
As mentioned earlier, the length of the festival should be kept in mind when measuring economy-wide impacts of such events. In this case, Aardklop takes place over a period of 5 days. Therefore, even if 70 000 tickets were sold in 2010, the festival is estimated to generate an extra 810, 593 and 238 jobs (according to the partial I-O, SAM and CGE, respectively). I-O and SAM models are an annual snapshot of an economy. There may be an extra 810, 593 and 238 employed for 5 days, but, averaged over the year, the employment impact is negligible. Further, other research among business owners suggests that, at festival time, they do employ more people, but may extend the hours of existing employees or work the existing employees harder. In fact, only 19 per cent of businesses in the survey stated that they employed more staff during the event (5 days).
The general distributions of the impacts across the industrial sectors correspond more or less with expectations. The largest effects occur in those sectors directly affected by the visitor expenditure, that is, trade and accommodation and transport and communications. With income and employment, the rankings differ marginally, but, overall, the distributions are much the same. Obviously, labour has a greater impact on labour-intensive industries (such as service industries) and less impact on manufacturing and other more capital-intensive industries.
Generally speaking, the I-O and SAM models produce relatively larger impacts in the manufacturing sectors and smaller impacts in the service sectors, particularly with respect to wages and employment. In other words, the service-type industries are better able to support the increase in tourist activity largely within existing resources, whereas manufacturing-type industries, which have more rigid value-added structures, respond in a manner closer to that of the Leontief value-added system.
However, the CGE model results in a much larger redistribution of resources among all the sectors in the economy, in particular from agriculture, mining, metal products, manufacturing and construction (which all experience negative flow-on effects) to the sectors most affected by the boost in tourist activity, that is, trade and accommodation, transport and communications, financial and business services, and community services. This occurs because capital is drawn away from those sectors with more abundant and less efficient usage, going to those sectors in greater need in the short term.
5 Findings and implications
When comparing the economic impact results of a small-town festival, such as Aardklop, it must be kept in mind that the demographic composition of Potchefstroom (as measured by a partial I-O model) is relative to that of the entire North West province (as measured by the SAM and CGE models). The larger economic impact as measured by the SAM and CGE models is ascribed to less leakages and larger multipliers allowed for when applying a partial I-O model. Having calculated the economic impact of Aardklop by applying SAM, CGE and partial I-O models, the following results and comparisons were derived.
Firstly, when reviewing the results after applying the partial I-O, SAM and CGE models to the same set of Aardklop data, the calculated economic impact of each model differs substantially. In terms of the aggregate impacts, the estimated value-added (Table 6) from the partial I-O model is R125.13 million. The SAM model's estimate is slightly more at R133.72 million (or 106.9 per cent of the I-O model), while the short-term CGE model produces the lowest estimate of R103.88 million, or only 83 per cent of the I-O model's value. The difference in measured impacts in respect of the three models leads to the obvious question as to which is the most reliable. Despite the comparative differences between the assessment models that became apparent in this paper, the indisputable fact remains that the hosting of an event has a varying economic impact with associated consequences for all stakeholders.
In comparing the calculated results when applying the partial I-O model, it is evident that a greater economic impact is reflected when the SAM model is used and a smaller impact when the CGE model is used. During this study, a Type II partial I-O model was developed for the small city of Potchefstroom. However, provincial SAM and CGE models had to be applied, as no such models exist for Potchefstroom. Results indicate that, when a provincial SAM model with its secondary effects is applied to data collated from an event hosted by a small city, the calculated total impact is largely overstated. The regional CGE model developed for use with a SAM (for the North West) calculates a lesser total impact.
Secondly, in view of the significant differences in the measured economic impact when various models are applied to the same event, it becomes imperative that organisers, economists and academics who use assessment results to inform and guide stakeholders should ensure that the results obtained by means of a specific model relate accurately to the purpose for which the tool was developed. This was once again highlighted. It must be very carefully noted that the reporting of misleading assessment results may have severe, if unintended, economic and social consequences, as mentioned by Crompton (1999).
Finally, a most significant limitation of an I-O model seems to be the inadequate measurement of job opportunities created. Some stakeholders may find measuring tools such as SAM and CGE models preferable for this purpose owing to their ability to better account for additional job opportunities than the I-O models. Developing a partial I-O model that is place-specific from primary data, as was done here, is time-consuming and also expensive.
The discussion above points out obvious differences between the models. However, the comparison is not as simple as comparing structure, multiplier values or impacts. The environment in which the models operate also plays an important role. It is important to explore the theoretical foundations and empirical possibilities of these models within a wider framework and to develop the capacity to evaluate and compare the models and their applications in different situations using multiple case studies.
Some other comparable elements which might be given attention in future research include (West, 1995): the levels of complexity of the models, also within model types; the size of the region and the type of model required to appropriately measure economy-wide impacts (large rural areas presumably require modelling strategies different from those encompassing large metropolitan areas, and small-area models are invariably constructed from the bottom up, while large regions are more likely to make use of top-down construction techniques); the type of problem being studied must be an important consideration in the choice of model (each model contains particular characteristics which make it more suitable for a given application than other models); and, finally, attention needs to be drawn to the analytical significance of the assumptions and characteristics of the model used (this can vary widely, even within model types).
6 Conclusion
Results derived in this paper demonstrate that there are substantial differences between the three models, which raises the question: Which set of results is the more reasonable? In some ways, it often comes down to personal prejudices. It becomes a question of balance between choosing a simple model that is easy to understand versus a more complex model that is often difficult to understand and apply, but which is more theoretically appealing in some ways. Therefore, it depends on the application, and, in addition, on the amount of data available.
The inconsistency of the measured results between the three models is most notably characterised by an estimated high/low difference of R59.6 million in total impact analysis. The total economic impact variance between the SAM and CGE model results in an estimated R30 million, while an almost equal difference between the CGE and partial I-O results is noticeable.
The results further support the concern that the economies of hosting communities normally experience high leakages, and so the local economy does not benefit to the extent that is generally expected and forecast. This phenomenon is apparent from lower multiplier values, and this research once more highlights the significance of not using overinflated multipliers to determine economic impact on hosting communities. This finding is particularly illustrated by the partial I-O results that considered just this principle.
This paper confirms the finding of previous studies indicating the variance in measured economic impact results. This is emphasised by an even larger difference in results when the Aardklop data was assessed. Owing to the variance in the measured results that different models produce, very serious and deliberate consideration should be given to the preferred model that is utilised. A slapdash, hasty approach to the choice, interpretation and application of assessment models must be avoided, as inappropriate result information may adversely influence decision making and have serious consequences for all stakeholders that depend on the sustainability of an event.
While many have forecast the end of the simple I-O model, stating that it is inadequate, it has proved surprisingly resilient. One area where I-O still has the advantage over more sophisticated models is at the very small-region level (such as small towns), where the partial I-O model (as constructed here) really provides the only option for planners, despite its known limitations.
For future research, it would be advantageous to see the SAM and CGE frameworks move closer together and, at the same time, make the models more flexible and adaptable to local conditions without resorting to making each model application-specific. Again, the point being made here is that the act of selecting what kind of model is to be used to evaluate the economic significance of an event will, inevitably, have an impact on the way that the results will be framed and perceived.
Acknowledgements
The authors would like to thank the two anonymous reviewers for comments and suggestions that have contributed to this paper. The usual caveats apply. In addition, we also need to thank the National Research Foundation (NRF) for the funding to conduct this research. Lastly, thanks are due to all those who completed the questionnaires in order for us to have reliable data.
References
ADAMS, P.D. & PARMENTER, B.R. 1995. An applied general equilibrium analysis of the economic effects of tourism in a quite small, quite open economy. Applied Economics, 27(10):985-994. [ Links ]
ANDREATTA, D. 2009. Economic impact of sporting events may be inflated. Available at: http://www.democratandchronicle.com/article/20091213/NEWS01/912130350/Economic-impact-sporting-events-may-inflated?nclick_check=1 [accessed 2009-12-13]. [ Links ]
ANON. 2004. Brighton Festival 2004: Everyone benefits: The economic and cultural impact of Brighton Festival upon Brighton and Hove. Available at: http://www.brighton-festival.org.uk/impact [accessed 2009-11-16]. [ Links ]
ANTROBUS, G.G., WEBB, A.C.M. & MATHER, D.J. 1997. The economic impact of the 1997 Standard Bank National Arts Festival. Unpublished Report, Rhodes University. [ Links ]
ARIK, M. & PENN, D.A. 2005. Economic impact of Bonnaroo Music Festival on Coffee County. Unpublished Report, Axis Ventures. [ Links ]
ARMBRECHT, J. & LUNDBERG, E. 2005. From quality to expenditures - a case study of Storsjöyran Music Festival, Sweden. Master's thesis, Göteborg University. [ Links ]
BAKER ASSOCIATES. 2007. Glastonbury Festival 2007 economic impact assessment. Unpublished Report, Mendip District Council. [ Links ]
BLAKE, A. 2005. The economic impact of the London 2012 Olympics. Report. Available at: http://utsescholarship.lib.uts.edu.au/dspace/bitstream/handle/2100/994/Impact2005_5.pdf?sequence=1 [accessed 2010-03-06]. [ Links ]
BLAKE, A., DURBARRY, R., SINCLAIR, M.T. & SUGIYARTO, G. 2001. Modelling tourism and travel using tourism satellite accounts and tourism policy and forecasting models. Available at: http://www.nottingham.ac.uk/ttri/pdf/2001_4.pdf [accessed 2009-11 -24]. [ Links ]
BOB, U., SWART, K. & MOODLEY, V. 2005. Evaluating socio-economic impacts of sport tourism events: Case studies from Durban, South Africa. Paper presented during the 1st International Event Research Conference, Sydney, 15 July. [ Links ]
BOHLMANN, H.R. & VAN HEERDEN, J.H. 2008. Predicting the economic impact of the 2010 FIFA World Cup on South Africa. International Journal of Sport Management and Marketing, 3(4):383-396. [ Links ]
BONN, M.A. & HARRINGTON, J. 2008. A comparison of three economic impact models for applied hospitality and tourism research. Tourism Economics, 14(4):769-789. [ Links ]
BORGES, D.R. 2007. Boston Cyberarts Festival: Program evaluation and economic impact analysis 2007. Economic Development Research Series, no. 65, University of Massachusetts. Available at: http://www.umassd.edu/cfpa [accessed 2010-01-03]. [ Links ]
BOWDIN, G.A.J. & WILLIAMS, M. 2007. Festival evaluation: An exploration of seven UK arts festivals. Managing Leisure, 12(2/3):187-203. [ Links ]
BRÄNNÄS, K. & NORDSTROM, J. 2006. Tourist accommodation effects of festivals. Tourism Economics, 12(2):291-302. [ Links ]
BRETTON HALL COLLEGE. 2000. Cultural industries key data: The cultural industries in Yorkshire and the Humber. Unpublished Report, Bretton Hall College. [ Links ]
BROWN, M.D., VAR, T. & LEE, S. 2002. Messina Hof Wine and Jazz Festival: An economic impact analysis. Tourism Economics, 8(3):273-279. [ Links ]
BRYAN, J., HILL, S., MUNDAY, M. & ROBERTS, A. 2000. Assessing the role of the arts and cultural industries in a local economy. Environment and Planning, 32(8):1391-1408. [ Links ]
BRYAN, J., HILL, S., MUNDAY, M., ROBERTS, A. & CLARKE, D. 1998. The economic impact of the arts and cultural industries in Wales. Unpublished Report, Cardiff University. [ Links ]
CALIFORNIA ARTS COUNCIL. 2004. The economic impact of non-profit arts and cultural organizations in California. Available at: http://www.cac.ca.gov [accessed 2009-11-18]. [ Links ]
CAMBRIDGE ARTS THEATRE. 2000. Cambridge Arts Theatre: Economic impact study, 1998-2000. Available at: http://www.culture.gov.uk/images/publications/Performing2001.pdf [accessed 2010-01-11]. [ Links ]
CAMERON, M.J. 2003. The relationship between input-output (I-O) analysis, social accounting matrices (SAM) and computable general equilibrium (CGE) models in a nutshell. Unpublished Working Paper, Global Insight Southern Africa. [ Links ]
CASEY, B., DUNLOP, R. & SELWOOD, S. 1997. Culture as commodity? The economics of arts and built heritage in the UK. Journal of Cultural Economics, 21(4):355-360. [ Links ]
ÇELA, A., KNOWLES-LANKFORD, J. & LANKFORD, S. 2007. Local food festivals in Northeast Iowa communities: A visitor and economic impact study. Managing Leisure, 12(2/3):171-186. [ Links ]
CENTRE FOR TOURISM RESEARCH IN AFRICA. 2007. A socio-economic impact assessment of the Cape Town International Jazz Festival 2007. Research Report, Cape Peninsula University of Technology. Available at: http://www.tourismstellenbosch.co.za/ctru/action/media/downloadFile?mediafileid=12934 [accessed 2010-01-26]. [ Links ]
CHANG, S. 2002. Estimating the economic impact of Bay Fest 2001. Unpublished Research Report, University of South Alabama. [ Links ]
CHOWDHURY, A. & KIRKPATRICK, C. 1994. Development policy and planning: An introduction to models and techniques. London & New York: Routledge. [ Links ]
CILLIERS, M.M. 2009. Notes by the Manager of Tourism Development and Marketing, Tlokwe City Council, Potchefstroom. [ Links ]
CLARK, D., GRAINGER, J. & JAFFRY, S. 2004. The Chichester Festival Theatre: Economic impact study 2003/04: Final report. Unpublished Report, Chichester District Council. [ Links ]
CONNINGARTH CONSULTANTS. 2006. Disaggregated social matrix for South Africa. Research Report, North West province Government Printer, Mafikeng. [ Links ]
CROMPTON, J.L. 1999. Measuring the economic impact of visitors to sport tournaments and special events. Available at: http://www.rpts.tamu.edu/faculty/Crompton/crompton-selected-books.shtml [accessed 2009-11-30]. [ Links ]
CROMPTON, J.L. 2006. Economic impact studies: Instruments for political shenanigans? Journal of Travel Research, 45(1):67-82. [ Links ]
CROMPTON, J.L. & LEE, S. 2000. Programs that work: The economic impact of 30 sports tournaments, festivals, and spectator events in seven U.S. cities. Journal of Park and Recreation Administration, 18(2):107-126. [ Links ]
CROMPTON, J.L., LEE, S. & SHUSTER, T.J. 2001. A guide for undertaking economic impact studies: The Springfest example. Journal of Travel Research, 40(1):79-87. [ Links ]
DANIELS, M.J., NORMAN, W. & HENRY, M. 2004. Estimating income effects of sport tourism event. Annals of Tourism Research, 31(1):180-199. [ Links ]
DENNISS, R. 2012. The use and abuse of economic modelling in Australia. Technical Brief no.12, The Australia Institute. [ Links ]
DEPARTMENT FOR CULTURE, MEDIA AND SPORT, CREATIVE INDUSTRIES. 2001. Mapping, Document 2001. Department for Culture, Media and Sport, Creative Industries, London. [ Links ]
DIVISION OF RESEARCH, MOORE SCHOOL FOR BUSINESS. 2002. The economic impact of the cultural industry on the State of South Carolina. University of South Carolina. Available at: http://www.southcarolinaarts.com/economic/study.shtml [accessed 2009-10-17]. [ Links ]
DWYER, L., FORSYTH, P. & SPURR, R. 2006a. Assessing the economic impacts of events: A computable general equilibrium approach. Journal of Travel Research, 45(1):59-66. [ Links ]
DWYER, L., FORSYTH, P. & SPURR, R. 2006b. Economic impacts of sport events: A reassessment. Tourism Review International, 10(4):207-216. [ Links ]
ECONOMIC BENEFITS DISTRIBUTION RESEARCH WORKING GROUP. 2005. Economic flow-back model to culture/heritage from tourism. Available at: http://dsp-psd.pwgsc.gc.ca/collection_2007/ch-pc/CH52-11-2005E.pdf [accessed 2009-11-18]. [ Links ]
EDMISTON, K.D. & THOMAS, M.X. 2004.The commercial music industry in Atlanta and the State of Georgia: An economic impact study. MEIEA Journal, 4(1):61-82. [ Links ]
FOURIE, J. & SANTANA-GALLEGO. M. 2010. The impact of mega-events on tourist arrivals. Working Paper, no. 171, Stellenbosch University. Available at: http://www.econrsa.org/papers/w_papersZwp171.pdf [accessed 2010-07-19]. [ Links ]
FRECHTLING, D. 2011. Exploring the full economic impact of tourism for policy making - extending the use of the tourism satellite account through macroeconomic analysis tools. White Paper United Nations World Tourism Organization, World Tourism Organization, Madrid, Spain. [ Links ]
GIESECKE, J.A. & MADDEN, J.R. 2013. Regional computable general equilibrium modeling. Handbook of computable general equilibrium modeling. Elsevier. [ Links ]
GILBERT, J. 2008. Trade policy, poverty and income distribution in computable general equilibrium models: An application to the South Asia free trade agreement. Working Paper, no. 14, Macao Regional Knowledge Hub. [ Links ] [Online] Available at: http://www.unescrap.org/tid/artnet/markhub/WP/wp14.pdf [accessed 2010-0819].
HAMILTON, C., GALLOWAY, S., LANGEN, F., CRAN, A., MACPHERSON, C., BURNS, M. & SNEDDEN, E. 2008. Scotland's year of the highland culture 2007. Evaluation Report, University of Glasgow. [ Links ]
HARRIGAN, F., MCGREGOR, P.G., DOURMASHKIN, N., PERMIAN, R., SWALES, K. & YIN, Y.P. 1991. AMOS: A macro-micro model of Scotland. Economic Modeling, 8:424-479. [ Links ]
HILLER, H.H. 1998. Assessing the impact of mega events: A linkage model. Current Issues in Tourism, 1(1):47-57. [ Links ]
HILL STRATEGIES. 2003. Economic impacts of 97 festivals and events. Available at: http://www.arts.on.ca/AssetFactory.aspx?did=425 [accessed 2009-11-19]. [ Links ]
HOLLAND, D. & WYETH, P. 1993. SAM multipliers: Their interpretation and relationship to input-output multipliers. In: OTTO, D.M. & JOHNSON, T.G. (eds.) Microcomputer-based input-output modeling: Applications to economic development. Boulder: Westview Press:181-197. [ Links ]
IRIS GROUP, WENDY MACDONALD AND ASSOCIATES, & JP CONSULTING. 2006. The economic impact of culture in Prince Edward Island and in the Charlottetown Region. Available at: http://www.city.charlottetown.pe.ca/fullcontent.cfm?objectid=40D6E3AC-2F40-4F9CBF6983E19D45E7BFandmethod=display_full [accessed 2007-04-24]. [ Links ]
JACKMAN, M. & GREENIDGE, K. 2010. Modeling and forecasting tourist flows to Barbados using structural time series models. Tourism and Hospitality Research, 10(1):1-13. [ Links ]
JAFFEE, B.L. 2009. The economic impact of Eli Lilly and Company on the State of Indiana and the Indianapolis-Carmel metropolitan statistical area. Available at: http://www.ibrc.indiana.edu/studies/20090604lilly-report-final.pdf [accessed 2010-09-03]. [ Links ]
KELSEY, C.W. & FORD, S. 2005. Conducting economic impact studies in Parks and Recreation. California Parks and Recreation Society Magazine, 61(2):1-8. Available at: http://www.play-safe.com/Documents/Magazines/CaliPRM3.pdf [accessed 2009-10-30]. [ Links ]
KING, B.B. 1988. What is SAM? In Pyatt, G. & Round, J.I. (eds.) Social accounting matrix: A basis for planning, Washington D.C: The World Bank. [ Links ]
KING, E.M. 2003. Accounting for culture: A social cost-benefit analysis of The Stan Rogers Folk Festival. Master's thesis, Dalhousie University. Available at: http://www.ruralnovascotia.ca/documents/intern%20reports%2002/03/2002Accounting%20for%20Culture.pdf [accessed 2009-10-30]. [ Links ]
LOFGREN, H. & ROBINSON, S. 2002. Spatial-network, general-equilibrium model with a stylized application. Regional Science of Urban Economics, 32:651-671. [ Links ]
LUNDBERG, D.E., KRISHNAMOORTHY, M. & STAVENGA, M.H. 1995. Tourism economics. New York: John Wiley & Sons. [ Links ]
LYNCH, T. & HARRINGTON, J. 2003. The economic impact of the Florida Wakulla Springs Birding and Wildlife Festival. Unpublished Report, Florida State University. [ Links ]
MANN WEAVER DREW/DE MONTFORT UNIVERSITY. 2003. The economic impact of the Notting Hill Carnival. Available at: http://www.impact.arts.gla.ac.uk/record/8 [accessed 2009-06-24]. [ Links ]
MAREE, K. & PIETERSEN, J. 2010.The quantitative research process. In: MAREE, K. (ed.) First steps in research. Pretoria: Van Schaik Publishers:145-153. [ Links ]
MAYNE, B. 2010. Report to the finance, ethics and strategic planning committee: Evaluation of taste orange food and wine festival at Bondi and a proposal to extend the festival for a further three years. Available at: http://www.waverley.nsw.gov.au/_data/assets/pdf file/0019/12097/TasteOrangeFestival.pdf [accessed 2010-07-21]. [ Links ]
MCGREGOR, P.G., SWALES, J.K. & YIN, Y.P. 1996. A long-run interpretation of regional input-output. Journal of Regional Science, 36:479-501. [ Links ]
MCGREGOR, P.G., SWALES, J.K. & YIN, Y.P. 1999. Spillover and feedback effects in general equilibrium interregional models of the national economy: A requiem for inter-regional input-output? In: Hewings, G.J.D., Sonis, M., Madden, M. & Kimura, Y. (eds.) Understanding and interpreting economic structure. Berlin: Springer:167-190. [ Links ]
MCHUGH, D. 2006. A cost-benefit analysis of an Olympic Games. Master's thesis, Queen's University. [ Links ]
MCINTYRE, M.H. 2004. The impact of folk festivals. Available at: http://www.newaudiences.org.uk/resource.php?id=407 [accessed 2009-04-24]. [ Links ]
MEASELLS, M.K. & GRADO, S.C. 2008. Economic impacts of two birding festivals in Mississippi. Paper presented during the Southern Forest Economics Workshop 2007: Global change and forestry: economic and policy implications:142-149. Available at: http://fwrc.msstate.edu/research.asp?id=18andpage=publications [accessed 2009-11-23]. [ Links ]
MILNE, S., DICKSON, G., MCELREA, A. & CLARK, V. 2005. Micro sporting event impacts in regional New Zeeland: The TRACE Sports Project. In Allen, J. (ed.) Proceedings of international event research conference, Sydney, Australia. Australian Centre for Event Management:429-442. [ Links ]
MYERSCOUGH, J. 1988. The economic importance of arts in Britain. London: Policy Studies Institute. [ Links ]
NARAYAN, P.K. 2004. Economic impact of tourism on Fiji's economy: Empirical. Tourism Economics, 10(4):419-433. [ Links ]
O'BRIEN, J. & FEIST, A. 1995. Employment in the arts and cultural industries: An analysis of the 1991 census. Arts Council of England Research Report, no. 2, Arts Council of England. [ Links ]
O'CONNOR, J. 1998. The cultural production sector in Manchester. Manchester: Research and strategy, Manchester City Council, North West Arts Board in association with Manchester TEC and Manchester Investment and development agency (MIDAS), Manchester. [ Links ]
O'CONNOR, R. & HENRY, E.W. 1975. Input-output analysis and its applications. London: Charles Griffin & Company. [ Links ]
PARTRIDGE, M.D. & RICKMAN, D.S. 1998. Regional computable general equilibrium modeling: A survey and critical appraisal. International Regional Science Review, 21:205-248. [ Links ]
POTCHEFSTROOM BUSINESS DIRECTORY. 2010. Potchefstroom: Potchefstroom Business Chamber. [ Links ]
PRICEWATERHOUSECOOPERS. 2005. Olympic games impact study. Available at: http://www.culture.gov.uk/NR/rdonlyres/E88F2684F49E4F45B8262F19F21374F8/O/OlympicGamesImpactStudy.pdf [accessed 2009-06-08]. [ Links ]
PYATT, G.S. 1988. A SAM approach to modelling. Journal of Policy Modelling, 10(3):327-352. [ Links ]
RIVERA, M.A., HARA, T. & KOCK, G. 2008. Economic impact of cultural events: The case of the Zora! Festival. Journal of Heritage Tourism, 3(2):121-137. [ Links ]
ROLIM, C. & KURESKI, R. 2006. Impacto económico de Curto Prazo das Universidades Estaduais Paranaenses. Curitiba. Relatório de pesquisa realizada para a Secretaria de Ciência, Tecnologia e Ensino Superior do Estado do Paraná [ Links ].
ROSSOUW, R. & SAAYMAN, M. 2011. Assimilation of tourism satellite accounts and applied general equilibrium models to inform tourism policy analysis. Tourism Economics, 17(4):753-783. [ Links ]
RYAN, C. 1998. Economic impacts of small events: Estimates and determinants - a New Zealand example. Tourism Economics, 4(4):339-352. [ Links ]
RYAN, C. & LOCKYER, T. 2001. An economic impact case study: The South Pacific Master's Games. Tourism Economics, 7(3):267-275. [ Links ]
SAAYMAN, M. & ROSSOUW, R. 2010. The Cape Town International Jazz Festival: More than just jazz. Development Southern Africa, 27(2):255-272. [ Links ]
SAAYMAN, M., ROSSOUW, R. & SAAYMAN, A. 2008. Economic impact of visitor spending at the Cape Argus Pick n Pay Cycle Tour. Africa Insight, 38(3):100-122. [ Links ]
SAAYMAN, M. & SAAYMAN, A. 2004. Economic impact of cultural events. South African Journal of Economics and Management Sciences, 7(4):629-641. [ Links ]
SAAYMAN, M. & SAAYMAN, A. 2006. Creating a framework to assess the economic contribution of the national parks in South Africa: The case of the Addo Elephant National Park. Tourism Economics, 12(4): 619-633. [ Links ]
SAAYMAN, M. & SAAYMAN, A. 2012. Determinants of spending: An evaluation of three major sporting events. International Journal of Tourism Research, 14(2):124-138. [ Links ]
SAAYMAN, M., SAAYMAN, A. & DU PLESSIS, C. 2005. Analysis of spending patterns of visitors of three World Cup cricket matches in South Africa. International Journal of Sports Tourism, 10(3):211-221. [ Links ]
SAAYMAN, M., SAAYMAN, A. & FERREIRA, M. 2009. The socio-economic impact of the Karoo National Park. Koedoe, 51(1):1-10. [ Links ]
SCHOOMBIE, S. 2003. Feesmanie. In: Aardklop Nasionale kunstefees (ed.) Aardklop feesboek. Potchefstroom: Aardklop Nasionale Kunstefees:10-13. [ Links ]
SCHWARM, W. & CUTLER, H. 2006. Building small city and town: SAMs and CGE models revisited. In: Doi, M. (ed.) Computable general equilibrium approaches in urban and regional policy studies. Singapore: World Scientific, pp. 59-81. [ Links ]
SELWOOD, S. 2001. The UK cultural sector: Profile and policy issue. London: Policy Studies Institute. [ Links ]
SEUNG, C.K., HARRIS, T.R., ENGLIN, J.E. & NETUSIL, N.R. 2000. Impacts of water allocation: A computable general equilibrium and recreational demand model approach. Annals of Regional Science, 34:473-487. [ Links ]
SILVA, B., MANN, M. & DANIEL, H. 2008. Economic impact of the 2008 American Folk Festival in Bangor, Maine. Research Report, University of Maine. [ Links ]
SNOWBALL, J.D. 2000. Towards more accurate measurement of the value of the arts to society: Economic impact and willingness to pay studies at the Standard Bank National Arts Festival. Master's thesis, Rhodes University. [ Links ]
SNOWBALL, J.D. & ANTROBUS, G.G. 2003. Art for the masses? Measuring the economic and social value of the Grahamstown National Arts Festival to the town's lower income and education groups. Working Paper, no. 23, University of Fort Hare. [ Links ]
SNOWBALL, J.D. & WEBB, A.C.M. 2008. Breaking into the conversation: Cultural value and the role of the South African National Arts Festival from apartheid to democracy. International Journal of Cultural Policy, 14(2):149-164. [ Links ]
SQW LIMITED & TNS TRAVEL AND TOURISM. 2005. Edinburgh's year round festivals 2004-2005: Economic impact. Available at: http://www.edinburgh.gov.uk/internet/Attachments/Internet/Business/Economic_development/ Edinburgh's_Year_Round_Festivals_2004-2005_-Economic_Impact_Study.pdf [accessed 2009-10-14]. [ Links ]
STATISTICS SOUTH AFRICA. 1998. Supply and use tables (SU-tables). Report no. 04-04-01, Statistics South Africa. [ Links ]
STRYDOM, A.J., SAAYMAN, M. & SAAYMAN, A. 2006. The economic impact of the Volksblad Arts Festival. Acta Commercii, 6(1):87-98. [ Links ]
STYNES, D.J. 1997. Economic impacts of tourism. Available at: https://www.msu.edu/course/prr/840/econimpact/pdf/ecimpvol2.pdf [accessed 2009-10-17]. [ Links ]
STYNES, D.J. 1999. Guidelines for measuring visitor spending. Available at: https://www.msu.edu/course/prr/840/econimpact/pdf/ecimpvol3.pdf [accessed 2014-09-18]. [ Links ]
STYNES, D.J. 2002. Economic impacts of national parks on gateway communities: Summary of MGM2 shortform analysis. Research Report, Michigan State University. [ Links ]
STYNES, D.J. 2008. National park visitor spending and payroll impacts, 2007. Available at:http://www.nature.nps.gov/socialscience/MGM2CY07.pdf [accessed 2010-07-18]. [ Links ]
STYNES, D.J. & WHITE, E.M. 2006. Reflections on measuring recreation and travel spending. Journal of Travel Research, 45(1):8-16. [ Links ]
SUNDANCE INSTITUTE. 2009. Sundance Film Festival reaches record economic impact of $92.1 million. Film festival today, 18 June. Available at: http://www.sundance.org/pdf/2009-06-17-economic-impact.pdf [accessed 2009-11-12]. [ Links ]
TOHMO, T. 2005. Economic impacts of the cultural events on local economies: An input-output analysis of the Kaustinen Folk Music Festival. Tourism Economics, 11(3):431-451. [ Links ]
TRAVERS, T. 1998. The Wyndham report: The economic impact of London's West End Theatre. London: Society of London Theatre. [ Links ]
TREMBLAY, P., BOYLE, A., RIGBY, H. & HAYDON, J. 2004. Assessing the value and contribution of the Darwin Festival 2004: A trial of the national events evaluation kit. Queensland: Sustainable Tourism Cooperative Research Centre. [ Links ]
URS FINANCE AND ECONOMICS. 2004. Economic impact of the Rugby World Cup 2003 on the Australian economy - post analysis. Available at: http://fulltext.ausport.gov.au/fulltext/2004/feddep/FinalEconomicImpactOfRWC2003.pdf%5B [accessed 2009-07-12]. [ Links ]
VAN SCHALKWYK, C. 2004. The economic impact of the Klein Karoo National Arts Festival in Oudtshoorn. Master's thesis, North-West University, Potchefstroom Campus. [ Links ]
VAN WYK, L.J.M. 2012. Critical assessment of economic impact analysis at selected national festivals. Potchefstroom: Institute for Tourism and Leisure Studies, North-West University, Potchefstroom Campus. [ Links ]
VAN ZYL, C. 2008. A conjoint analysis of festival attributes for successful positioning of selected arts festivals in South Africa. Southern African Business Review, 12(3):128-155. [ Links ]
VAUGHAN, D.R., FARR, H. & SLEE, R.W. 2000. Estimating and interpreting the local economic benefits of visitor spending: An explanation. Leisure Studies, 19(2):95-118. [ Links ]
VIRGINIA DEPARTMENT OF CONSERVATION AND RECREATION. 2007. 2007 Virginia outdoors plan. Available at: http://www.dcr.virginia.gov/recreationalplanning/documents/vopall.pdf [accessed 2010-07-18]. [ Links ]
WAGNER, J.E. 1997. Estimating the economic impact of tourism. Annals of Research, 24(3):592-608. [ Links ]
WATERHOUSE, C. 2009. Taste costs review call. The Mercury, 2 January 2009. Available at: http://www.themercury.com.au/article/2009/01/02/47411tasmania-news.html [accessed 2010-07-21]. [ Links ]
WELSH ECONOMY RESEARCH UNIT, AND DCA (CARDIFF). 1998. The economic impact of the arts and cultural industries in Wales. Arts Council of Wales, The Welsh Development Agency, the Development Board for Rural Wales and S4C. Cardiff. [ Links ]
WEST, G. 1995. Comparison of input-output, input-output econometric and computable general equilibrium impact models at the regional level. Economic Systems Research, 7(2):209-227. [ Links ]
WEST, G. & BAYNE, B. 2002. The economic impacts of tourism on the Gold Coast. Altona: Common Ground Publishing. [ Links ]
YELLOW PAGES. 2009/2010. North West province. Durban: Yellow Pages Group, Trudon. [ Links ]
Accepted: October 2014

