


Serviços Personalizados
Artigo
 Inglês (pdf)
 Artigo em XML
 Referências do artigo
Indicadores

Links relacionados
-
 Citado por Google
 -
 Similares em Google
Compartilhar

 Permalink
South African Journal of Economic and Management Sciences
versão On-line ISSN 2222-3436
versão impressa ISSN 1015-8812
S. Afr. j. econ. manag. sci. vol.18 no.1 Pretoria 2015
http://dx.doi.org/10.17159/2222-3436/2015/v18n1a7
ARTICLES
The role of cost of capital in regulatory capital discrepancies among developing countries
Johann Jacobs; Gary van Vuuren
Department of Economics, North-West University
ABSTRACT
Capital as a regulatory instrument has been shown to contribute to competitiveness distortions between developed and developing countries. There is a dearth of literature that analyses the possibility of further competitiveness discrepancies to which capital requirements may contribute among developing countries.
This article explores whether regulatory capital requirements lead to unequal competitive conditions between developing countries based on their costs of capital. It also attempts to identify drivers of such discrepancies. Data of 52 financial institutions from 20 countries spread across 4 geographical regions are used for the analysis.
Key words: capital requirements, cost of capital, developing economies, banks, Basel, Solvency II
1 Introduction
This article aims to build on previous work done by Jacobs and Van Vuuren (2013) by further investigating capital requirements as a regulatory tool and assessing whether these requirements can achieve their objective of providing level playing fields (specifically with regard to the cost of capital) between countries. Financial regulations as a whole (specifically the Basel Accords (Basel) and Solvency II) are used as the basis for the inquiry. The article also explores possible drivers of any significant discrepancies (if any) between various developing countries' cost of capital (COC).
This article is structured as follows:
Section 2 introduces the objectives of this research before section 3 provides a brief overview of relevant literature. The methodology, data, and assumptions employed in this article are described in section 4 while the results and findings are presented in section 5. Section 6 concludes.
2 Objective
Jacobs and Van Vuuren (2013) showed that the COC differs between various countries and that it increases considerably between developing countries compared with developed economies as more country-specific factors are factored into the calculation. As a result, international capital requirements, which are generic assume that the COC between countries is equal which serves as the basis for financial regulation, not providing for an equitable competitive footing for all. On the contrary, the results show that financial institutions in developing countries are dis-advantaged relative to those in developed countries. Figure 1 shows a COC comparison for different economies and the increase in the COC between developed countries and developing countries as more country-specific factors are added can be seen. The results denoted as 'WACC1' were calculated using the original calculation methods for the cost of debt, the cost of equity and the weighted average cost of capital (WACC), while for WACC2 the same calculation methods were employed as for WACC1, but a country risk premium was added to the cost-of-equity component. WACC refers to results obtained using a model by Villarreal & Córdoba (2010). These calculation methods are explained in detail by Jacobs and Van Vuuren (2013:7-15,21-23).
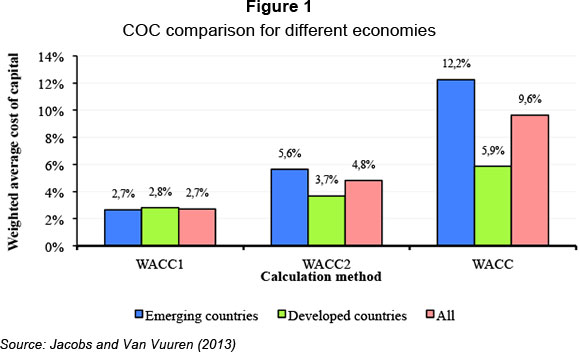
Figure 1 shows the COC of groups of developed and developing countries based on three different calculation methods for obtaining the WACC, with each group using more country-specific factors as inputs. For developing countries, the results indicate that the comparative COC between developed and developing countries increases at an increasing rate as more country-specific factors are considered.
The question thus arises whether the COC between various developing countries may provide the basis for even further competitive distortions as a result of regulatory capital requirements and, if so, what might contribute to such inter-group discrepancies?
This article therefore further explores whether capital requirements as a regulatory tool can achieve their objective of levelling playing fields between countries, specifically with regard to their COC. An attempt will also be made to establish the drivers of discrepancies (if any) between developing countries' COC. In considering whether regulations based on minimum capital requirements can provide for equal competitive conditions among financial institutions, it may be argued that there may be an offset in the cost of capital (which is based on systematic risks) in some countries in financial institutions' actual capital requirements (which are based on idiosyncratic risks). In other words, some financial institutions may be required to hold less capital although this capital costs them more than it does other financial institutions. However, as was the case in the study by Jacobs and Van Vuuren (2013), the relationship between idiosyncratic risks (capital requirements) and systematic risks (the cost of capital) falls outside the scope of this article. This article does not attempt to relate the cost of capital back to the capital requirements of individual financial institutions, but focuses instead on the cost of capital between financial institutions based in different countries.
It is also important to note that the comparison of the cost of capital is done from an "outsider's" perspective and not from the per-spective of a company wishing to raise capital domestically. It would have been inappropriate had a country risk premium been added, if this study were for different companies within the same country. For this reason it is deemed acceptable to add country risk premia to the calculations of the cost of capital to all of companies in this study.
3 Literature review
It is important to note that this article explores financial regulations in general, including banking (Basel) and insurance regulations (Solvency). The basis for this choice is that both sets of regulations share two similarities:
- both set out to achieve the same broad objectives, i.e. to promote and contribute to financial-sector stability; to level playing fields between financial institutions; and to be based on risk-sensitive tools and measures; and
- both are based on similar principles using a three-pillar approach where Pillar 1 involves minimum capital requirements as the cornerstone of both sets of regulations (Bank for International Settlements (BIS), 1999:9; 2006: 6; Shadow Financial Regulatory Committees (SFRC), 1999:2; De Carvalho, 2005:7-8; Horcher, 2005:257; Lind, 2005:28; the European Insurance and Re-insurance Federation (CEA), 2006:5; Koch & MacDonald, 2006: 312; the Commission of the European Communities (CEC), 2007:3; Sandström, 2007:12; Van Duffel, 2008; European Union (EU), 2009:3; Lloyd's, 2010:8).
Background: Levelling of playing fields and expansion of a previous study
The aim underlying the second objective of financial regulations, i.e. the levelling of playing fields between financial institutions, is to eliminate competitive advantages that some institutions might enjoy by holding lower levels of capital by introducing minimum capital requirements (Jacobs & Van Vuuren, 2013:4). For the achievement of this objective, the premise is based on the implicit assumption that the COC between countries is the same, since if there were discrepancies, this objective would be unattainable. However, Jacobs andVan Vuuren (2013) showed that the COC doesindeed differ between countries and that it increases considerably for developing countries as more country-specific factors are factored into the calculations. These results indicate that capital as regulatory tool may not fulfil the goal of competitive equality and that developing countries are disadvantaged compared to developed countries.
In this article, these findings will be expanded upon by exploring whether the COC between developing countries provide for similar competitive distortions and to determine possible drivers of such discrepancies in the COC between developing countries.
COC literature
Much literature is available on calculating the COC using the WACC by combining the cost of debt and the cost of equity as approximated by the capital asset pricing model (CAPM) (Markowitz, 1952; 1959; Roy, 1952; Modigliani & Miller, 1958; Sharpe, 1964; Lintner, 1965; Mossin 1966; Annin & Falaschetti, 1998; French, 2003; Fama & French, 2004:13; Exley & Smith 2006:230). Although these models have weaknesses (McCauley & Zimmer, 1989; Shoven & Topper, 1992; Godfrey & Espinosa, 1996;Estrada, 2001; Lally, 2004; Lambert, Leuz &Verrecchia, 2006; Lambert & Verrecchia, 2010; McMorran, 2010), they are considered useful in the calculation of COC approximations for countries (Bruner, Eades, Harris & Higgins, 1998:15; Brealey, Myers & Marcus, 2001:572;Ross, Westerfield & Jaffe, 2003:543).
As was the case in the study by Jacobs & van Vuuren (2013), for the sake of brevity and because these are widely available in literature, the formulas for calculating the components of, and the COC, are not included in this article.
There exists an abundance of research onthe topic of the COC, the COC between countries, and the COC for developing countries. Research that was considered in this article included those by McCauley and Zimmer (1989); Shoven and Topper (1992); Godfrey and Espinosa (1996); Estrada (2001); Hail and Leuz (2003, 2008); Lally (2004); Exley and Smith (2006); Jenkinson (2006); Lambert, Leuz and Verrecchia (2006); Lambert and Verrecchia (2010); McMorran (2010); Sanchez, Preve and Allende (2010); Nekrasov (2012). The major research that was considered for this article included those of Erb, Harvey andViskanta (1996); Koedijk, Kool, Schotman, and Van Dijk (2002); Harvey (2004, 2005);Sercu (2008); Villarreal and Córdoba (2010).
Specifically regarding the COC for developing countries:
Harvey (2004) explored the components of country risk, i.e. political, economic, and financial risks and the effects that these may have on expected returns based on an implied COC model. Harvey found country risk to be an important driver of expected returns, particularly in emerging markets, because of their segregated nature from global financial markets.
This research builds on Erb et al. (1996), who used alternative measures of calculating expected returns and volatility in developing markets to explore the assumption that it is not appropriate to use the country beta with respect to a world market portfolio as a measure of risk for segregated capital markets. The approach uses country credit ratings as a proxy for the ex ante risk exposure for such segregated countries.
The relative segregation of emerging markets from global markets along with their increased riskiness remain challenges to obtaining more accurate approximations of their cost of equity capital. Although many different theories and approaches to determine more accurate results exist, there is no uniformity in terms of calculating the cost of equity capital among countries (Estrada, 2001:10).
Villarreal and Córdoba (2010) explored a consistent approach to calculating the COC in emerging markets and reinforce the need to adjust traditional methods of calculating theCOC.
The recurring themes from literature reviewed regarding the calculation of countries' COC are:
- the calculation of the COC between countries remains a contentious subject and, although much research has been, and continues to be done, an accurate universal method of obtaining results remains elusive;
- CAPM and WACC remain a popular base from which the COC is calculated; and
- certain adjustments need to be made tothe original CAPM and WACC modelsfor greater accuracy, specifically around developing countries that are less integrated in global markets, where asset returns are not well correlated to world returns, and also for country risk associated with developing countries. However, there is not conformity on the exact nature of such adjustments.
Despite this profusion of research on the topics highlighted, the research in this article builds on previous literature and adds a different dimension to current literature in that it analyses the COC between developing countries with the aim of assessing whether financial regulations based on capital requirements can achieve their objective of providing financial institutions with equal competitive conditions from a regulatory perspective. This article further adds to current literature in that it analyses the major drivers behind the COC in developing countries.
4 Calculation methods and analysis
A comparative analysis of the COC was conducted for 52 financial institutions across 4 different 'developing economy' regions to determine whether capital requirements further distort competitiveness among developing countries.
4.1 Calculation methods
There are various methods to calculate the COC and, depending on the models and assumptions used, results can vary significantly. In addition, calculating the COC for developing countries is challenging because their markets are less integrated into global markets and due to other country-specific factors. This article employs the same calculation methods used by Jacobs and Van Vuuren (2013), namely:
- the CAPM and WACC in their originalformat;
- the original CAPM and WACC where an equity risk premium is added to the cost of equity; and
- the modified CAPM and WACC asexplained by Villarreal and Córdoba (2010).
Since this article builds on the work of Jacobs and Van Vuuren (2013) in which the details of the different calculation methods and their formulas are explained, all these details are not included in this article for the sake of brevity.
In pursuit of its objectives, this article employs the Villarreal and Córdoba (2010) model because it has been specifically developed with the calculation of the cost of capital for developing countries. This model makes certain adjustments to the original models based on three assumptions, namely (i) that spot market prices represent efficient estimators; (ii) that country risk is a non-diversifiable risk and that investors require a premium on returns based on the perception of increased country risk; and (iii) that agency costs (transaction costs, taxes and intermediation spreads) are taken into account in a model.
It is necessary to highlight that the calculation of the COC between countries remains a contentious subject, especially for such calculations among developing countries. Two challenges that are often highlighted include the term structure of credit ratings and the time variation of risk premiums (Erb, et al., 1996; Harvey, 2004, 2005). These time-dependencies might be as a result of external events and/or shocks and may impact the calculations of the COC. In pursuing its objective, this paper did not explicitly take into account these time effects through advanced regressions analyses as often prescribed. This paper rather focuses on the results of a model that is applied consistently across a sample set of countries instead of focussing on the effect of time on the calculations of the COC.
The Villarreal and Córdoba (2010) model considers the COC as an opportunity cost and makes the above adjustments in the WACC and CAPM so that the results obtained by both the CAPM and the WACC should be identical based on the consistent application of the adjustments. This provides an important and useful check on the validity of the consistent application of these principles. According to this model, the WACC formula used includes the principles described above and taxes, transaction cost and an additional country risk (CR) component are present. This WACC formula is shown as Equation 1:

Where D is the total debt capital of a particular company, D + E the total capital of the company, K'Dthe pre-tax cost of debt, E the total equity capital of the company, and KEthe cost of equity. K'Dis presented by the cost of debt (KD) (risk-free rate (RF) plus intermediation spread) plus a CR premium:

Again, since this article employs the same model as was used by Jacobs and Van Vuuren (2013), the detailed formulas are not included in this article. With this in mind, the CAPM formula as modified by Villarreal and Córdoba (2010) is as follows:

Where βL, is levered beta, or the beta of a company where financial leverage is taken into account, or where debt is incorporated into a company's capital structure and RM represents equity market returns.
Villarreal and Córdoba (2010) applies a principle of coherence such that the opportunity cost calculation does not depend on the method used so that there is consistency between CAPM and WACC, meaning that the results of the WACC and CAPM should be equal and the one can be used to verify the other.
This model is employed as the major calculation method in this article as it was developed specifically for calculating the COC for developing countries by taking into account some specific developing country peculiarities and features.
4.2 Data
The data used for this article were for banks only, yet it is assumed that the results obtained by using these data can be applied across financial institutions, including insurance companies, as both Basel and Solvency II use capital requirements as basis and both have similar stated objectives as highlighted by Jacobs and Van Vuuren (2013).
This research aims to illustrate the COC among developing countries and the first principle of the data selected was that the data needed to be representative for countries across different regions. However, in keeping with one of the major assumptions of the Villarreal and Córdoba (2010) model, these markets had to be efficient with at least some degree of sophistication and integration into global markets.
Obtaining data for developing countries remains a challenge and the data that were used were driven by a second principle, namely one of data availability.
Sample countries and institutions
The data that were used divided developing countries into four major regions, namely emerging markets: Asia; emerging markets: Europe; emerging markets: Latin America; and emerging markets Middle East and Africa (MEA). The intention was to obtain data from Bloomberg for four countries per region and three banks per country; however, this was not always possible so different sample sizes were used.
Asia's emerging market comprised data from 12 banks (3 from each country including China, India, Indonesia, and the Philippines).
Europe's emerging-market economies posed a challenge and data were used for the following countries (number of banks indicated in brackets): Kazakhstan (1), Poland (3), Russia (3), Slovenia (2), and Turkey (3).
Data for 13 banks from 5 countries were used to create the sample for Latin America. The countries were (number of banks for each country indicated in brackets) Argentina (3), Brazil (3), Chile (2), Mexico (3), and Peru (2).
MEA comprised 15 banks made up of 3 banks from each of the following5 countries: Bahrain, Kuwait, Nigeria, Saudi Arabia, and South Africa.
As far as possible, the largest banks in each country were selected based on balance-sheet size1, all of which can be seen in Appendix B. Financial groups were included in some cases (i.e. not only banks), as the aim was not necessarily to calculate the COC for banks only but rather to estimate the COC among countries based on banking data.
Time series
Selecting a time period over which to conduct the analyses was based on three principles: the data must:
- be sufficient to provide meaningful results;
- include benign and challenging economic conditions; and
- be selected from the recent past.
With these in mind, the time period selected for the analyses was for the seven years 2005 to 2011.
Risk-free rate (RF)
The RF used was the average daily United States (US) ten-year Treasury bond rate obtained from the Federal Reserve Bank of St Louis Economic Data (FRED, 2012) over the period analysed, namely 3.80 per cent. This assumption is considered as being rather conservative, considering that most countries that were used in this study will have a higher RF than the US.
Equity market returns (RM)
RM is the average returns for the period analysed and were calculated using the returns for each country's equity market using each country's Morgan Stanley Capital International (MSCI) index as a proxy for equity returns.
Equity returns (RE)
The actual daily equity price movements of each of the institutions analysed in the sample set was obtained from Bloomberg (2012) and the equity returns were calculated for each for the period analysed.
Intermediation spreads
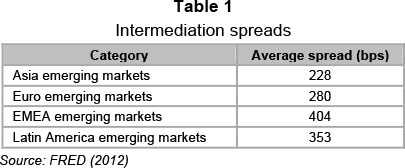
An intermediation spread is added to the cost of debt and the Villarreal and Córdoba (2010) model calculates a company's interest-coverage ratio in order to obtain its assumed credit rating. For this article, however, the intermediation spread was calculated using the method of Jacobs and Van Vuuren (2013). For this, data were obtained from FRED (2012) and in keeping with the composition of the dataset that divides the countries used into geographical areas, the categories of the data that were used are reflected in Table 1 where the average spread is the average daily basis points (bps) spread per category above the assumed RF.
Country risk spread
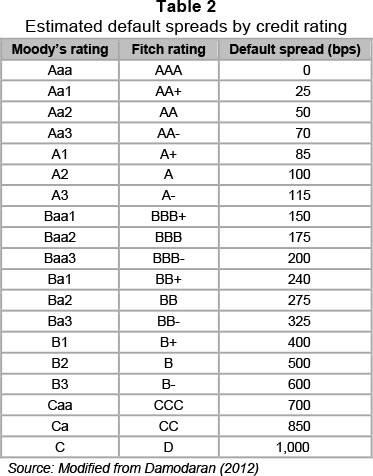
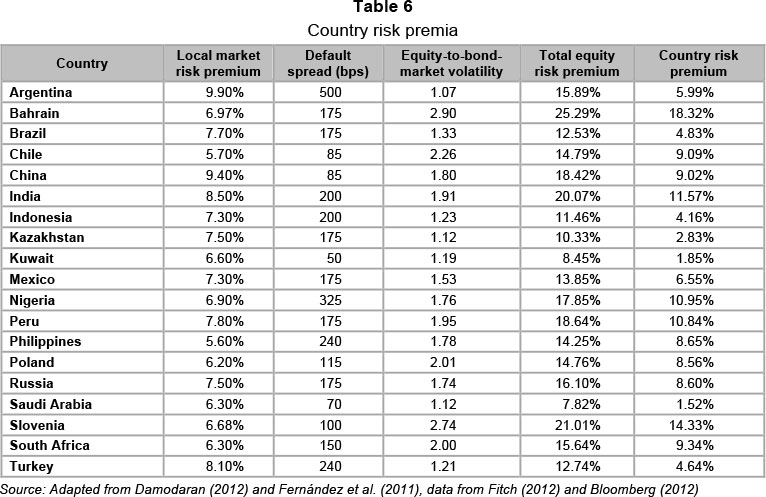
To estimate the CR premium, data were used from Damodaran (2012), who uses country credit ratings as a starting point to obtain defaults spreads in bps. This information adds this spread to a market risk premium (assumed to be 5.5 per cent for mature financial markets) before multiplying it by a volatility factor (1.5) that represents the equity-to-bond market spread to get to a total equity risk premium. The country risk premium is obtained by subtracting the market risk premium from the total equity market premium.
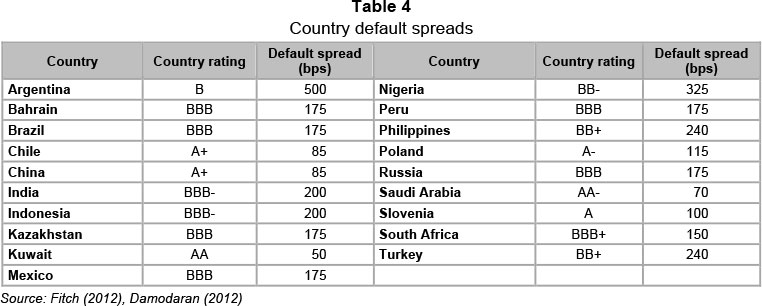
Local currency credit ratings were obtained from Fitch (2012) and used to obtain a default spread in bps above the US Treasury bond rate using historical credit data of US corporates and country bonds. Default spreads are shown in Table 2.
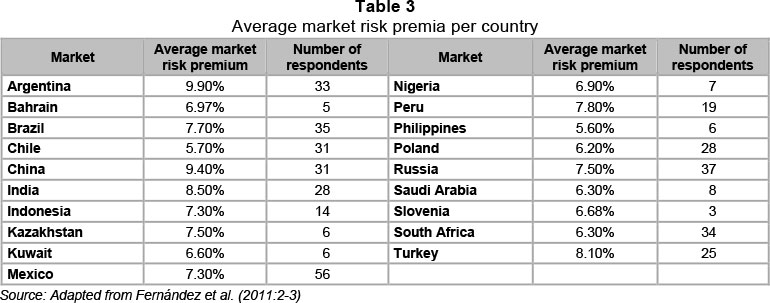
Instead of using this flat 5.5 per cent, the same methodology was employed to estimate the CR premium as that used by Jacobs and Van Vuuren (2013) in that data were obtained from Fernandez, Aguirreamalloa & Corres (2011). The average market risk premia are given in Table 3.
For countries where there were five or fewer responses as per the survey used, the averages of the countries in the group they fall into were used (Bahrain 6.97 per cent and Slovenia 6.68 per cent).
Bps default spreads were obtained from Table 2, but each country's credit rating as measured by Fitch was obtained so that the default spread that was used for each country could be obtained. This is shown in Table 4.
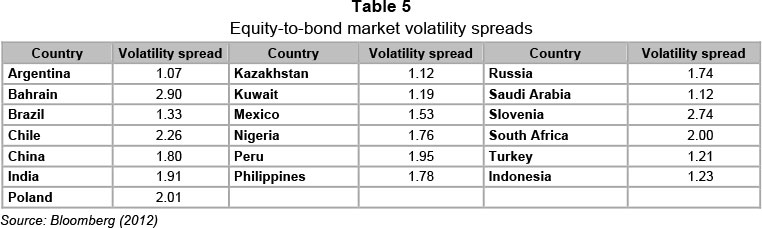
For the equity-to-bond market volatility spread, individual country spreads were calculated using the returns for each country's equity markets over the sample period using each country's Morgan Stanley Capital International (MSCI) index as a proxy for equity returns (where possible) and the Emerging Markets Bond Index (EMBI) for bond market returns for all the countries. Kazakhstan and Saudi Arabia do not have a country-specific MSCI index and the MSCI Europe and Middle East index was used as a proxy for these two countries respectively. This approach differs from that of Damodaran (2012), who used a fixed factor of 1.5 as an input for the equity-to-bond market volatility spread.
The relative volatilities for each of the countries' stock market returns against these bond market return proxies that were obtained are given in Table 5.
Finally, as explained earlier, the country risk rating was obtained, i.e. by subtracting the local market risk premium from the total equity risk premium. These results are shown in Table 6.
Betas (βU,βE,βI)
βU is the beta of a specific equity while βE,as per Villarreal and Córdoba (2010), refers to a beta which is adjusted by the debt-to-equity ratio  of a company, and reflects systematic risk given a company's
  βL is as described previously.
βU was calculated using the standard variance-covariance approach in which each bank's monthly equity returns over the sample period were used to calculate the beta relative to each country's MSCI index described above. βE and βLwere derived as explained by Jacobs and Van Vuuren (2013).
Debt-to-equity ratios  , total debt (D) and total equity (E)
For banks'  ,D and E, data were obtained from Bloomberg (2012) where these ratios are calculated.
Bank credit support ratings
These ratings are used in a regression analysis (refer to section 5.4.2 for further details in this regard) and they indicate the likelihood that governments will support distressed banks in their jurisdiction. A value of '1' indicates that there is a strong likelihood of the government involved assisting the bank in an attempt to prevent it from failing, while a value of '5' shows that the likelihood of such assistance extended to the bank is low. These ratings were obtained from Fitch (2012).
The data set out above were used as inputs to calculate the COC according to the three chosen methods explained in section 4.1.The results and findings are presented in section 5.
5 Results and findings
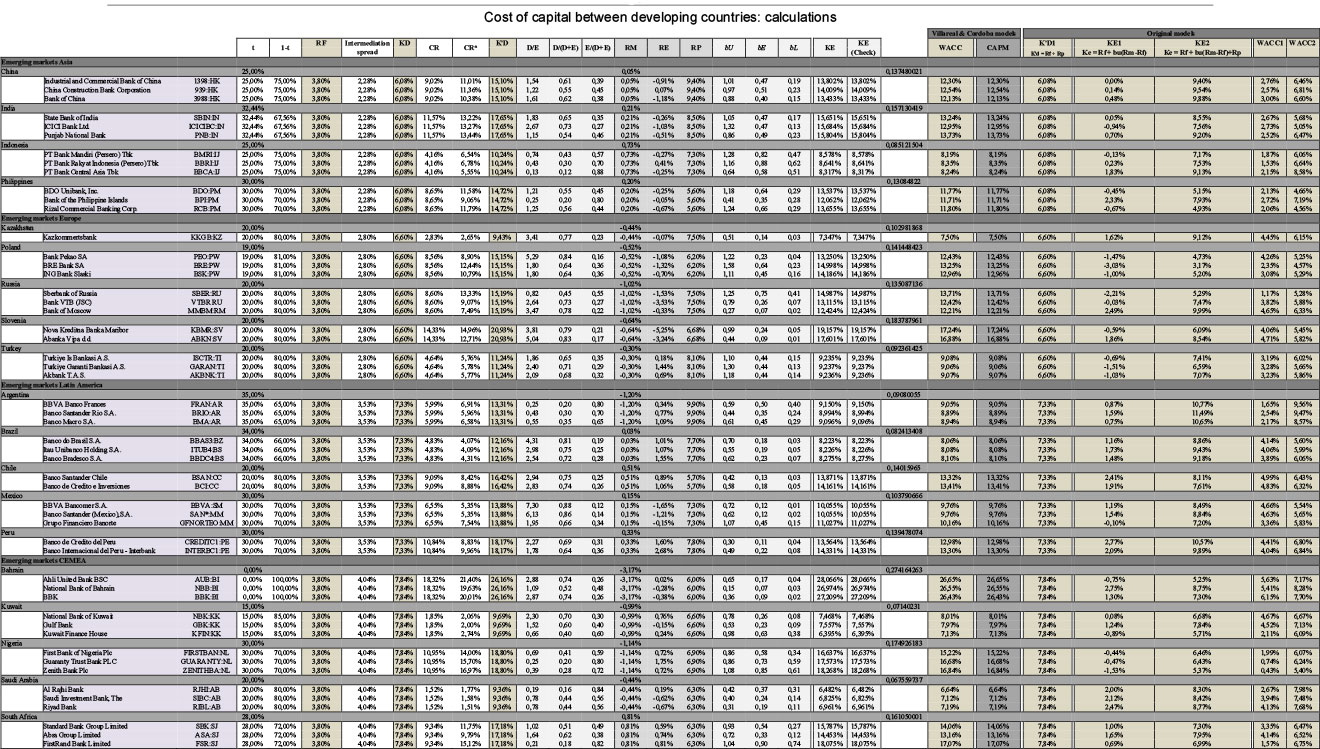
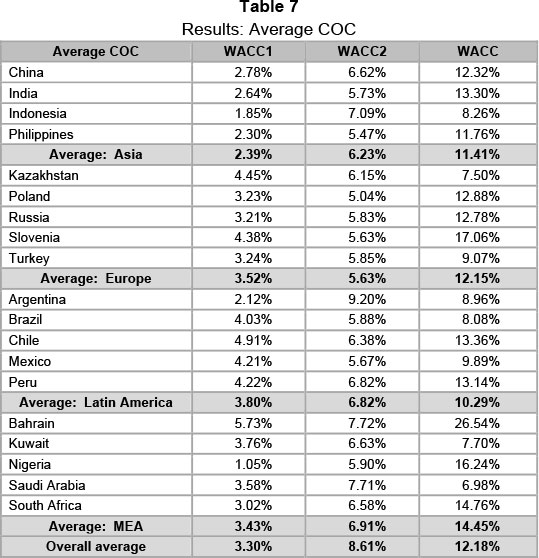
The results are presented in the following sections, each section highlighting the method employed and the results obtained. Some inputs and the full set of results are presented in Appendix B. The averages of the COC per country are illustrated by Table 7. It should be noted that these results form the basis for the linear regression analysis conducted in section 5.4.
5.1 Original WACC (WACC1)
These results obtained from the traditional calculation method for the WACC is denoted by 'WACC1' in Table 7 and in the results presented in Appendix B. These results were calculated using the original formulas for the cost of debt, the cost of equity using the CAPM, and for obtaining the WACC.
Using this method, the average COC was 3.3 per cent across all observed countries and the COC across the four regions varied by only 1.4 per cent, with Asia averaging the lowest at 2.4 per cent and Latin America the highest at 3.8 per cent. The WACC across all countries is low and there are not significant differences in the WACC mainly because of the assumptions of the traditional models, namely that all markets are fully integrated while ignoring the effects of taxation and country-specific factors.
5.2 WACC (WACC2)
The second calculation method employed to calculate the WACC was based on the same formula as the first, but an additional local market risk premium was added to the cost of equity as shown in Table 3. This cost of equity is denoted by 'KE2' and the results as 'WACC2'in Appendix B.
The second set of results increased substantially across all four regions where the previous average increased from 3.3 per cent to 8.6 per cent on a per-country basis. The average WACC for each of the regions remained closely aligned, with Europe having the lowest average of 5.6 per cent and MEA the highest at 6.9 per cent. These results show that, for developing countries the COC increases substantially across the four regions, yet this increase was still much aligned across all regions with the introduction of a local market risk premium. These results indicate that in determining a local market risk premium for developing countries, most countries are considered as being similar in terms of riskiness.
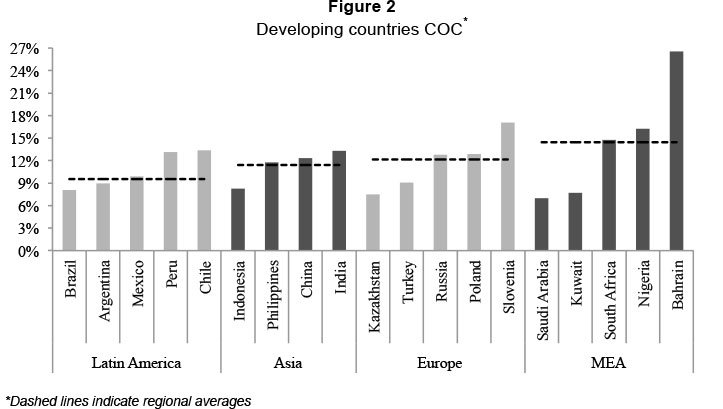
5.3 Villarreal and Córdoba models (WACC and CAPM)
When applied consistently, the WACC and CAPM under the Villarreal and Córdoba (2010) model should yield the same results and it is therefore important to point out that this is the case for the results obtained in this article (denoted by 'WACC' and 'CAPM' in Appendix B), meaning that their principles of intermediation spreads, country risk, taxation, and different betas used were applied correctly in this analysis.
The results obtained from this model show that when more country-specific factors are considered in calculating the COC between developing countries, the COC varies quite considerably even among developing countries. The average WACC varied between 9.5 per cent (Latin America) to 14.5 per cent for MEA. Figure 2 displays the results obtained from the Villarreal & Córdoba (2010) model, where the columns indicate the average WACC for each of the countries selected while the dashed line tracks the averages for each region.
These results show that the COC varies substantially between developing countries when country-specific factors are included in the calculations.
5.4 The driver(s) behind variable WACCs in developing countries
The variability in the results may be explored by ascertaining the driver(s) responsible for the variability in the COC between developing countries. It is clear that, in agreement with Harvey (2004), the country-specific risk factors that were added to the Villarreal and Cordoba (2010) model are involved, but the most pertinent driver(s) remains unidentifiable.
In order to determine possible driver(s) behind the variable WACC across developing countries, a simple linear regression analysis was conducted on much of the data used as inputs to these models as well as on the results obtained. Simple linear regression, instead of multivariate regression was used to test each of the variables that were to be evaluated individually against countries' overall COC. With the objective of the paper being to identify the key drivers behind the sample countries' COC, a simple linear regression was considered most suitable for this. Relevant results are presented in this section.
Country-specific factors clearly lie behind this finding simply because these factors are added to the third calculation method employed in this article. To test this assertion, country risk premia that were described previously and presented in Table 6 were used in a linear regression with the WACC results for each of the countries in the sample set. The results of this regression are illustrated in Figure 3.
From this regression, there is strong evidence to support the view highlighted above that country-specific factors lie behind developing countries' WACC and that the country risk premia contribute significantly to a country's overall WACC since the regression line has a slope of 1.02 and an R2of 0.90.
5. 4 .1 Credit ratings
This strong relationship and the extent to which the WACC differs among developing countries across the four analysed regions seem to imply that country credit ratings may be involved (i.e. specific country 'factors'). However, from a similar regression analysis of sovereign credit ratings and country risk premia (indicated as round markers in Figure 4), it suggests that credit ratings play almost no role in determining the country risk premium. The slope of the regression line and R2values were both found to be ~0. Associated t-statistics and ρ values indicate that these values are indeed insignificant at both 99 per cent and 95 per cent confidence levels.
A further regression analysis was performed on sovereign credit ratings versus their overall WACCs. The results were plotted on the same chart and are indicated by the square markers in Figure 4. The results were similar in that they illustrate that credit ratings do not contribute significantly to sovereign WACC.
Proceeding from previous evidence, these results confirm the result that sovereign WACC does not depend on relevant sovereign credit ratings: the regression line had a slope and an R2 of ~0,with associated ρ values of » 5 per cent.
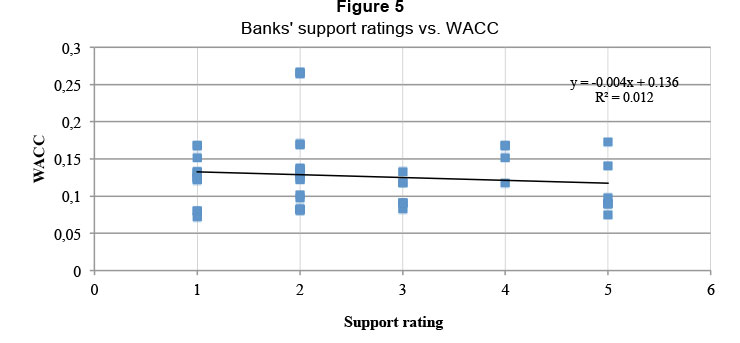
5.4.2 Bank support ratings
Further evidence that a sovereign's risk premium and its WACC are not influenced significantly by sovereign creditworthiness is gleaned from an analysis of bank support ratings. As mentioned earlier, support ratings indicate the likelihood of sovereign support to a distressed bank. Ratings vary from 1 to 5, where a 1 rating represents the highest probability of assistance and 5 the lowest. In comparing these analyses, it is important to note that the support ratings regressions were done on a per-bank basis as opposed to the previous per-country analysis, but the results presented in Figure 4 remain consistent when done on a per-bank basis.
The result of the linear regression on the support ratings of all the banks in the sample set and their WACCs are presented in Figure 5. It was found that, similar to what was found regarding credit ratings, banks' support ratings do not play a significant role in determining their WACCs where the regression returned a small negative slope and R2 = 0.01. Neither of these statistics was significant at the 5 per cent level.
It may thus be concluded that, contrary to expectations, creditworthiness does not play a significant part in the determination of developing countries' country risk premia.
The next parameter that will be considered is the local market risk premium, which is used as a basis for the calculation of the country risk premia used in this article as per Damodaran (2012). These local market risk ratings were obtained from a survey conducted by Fernandez et al. (2011) in which various stakeholders were required to disclose the local market risk premia they used as inputs to their COC models.
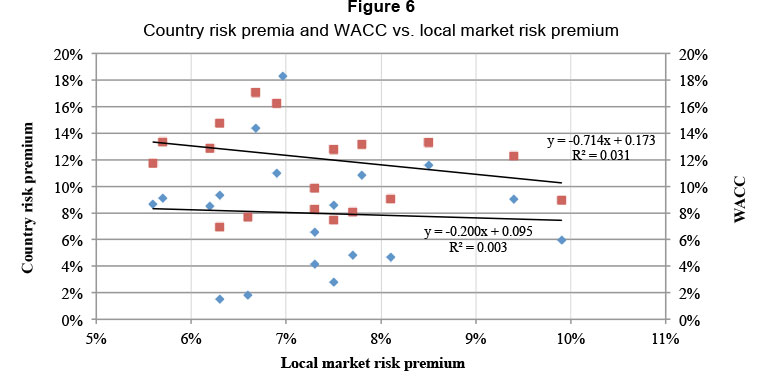
5.4.3 Local market risk premia
Local market risk premia were regressed in terms of country risk premia and WACCs. It was found that these local market risk premia did not have strong relationships with these variables. The results in this regard are shown in Figure 6.
The regression analysis where countries' assumed local market risk premia were compared with their country risk premia is shown by the round markers in Figure 6 and it indicates that there is not a strong relationship between the two variables.
Similar to these results, the regression analysis where countries' local market risk premia were compared with their WACCs shows that these two variables do not share a significant relationship as indicated by the square markers in Figure 6.
Figure 6 shows that, according to the study by Fernandez et al. (2011), the average local market risk premia that are used in practice do not have a positive relationship with the country risk premia of the developing countries used in this sample. This could indicate that the market risk premia that are assumed in practice are based on judgement and perceptions that may not necessarily consider scientific facts and evidence regarding the riskiness of these countries.
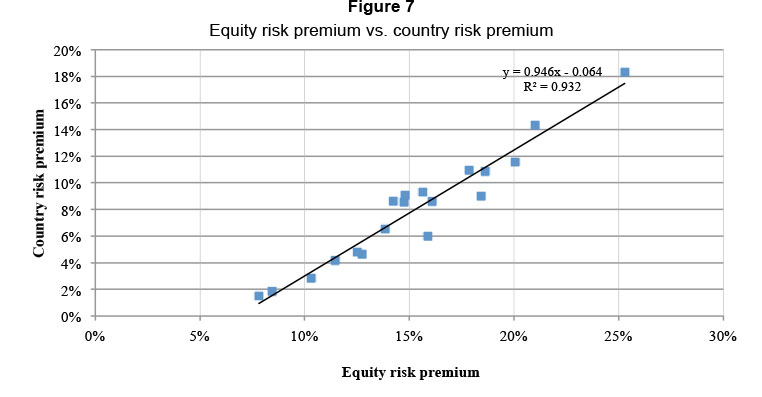
5.4.4 Equity risk premia
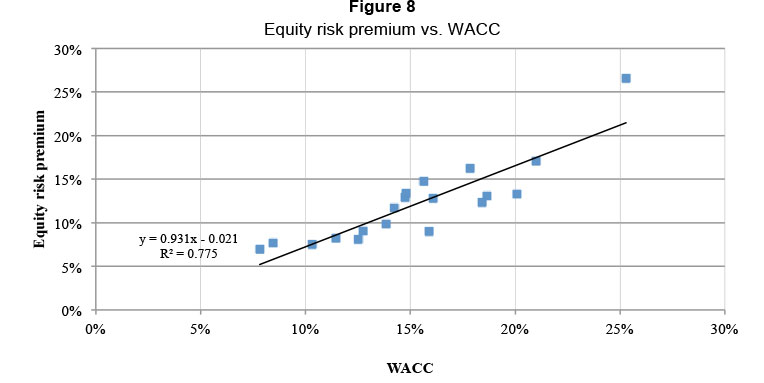
Sovereign total equity risk premia in this article were calculated using the local market risk premium to which a credit risk spread in bps was added. This was subsequently multiplied by an equity-to-bond market volatility spread ratio. A linear regression analysis was accordingly conducted on sovereign equity risk premia and country risk premia versus WACCs. It was found that both countries' country risk premia and their WACCs are largely based on their equity risk premia, which in turn are largely driven by the equity-to-bond market volatility ratios. The results are shown in Figures 7 and 8.
The regression analysis conducted on countries' equity risk premia compared with the country risk premia found that the two variables are nearly unitarily related. The regression analysis also yielded a regression line slope of 0.95 and an R2 = 0.93, meaning that countries' country risk premia are almost solely determined by their equity risk premia.
Following the evidence in Figure 3, where it was shown that countries' WACC is closely related to their country risk premia and that countries' risk premia are closely related to their equity risk premia, the expectation would be that countries' WACC would therefore also be largely determined by its equity risk premia. This was found to be the case as per the data presented by Figure 8.
Following further analysis of the possible drivers behind countries' equity risk premia, a regression analysis was done on their equity-to-bond market volatility spreads, their country risk premia and their equity risk premia respectively. It was found that the two variables are strongly related to the equity-to-bond market volatilities as shown in Figure 9. The results of the regression of the country risk premia and the equity-to-bond market volatilities are shown by the round markers in Figure 9, while the regression of the equity risk premia with the equity-to-bond market volatility spreads are shown by the square markers.
The regression analysis results presented regarding countries' equity risk premia indicate that country risk premia are largely based on countries' equity risk premia, which in turn are seemingly largely driven by equity market volatilities as expressed by the equity-to-bond market volatility ratio spreads.
6 Conclusions
Jacobs and Van Vuuren (2013) showed that the COC between developed countries and developing countries increased incrementally for developing countries as more country-specific factors are considered. This, in turn, indicates that capital requirements might cause unequal competitive conditions, leading to the question of whether such inequalities may also be created between developing countries. This article explored this question and determined whether capital requirements, as a regulatory tool, contributed to unequal competitive conditions among developing economies based on the COC between developing countries.
From the COC analyses' results and findings, this article examined driving factors behind such developing economies' capital cost discrepancies by conducting regression analyses.
From these analyses and results, conclusions can be drawn, which are outlined in this section.
6.1 Variable COC between developing countries
COC calculations conducted in this article indicate that the COC between developing countries differ substantially as more country-specific factors are considered in the calculations. These conclusions are in agreement with those of Jacobs and Van Vuuren (2013) and confirm that not only does the COC differ between developed and developing markets, but it also differs between developing countries.
6.2 Capital requirements as regulatory tool
The results strengthen Jacobs & van Vuuren's (2013) finding that as a regulatory tool, capital requirements cannot achieve a primary regulatory objective i.e. that of providing financial institutions with equal competitive footing. As long as the COC differs between countries, financial institutions in certain countries will enjoy an advantage over others as long as capital requirements regulations are subscribed to. It is important to again point out that although this analysis was based on banking data, it can be reasonably assumed that the findings will apply to financial institutions in general, including insurance companies. This assumption is based on the fact that the regulatory regimes of both the banking and insurance industries are based primarily on capital requirements.
6.3 Country-specific factors largely drive the COC
Since no clear pattern emerged in terms of certain regions having lower costs of capital than others, the results imply that the COC for developing countries is driven principally by country-specific factors that are not related to their geographical locations.
This notion was confirmed by conducting a regression analysis based on the COC results and country risk premia and it was found that country risk premia are the major contributor to higher costs of capital among the developing countries analysed. This also further enforces the increasing COC as more country-specific factors are considered in calculating the COC for countries. This finding coincides with the findings of Harvey (2004).
6.4 Credit ratings as indicator of country risk and transparency
Since country risk premia were found to be the biggest drivers behind countries' COC, countries' credit ratings were considered as a possible contributor to their COC. Credit ratings were found to not play a significant role in determining countries' COC, nor were they found to contribute significantly to countries' country risk premia. Initial expectations that credit ratings would be aligned closer with these two factors proved to be false.
The fact that credit ratings do not appear to play a meaningful role in determining the riskiness of countries or of their COC, leads to the conclusion that credit ratings are perhaps not accurate measures of countries' risks and that not only credit ratings should be considered when analysing the riskiness of a country. In addition, it alludes to the need for credit ratings agencies to be more transparent in disclosing how credit ratings are determined and what factors are taken into account in producing them.
Markets tend to rely heavily on credit ratings for various reasons and objectives. Moreover, credit quality movements, i.e. upgrades and/or downgrades, have major implications for financial markets and institutions across the globe. This introduces two dangers for financial institutions that rely too heavily on ratings: that, due to a lack of transparency in ratings' determination, they firstly do not understand the underlying methodologies in the determination of ratings, and secondly ratings do not necessarily provide an accurate reflection of reality.
6.5 Local market risk premia used globally
A further conclusion that can be deduced from this study is that as with credit ratings, local market risk premia do not provide an accurate reflection of inherent risks of countries. Local market risk premia that are used globally do not relate well to either country risk premia or the COC used in this study, indicating that these local market risk premia are determined inconsistently and that they may be determined intuitively based on perceptions, rather than on a more analytical, and thus objective, basis.
6.6 Market risk vs. credit risk considerations
Equity risk premia were found to be the largest contributor to country risk premia and therefore countries' COC. Again, related to the point made above about credit ratings that do not seem to reflect country risk factors accurately, it was found that equity risk premia are largely based on volatilities observed in countries' equity markets.
Country risk premia were found to be driven largely by countries' equity risk premia and almost not at all by credit risk factors as reflected by countries' credit ratings. Although volatile markets do pose a higher risk and should be considered as one of the determinants of a country's riskiness, these results indicate that there might be a danger in markets placing an over reliance on market risk factors and not enough reliance on credit risk factors. This, in turn, may be as a result of either one or a combination of two factors, namely that credit ratings are seen as unreliable and/or there is a lack of underStanding in their determination; and market risk factors are easier to analyse and quantify because of an abundance of data.
Much has been written about the over reliance on credit ratings and credit rating agencies as they have their own difficulties in assessing the credit risk of some of the more exotic products. It may accordingly be argued that not enough attention was given to credit risk in the first place, and that markets were perhaps too busy analysing market risk while unwisely ignoring the significant threat posed by credit risk.
6.7 Double penalties
A final conclusion to this study relates back to the financial regulatory sphere where there is a clear danger that certain countries are not only being disadvantaged by capital requirements because they will have to pay more for the capital they are required to hold because of their higher costs of capital, but also that some countries will be doubly penalised. As described above, countries with higher costs of capital will pay more for the capital that they hold as a result of their country-specific factors and the volatility of their equity markets in particular.
However, as regulatory capital requirements are increasingly being described as 'risk based' or 'risk sensitive' in the sense that the objective of the amount of capital a financial institution needs to hold should be reflective of the risks that it is exposed to, financial institutions operating in more volatile markets will as a result have to hold more capital.
In other words, certain financial institutions that operate in countries with relatively volatile equity markets might find themselves paying for this risk twice: they will be required to hold more capital for these risks and they will have to pay more for this capital.
This relates back to the previous conclusion discussed in section 6.7 which highlighted a possible over-emphasis on market risk factors. Regulators and policymakers should therefore be made aware of such possible nuances and anomalies that financial regulations might introduce.
References
ANNIN, M. & FALASCHETTI, D. 1998. Equity risk premiums. Valuation strategies, January/February. New York: Thomson Reuters. [ Links ]
BANK FOR INTERNATIONAL SETTLEMENTS, Basel Committee on Banking Supervision (BCBS). 1999. A new capital adequacy framework, Consultative paper issued by the Basel Committee on Banking Supervision. June. Basel: BIS. [ Links ]
BANK FOR INTERNATIONAL SETTLEMENTS, Basel Committee on Banking Supervision (BCBS). 2006. International convergence of capital measurement and capital standards, a revisedframework. July. Basel: BIS. [ Links ]
BIS see BANK FOR INTERNATIONAL SETTLEMENTS. BLOOMBERG, L.P. 2012. Historical equity price and index data for companies used in this article. [ Links ] [Accessed 2012-08-22] from Bloomberg Database.
BREALEY, R.A., MYERS, S.C. & MARCUS, A.J. 2001. Fundamentals of corporate finance (3rd ed.) New York: McGraw-Hill. [ Links ]
BRUNER, R.F., EADES, K.M., HARRIS, R.S. & HIGGINS, R.C. 1998. Best practices in estimating the cost of capital: Survey and synthesis. Journal of Applied Finance (formerly Financial Practice and Education), Spring/Summer. Tampa: Financial Management Association International. Available at: http://www.pageout.net/user/www/j/o/jostokes/BRUNEREst_Cost_of_Capital.pdf [accessed 2012-08-03]. [ Links ]
CEA see COMITÉ EUROPÉEN DES ASSURANCES, European Insurance and Re-insurance Federation. [ Links ]
CEC see COMMISSION OF THE EUROPEAN COMMUNITIES. [ Links ]
COMITÉ EUROPÉEN DES ASSURANCES, European Insurance and Re-insurance Federation (CEA). 2006. Solvency II introductory guide. June. Brussels: CEA. Available at: http://www.cea.eu/uploads/DocumentsLibrary/documents/SolvencyII-IntroductoryGuide.pdf [accessed 2012-06-15]. [ Links ]
COMMISSION OF THE EUROPEAN COMMUNITIES (CEC). 2007. Accompanying document to the proposal for a directive concerning life assurance on the taking up and pursuit of the business of insurance and reinsurance (Solvency II). Staff working document: Executive summary of the impact assessment. Brussels. Available at: http://ec.europa.eu/internal_market/insurance/docs/solvency/impactassess/executive-summary_en.pdf [accessed 2012-06-27]. [ Links ]
DAMODARAN ONLINE see DAMODARAN, A. [ Links ]
DAMODARAN, A. 2012. Damodaran online: The data page. Various data sets used in this article. Available at: http://w4.stern.nyu.edu/~adamodar/New_Home_Page/data.html [accessed 2012-08-09]. [ Links ]
DE CARVALHO, F.J. 2005. Basel II: A critical assessment. Working Paper 6 of Universidade Federal do Paraná, Department of Economics. Curitiba: Department of Economics, Universidade Federal do Paraná. Available at http://www.economiaetecnologia.ufpr.br/textos_discussao/texto_para_discussao_ano_2005texto_02.pdf [accessed 2012-06-24]. [ Links ]
ERB, C.B., HARVEY, C.R. & VISKANTA, T.E. 1996. Expected returns and volatility in 135 countries: projected returns and variances in countries with and without equity markets. February. Durham: Duke University. [ Links ]
ESTRADA, J. 2001. The cost of capital in emerging markets: A downside risk approach (II). March. Barcelona: Instituto de Estudios Superiores de la Empresa (IESE) Business School, University of Navarra. Available at: http://citeseerx.ist.psu.edu/viewdoc/download?doi=10.1.1.203.4883&rep=rep1&type=pdf [accessed 2012-07-31]. [ Links ]
EU see EUROPEAN UNION. [ Links ]
EUROPEAN UNION (EU). 2009. Directive 2009/136/EC of the European parliament and of the Council of 25 November 2009 on the taking up and pursuit of the business of insurance and reinsurance (Solvency II). Official Journal of the European Union. Brussels: Publications Office of the EU. Available at: http://www.lloyds.com/The-Market/Operating-at-Lloyds/Solvency-II/Legislative-developments/~/media/Files/The%20Market/Operating%20at%20Lloyds/Solvency%20II/Solvency%20II%20Directive.pdf [accessed 2012-06-20]. [ Links ]
EXLEY, C.J. & SMITH, A.D. 2006. The cost of capital for financial firms. British Actuarial Journal, 12(1): 229-301. Cambridge: Cambridge Journals. [ Links ]
FAMA, E.F. & FRENCH, K.R. 2004. The capital asset pricing model: Theory and evidence. Journal of Economic Perspectives, 18(3):25-46. Nashville: American Economic Association. [ Links ]
FEDERAL RESERVE BANK OF ST LOUIS ECONOMIC DATA (FRED). 2012. Corporate bonds public data. St Louis: Federal Reserve Bank of St Louis. Available at: http://research.stlouisfed.org/fred2/categories/32348/downloaddata [accessed 2012-08-14]. [ Links ]
FERNANDEZ, P., AGUIRREAMALLOA, J. & CORRES, L. 2011. Market risk premium used in 56 countries in 2011: A survey with 6,014 answers. Working Paper WP-920. Barcelona: Instituto de Estudios Superiores de la Empresa (IESE) Business School, University of Navarra. [ Links ]
FITCH see FITCH RATINGS. [ Links ]
FITCH RATINGS (FITCH). 2012. Company and country ratings for companies and countries used in this article. [ Links ] [Accessed 2012-07-16] from Fitch Database.
FRED see FEDERAL RESERVE BANK OF ST LOUIS ECONOMIC DATA. [ Links ]
FRENCH, C.W. 2003. The Treynor capital asset pricing model. Journal of Investment Management, 1(2): 60-72. California. [ Links ]
GODFREY, S. & ESPINOSA, R. 1996. A practical approach to calculating costs of equity for investments in emerging markets. Journal of Applied Corporate Finance, 9(3):80-90. New York: Wiley. [ Links ]
HAIL, L. & LEUZ, C. 2003. International differences in the cost of equity capital: Do legal institutions and securities regulation matter? Philadelphia: Wharton Financial Institutions Centre. [ Links ]
HAIL, L. & LEUZ, C. 2008. Cost of capital effects and changes in growth expectations around US Cross-listings. Philadelphia: Wharton Financial Institutions Centre. [ Links ]
HARVEY, C.R. 2004. Country risk components, the cost of capital, and returns in emerging markets. November. Durham: Duke University. [ Links ]
HARVEY, C.R. 2005. 12 Ways to calculate the international cost of capital. Durham: Duke University. [ Links ]
HORCHER, K. 2005. Essentials of financial risk management. New York: Wiley. [ Links ]
JACOBS, J. & VAN VUUREN, G. 2013. Is regulatory capital a legitimate, comparable and objective global standard? Evidence from 51 institutions across 17 countries. Article forthcoming in the South African Journal of Economic and Management Sciences. Pretoria, South Africa. [ Links ]
JENKINSON, T. 2006. Regulation and the cost of capital. International handbook on economic regulation. Cheltenham: Edward Elgar. Available at: http://xfi.exeter.ac.uk/conferences/costofcapital/papers/jenkinson_regulation_and_the_cost_of_capital.pdf [accessed 2012-07-10]. [ Links ]
KOCH, T.W. & MACDONALD, S.S. 2006. Management of banking (6th ed.) Mason: Thomson SouthWestern. [ Links ]
KOEDIJK, K.G., KOOL, C.J.M., SCHOTMAN, P.C. & VAN DIJK, M.A. 2002. The cost of capital in international financial markets: Local or global? Journal of International Money and Finance, 21(6):905-929. Elsevier. [ Links ]
LALLY, M. 2004. The cost of capital for regulated entities - Report preparedfor the Queensland competition authority. 26 February. Wellington: School of Economics and Finance, Victoria University of Wellington. Available at: http://www.qca.org.au/files/LallyReport_CostofCapital.pdf [accessed 2012-08-03]. [ Links ]
LAMBERT, R. LEUZ, C. & VERRECHIA, R.E. 2006. Accounting information, disclosure, and the cost of capital. August. Philadelphia: Wharton Financial Institutions Centre. [ Links ]
LAMBERT, R. & VERRECHIA, R.E. 2010. Cost of capital in imperfect competition settings. January. Philadelphia: Wharton Financial Institutions Centre. [ Links ]
LIND, G. 2005. Basel II: The new framework for bank capital. RijksbankEconomic Review, 2005-02, 22 June. Stockholm: Sveriges Riksbank. [ Links ]
LINTNER, J. 1965. The valuation of risk assets and the selection of risky investments in stock portfolios and capital budgets. The Review of Economics and Statistics, 47(1):13-37. February. Cambridge: MIT Press. [ Links ]
LLOYD'S. 2010. Solvency II: An overview. July. London: Lloyd's. Available at: http://www.lloyds.com/~/media/Files/The%20Market/Operating%20at%20Lloyds/Solvency%20II/Solvency%20II% 20Introduction %20July%202010.pdf [accessed 2012-06-25]. [ Links ]
MARKOWITZ, H. 1952. The utility of wealth. The Journal ofPolitical Economy, 60(2):151-158. Chicago: University of Chicago Press. [ Links ]
MARKOWITZ, H. 1959. Portfolio selection: Efficient diversification of investments. February.New York: Wiley. [ Links ]
McCAULEY, R.N. & ZIMMER, S.A. 1989. Explaining international differences in the cost of capital. Federal Reserve Bank of New York Quarterly Review, 14(2):7-28. New York: Federal Reserve Bank of New York. [ Links ]
McMORRAN, J. 2010. Cost of capital - Trends, tools and applications. Los Angeles: Postlethwait and Netterville. Available at: http://www.pncpa.com/admin/files/resources/Cost_of_Capital_2010.pdf [accessed 2012-07-17]. [ Links ]
MODIGLIANI, F. & MILLER, M.H. 1958. The cost of capital, corporation finance and the theory of investment. The American Economic Review, 48(3):261-297. Pittsburgh: American Economic Association. [ Links ] MOSSIN, J. 1966. Equilibrium in a capital market asset. Econometrica, 34(4):768-783. New York: Wiley. [ Links ] NEKRASOV, A. 2012. Cost of equity and risk in cash flow and accrual components of earnings. July. Irvine: University of California. Available at: http://papers.ssrn.com/sol3/Delivery.cfm/SSRN_ID2103749code646213.pdf?abstractid=1496566&mirid=3 [accessed 2012-07-21]. [ Links ]
ROSS, S.A., WESTERFIELD, R.W. & JAFFE, J. 2003. Fundamentals of corporate finance (6th alt ed.) New York: McGraw-Hill. [ Links ]
ROY, A.D. 1952. Safety first and the holding of assets. Econometrica, 20(3):431-449. New York: Wiley. [ Links ]
SANCHEZ, J.G., PREVE, L. & ALLENDE, V.S. 2010. Asymmetry and the cost of capital. December. Buenos Aires: IAE Business School, Universidad Austral. Available at: http://www.iae.edu.ar/pi/Documentos%20Investigacin/Research%20Seminars/Asymmetry%20and%20the%20cost% 20of%20 capitalJGS-LP-VS.pdf [accessed 2012-07-23]. [ Links ]
SANDSTRÕM, A. 2007. EU Solvency II - A non-life perspective. Presentation given at CAS spring meeting. 19 June. Orlando. Available at: http://www.slideworld.org/viewslides.aspx/EU-Solvency-II-%E2%80%93-a-non-life-perspective-ppt-2546760 [accessed 2012-06-30]. [ Links ]
SERCU, P. 2008. International finance: Putting theory into practice. July. Leuven: Leuven School of Business and Economics, Katholieke Universiteit Leuven. [ Links ]
SFRC see SHADOW FINANCIAL REGULATORY COMMITTEES. [ Links ]
SHADOW FINANCIAL REGULATORY COMMITTEES. 1999. Improving the Basle committee's new capital adequacy framework. Joint statement by the Shadow Financial Regulatory Committees of Europe, Japan and the US. 14 June. New York. Available at: http://www.econ.keio.ac.Jp/staff/masaya//shadow/article/jointstate_1.doc [accessed 2012-06-21]. [ Links ]
SHARPE, W.F. 1964. Capital asset prices: A theory of market equilibrium under conditions of risk. The Journal of Finance, 19(3):425-442. New York: Wiley. [ Links ]
SHOVEN, J.B. & TOPPER, M. 1992. The cost of capital in Canada, the United States, and Japan. Canada-US Tax Comparisons, pp. 217-235. January. Chicago: University of Chicago Press. Available at: http://www.nber.org/chapters/c7483.pdf [accessed 2012-07-12]. [ Links ]
VAN DUFFEL, S. 2008. Solvency II: A critical view with a focus on risk aggregation. Lecture given on Risk Aggregation at the Banking, Finance and Insurance Commission. 18 September. Brussels. Available at: http://www.x-act-consulting.com/files/cbfa-september-2008.pdf [accessed 2012-06-10]. [ Links ]
VILLARREAL, J. & CÓRDOBA, M.J. 2010. A consistent methodology for the calculation of the cost of capital in emerging markets. July. Bogota: Universidad de los Andes. Available at: http://papers.ssrn.com/sol3/papers.cfm?abstract_id=1663845 [accessed 2012-08-02]. [ Links ]
Accepted: July 2014
1 In some cases banks not representing the three largest balance sheets in a specific country were selected based on data availability. In this regard, according to banks' size, for Indonesia numbers 1, 4 and 8 were used; for Russia 1, 2 and 6; for Turkey 1, 2 and 4; for Chile 1 and 4; for Mexico numbers 1, 3 and 4; for Peru 2 and 5; and for Bahrain 3, 5 and 6 were used.
Appendix A

