


Servicios Personalizados
Articulo
 Inglés (pdf)
 Articulo en XML
 Referencias del artículo
Indicadores

Links relacionados
-
 Citado por Google
 -
 Similares en Google
Compartir

 Permalink
South African Journal of Economic and Management Sciences
versión On-line ISSN 2222-3436
versión impresa ISSN 1015-8812
S. Afr. j. econ. manag. sci. vol.18 no.1 Pretoria 2015
http://dx.doi.org/10.17159/2222-3436/2015/v18n1a6
ARTICLES
Cost-effective infrastructure choices in education: Location, build or repair
Glenn P Jenkins; Armin Zeinali
Department of Economics, Queen's University, Canada and Eastern Mediterranean University, TRNC, Mersin 10, Turkey
ABSTRACT
The purpose of this study is to develop a model to arrive at a joint optimising strategy for capital budgeting for the construction of new school buildings and for the renovation of existing schools. This model provides a practical tool for ranking construction projects so as to yield the maximum positive impact on the education system. A key aspect of the model is that it provides the optimal mix of renovation and new construction that should be undertaken under a fixed budget constraint. The model is applied to a sample dataset from the education sector of Limpopo province, South Africa, in order to quantify the benefits of using the model. The benefits from using this model for decision making on the evaluation of new and renovation investments in school infrastructure is estimated to increase the effectiveness of these investments by up to 300 percent over the counterfactual system for making these decisions.
Key words: education, cost-effectiveness, school location, school construction, school repair, South Africa
1 Introduction
One of the main problems for the education sectors in many developing countries is the lack of school buildings and other infrastructure. The number of classrooms is generally inadequate for the large population of students, and often the classrooms are in very poor condition. Over time, without renovation, many will become unusable. The lack of school buildings can result in the use of double shifts, or very large class sizes. In 1998, primary and secondary schools in Vietnam had on average 1.9 and 1.7 shifts respectively, resulting in average school days of about 3 hours for primary schools and 3.5 hours for secondaryschools (Glewwe, 2004). In 2004, the Departmentof Education in Limpopo province, South Africa, reported a shortage of about 13 000 classrooms (Jenkins & Klevchuk, 2004). In 2007, although the primary education enrolment in Uganda reached a level of 7.5 million compared to an initial level of 3.1 million in 2003, the Ugandan education sector was still suffering from a shortage of classrooms and proper investments in infrastructure (Ssewamala et al., 2011). In many developing countries the shortage of school infrastructure has become progressively worse with an increasing political commitment for public provision of primary and secondary education and at the same time rapidly growing populations.
In order to alleviate such problems, some developing countries such as South Africa are investing heavily in school construction and maintenance. As the amount of funding available for such public sector investments and the capacity to erect such structures is often limited, it is important to have a system and criteria by which budgets can be allocated efficiently.
The first objective of this paper is to develop a model for measuring the cost effectiveness of expenditures on both new school classrooms and classroom repair by school district in the Limpopo province, South Africa. The data used for building such a model and the estimations of the incremental cost-effectiveness ratios were obtained from the administrative records of the government departments of the province. The second objective is to measure the potential gains (measured by the relative change in and index of effectiveness) that might be obtained if an incremental cost-effectiveness criterion was used to select the location of additional investment expenditures in building new school buildings and to repair the existing stock of school classrooms. When advocating better quantitative analysis to assist decision making, one is often faced with the question of whether the potential gains are significant enough to warrant the additional effort. This analysis is done using data on the school infrastructure of Limpopo province.
2 Methods
2.1 Cost-effectiveness analysis
Cost-effectiveness analysis is generally used as an alternative to cost-benefit analysis. In particular, cost-effectiveness analysis is very useful when the analyst is reluctant to measure the effects of a project in monetary terms or when such measurement is not possible.
The first step in a cost-effectiveness analysis is to find a measure for the effectiveness of alternative projects. In most studies, this measure is either self-evident or defined in the literature. For instance, to compare the cost-effectiveness of HIV-prevention projects, the measure of effectiveness is the number of HIV infections averted by each project. However, there is no self-evident measure to show the effectiveness of investments in educational infrastructure, and such a measure has not been defined in the literature (Levin, 2001). Therefore, the first goal of this study is to define a method to estimate the effectiveness of investment projects in educational infrastructure.
The infrastructure investment options in this study are either to build new classroom blocks or to renovate existing classrooms that are in desperate need of repair. Repairing a classroom that would be unusable in a few years would have a similar effect to building a new classroom in a few years.1 The only difference would be in the number of years that the classrooms will be usable. Therefore, finding a numerical measure for the effectiveness of adding class space is sufficient for the cost-effectiveness analysis of both construction and renovation projects.
The effect of class size on the quality of education has been examined by many researchers, and widely discussed in the literature (Glewwe, 2002; Glewwe & Kremer, 2006). Through a meta-analysis of 80 studies, Glass and Smith (1979) showed that a clear and strong negative relationship exists between class size and educational achievement. This relationship is stronger where the average number of learners per classroom is higher.
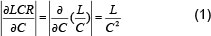
Adding class space to a school district lowers the learner-to-classroom ratio (LCR) and enhances the learning of all learners in the school district.2 In this study, the change in LCR in terms of an increase in the number of available classrooms is used to derive a numerical measure of effectiveness. The changes in LCR associated with adding a classroom to a school district can be estimated as the derivative of LCR with respect to the number of available classrooms. Equation (1) displays this calculation, with L denoting the number of learners and C the number of available classrooms.
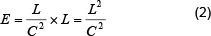
To estimate the effects of adding a classroom on the enhancement of learning for all students in the school district, equation (1) should be multiplied by the number of learners in the school district. The total effectiveness, denoted as E, is calculated as shown by equation (2).3
This measure of effectiveness estimates the education quality enhancement (EQE) achieved by the additional class space. Therefore, EQE is considered as the measuring unit of effectiveness in this study. An assumption is made that one unit reduction of LCR creates the same number of additional EQE units regardless of the size of LCR where LCR is greater than the standard number of learners in a classroom, and creates no EQE units where the LCR is lower than the standard.4 The application of the above method for measuring the effectiveness of increasing the number of available classrooms is illustrated in three possible scenarios: 1) construction scenario, 2) renovation scenario, and 3) construction-and-renovation scenario. In these scenarios, the costs of infrastructure investments are examined from the perspective of the Department of Education. This perspective is adopted because in the case of Limpopo, there is no information available about any costs other than the cost of construction and renovation of school buildings.
2.2 Construction scenario
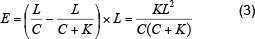
This scenario demonstrates a method of determining an efficient budget allocation strategy dedicated to the construction of new classrooms. Typically, classrooms are built in classroom blocks, each consisting of a few classrooms. In this scenario, effectiveness is measured by the number of EQE units derived from adding a classroom block. Assuming each block contains K classrooms, the changes in LCR associated with increasing by K classrooms, multiplied by the number of learners, will produce the EQE units obtained from building a classroom block in a school district. This calculation is shown by equation (3).
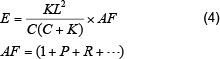
Productivity of infrastructure investments, however, depends on a number of other factors, such as location and type of school (e.g. primary, secondary). To account for such differences among school districts, adjustments are needed for the effectiveness derived from equation (3). In many countries, the economic rate of return is believed to be higher for primary than for secondary level education. The difference in economic return can be incorporated into the model by increasing the number of EQE units obtained from infrastructure investments in primary schools by P percent.5 The factor P is set equal to the proportional additional return obtained from investing in primary schools rather than in secondary schools.6
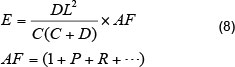
In addition, in many countries investments in education are believed to have a different rate of return in rural areas than in urban areas, and therefore the effectiveness obtained from adding classrooms in rural areas is greater. This differential can be expressed by a factor R for the rural areas, against a base value of zero for urban areas. For example, if it is believed that the rate of return of a typical school investment (all other variables in the model being the same) is 20 per cent higher in rural than urban areas, R is set to 0.2. Such factors, as well as any further required adjustments, are included in an adjustment factor (AF) for estimating the effectiveness of infrastructure investments. This factor should be set for each school district in the analysis. Using AF in equation (4), the effectiveness obtained from infrastructure investments has the same value in terms of EQE units in all school districts, regardless of their location or education level.
Furthermore, in order to consider the full impact of building a classroom block on the enhancement of educational achievement, the effectiveness derived from equation (4) should be calculated over the entire lifetime of the block. The effectiveness may change from year to year owing to changes in the number of available classrooms and the number of learners in the school district. The number of available classrooms in the future depends on the number of classrooms currently available and their condition. The condition of a classroom determines the number of years it is expected to be usable. The number of future EQE units created by the addition of a classroom block may also be affected by the growth in the number of potential students in the district.
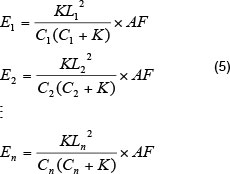
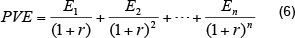
Equation (5) demonstrates the effectiveness of building a classroom block associated with Year 1 to Year n. To account for the value of time, the future stream of EQE units must be discounted back to the present time. However, the question of what is the appropriate discount rate to use is often raised. In this study, the discount rate is the economic opportunity cost of funds, as originally proposed by Harberger (1971) and Sandmo and Dreze (1971). A study by Burgess (2013) compared the economic opportunity cost of funds with the social rate of time preference and the marginal cost of funds to be used as a discount rate. Burgess (2013) showed that under a wide range of circumstances the economic opportunity cost of funds is the most appropriate discount rate. The calculation of the present value of the future stream of effectiveness, or PVE, is shown by equation (6) where r stands for the discount rate and n stands for the number of years to be considered in the analysis.7
The incremental cost-effectiveness ratio (ICER) is calculated for each school district by dividing the given cost of construction of a new classroom block by the PVE of building a new classroom block in the district8. This ratio compares the incremental cost and effectiveness of building a new classroom block with a scenario in which there is no infrastructure project. Both cost and effectiveness are zero for the scenario with no infrastructure project.
The school district with the lowest ICER is chosen as the best place to receive the first investment, since EQE units are gained at the lowest price. In order to find the next place in which a classroom block should be built, the ICER must first be updated for the chosen school district. The PVE is recalculated for that school district, taking into consideration that the school district will have K more available classrooms from the next year. After updating the ICERs, the school district with the lowest ICER among all school districts is selected to be the second location for the building of a new classroom block. The selection is continued in this way until the cumulative cost in a given year of construction becomes equal to the available budget. The final list of selected schools illustrates the most efficient strategy for the location of construction investments.9
2.3 Renovation scenario
In this scenario the problem is how to determine which schools should be renovated in order to achieve the greatest enhancement of the education system. For this analysis it is assumed that the number of classrooms in need of repair, their renovation cost, and the number of years they are expected to be useful are known for each school.
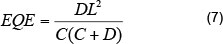
In order to find the effectiveness of the renovation of an old school, the same method is used as in the construction scenario. However, for renovation, the number of classrooms needing repair differs between schools. For a school that has D classrooms in desperate need of repair, the effectiveness of renovation is calculated according to changes in LCR of the school district with respect to the addition of D classrooms. Equation (7), which is derived from equation (4) by substituting D for K, shows the number of EQE units obtained from repairing the school.
In the same manner as before, the measure of effectiveness should be adjusted for the differences in the economic return on investment in rural and urban areas, as well as in primary and secondary education.
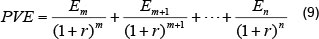
The renovation of a school will increase the number of classrooms starting from the time that the old classrooms are expected to be unusable, and the effectiveness of the renovation should be considered from that point in time. For instance, if the classrooms will become unusable in m years, the effectiveness should be calculated for each year starting from Year m to Year n.10 In a similar way to the previous scenario, the PVE is calculated from the sum of the present value of the future stream of effectiveness created by the renovation of the school. This calculation is shown by equation (9).
In the same manner as in the previous section, the ICER is estimated by dividing the renovation cost of the school by the PVE of the renovation of school. Based on their ICERs, the schools are ranked, and the one with the lowest ICER is chosen as the first school to be renovated. The PVE is then updated for the school district in which the chosen school is located. The renovation of the chosen school will increase the number of available classrooms in the school district from the time that the old classrooms are expected to be unusable. The renovation of the school will lower the LCR of the school district in the future; therefore, the PVE and the ICER of the renovation of the other schools in that school district should be updated. The chosen school is removed from the list of possible renovation projects. Based on the new ratios, the school with the lowest ICER in the list is chosen as the second one to be renovated. This selection procedure continues until the cumulative cost of renovation of the chosen schools becomes equal to the available budget. The final list of chosen schools illustrates the most efficient strategy for the location of renovation projects.
2.4 Construction-and-renovation scenario
In this scenario, the allocation of budget for both construction and renovation projects is carried out jointly. In other words, construction of new classroom blocks and renovation of old schools are ranked in the same list. It is important to note that the effectiveness of building a new classroom block depends on the future condition of the old classrooms in the district. For example, suppose that two school districts have same number of learners and classrooms, but one district has some classrooms that are in desperate need of repair, while the other one does not. The PVE of building a new classroom block would be greater for the school district that has the classrooms in desperate need of repair. This difference in the PVE comes from the number of available classrooms in the future, which is lower in the school district with old classrooms.
In order to develop a scenario without construction and renovation projects, the future condition of the old schools and the number of learners and available classrooms in the future should be estimated for each school district. As in the previous scenarios, the PVE of the construction of new classroom blocks and the renovation of old schools is calculated for each school district. The ICERs are estimated using the given costs and the PVE of each of the infrastructure investments. The infrastructure investment (construction or renovation) with the lowest ICER is chosen as the first investment in the prioritised list of infrastructure projects.
The PVE is then updated for the infrastructure investments in the school district in which the chosen investment is located. Based on the updated PVE, the ICERs are recalculated for the renovation of old schools and construction of a new classroom block in the school district. All possible infrastructure investments are ranked again based on their ICERs. The investment with the lowest ratio is chosen as the second place in the prioritised list of infrastructure projects. In the same fashion, the selection and recalculation of the ICERs are carried out until the cumulative cost of construction and renovation projects becomes equal to the available budget. The prioritised list of infrastructure projects displays the most efficient strategy for allocating the available funds among the construction and renovation projects in the different school districts.
3 Application to province of Limpopo, South Africa
The Department of Education in Limpopo is characterised by shortages of classrooms and related infrastructure. In 2004, the estimated number of classroom needed according the Department of Education's criterion was about 13 000 in Limpopo. Since 1995, substantial funds have been allocated to infrastructure investments in education. However, owing to political pressures that have been enhanced by the absence of any formal project evaluation, a large proportion of those investments has been spent in school districts that were not in the greatest need of additional school buildings (Jenkins & Klevchuk, 2004).
3.1 Data and assumptions
The data used were collected by the Department of Education via regional education boards located in Limpopo, and reflect the situation of 4 942 schools in Limpopo in 2004. In this dataset, each school represents a school district.11 A sample of 494 schools is used to perform the prioritisation analysis. Among the data available for each school, the following parameters have been selected for use in the analysis:
- Emis number: A unique nine-digit number assigned to each school.
- Lowest grade: The lowest grade taught in the school.
- Highest grade: The highest grade taught in the school.
- Enrolment: Number of students enrolled in the school.
- Perm classrooms: Number of permanent classrooms in the school.
- Prefabs: Number of prefabricated classrooms in the school.
- Classroom condition: A number from zero to six reflecting the condition of the classrooms, where zero and six show the worst and the best conditions respectively.
The lowest and highest grades determine whether the school is primary or secondary. Grades lower than or equal to seven are considered primary, and those higher than seven are considered secondary. The total number of classrooms in a school is obtained by adding together the permanent and pre-fabricated classrooms of the school. As reported by Jenkins and Klevchuk (2004), the standard LCR of the schools in Limpopo is 40.
For the renovation budget allocation analysis, however, more information is required. While the condition of the school is known, the number of classrooms requiring repair within the schools is not known, nor is the cost of repairing each of the old classrooms present in the dataset received from the Department of Education.12 To prepare proper estimates for such information, some assumptions are made based on discussion with the representative of the African Development Bank, economists, engineers and people from the Department of Public Works involved in the construction project. These assumptions are as follows:
- Schools with a classroom condition lower than or equal to two are in desperate need of renovation and will be unusable in the future without renovation.
- Schools with a classroom condition higher than two are expected to be usable for the next 20 years.
- Schools with a classroom condition equal to zero or one are expected to lose 75 per cent and 50 per cent of their classrooms in one year, respectively.
- Schools with a classroom condition equalto two are expected to lose 50 per cent of their classrooms in four years.
The renovation costs of the classrooms are assumed to be normally distributed, with the same standard deviation but a different mean associated with the classroom condition. The standard deviation is set at 0.07.13 For schools with a classroom condition of zero, the average renovation cost of a classroom is assumed to be equal to the cost of construction of a new classroom. Since classrooms are going to be added by units of one classroom block including four classrooms, the cost of building a new classroom is considered to be one quarter of the cost of building a classroom block. The cost of building a new classroomblock was R420 000 in 2004. Therefore, thecost of building a classroom is set at R105 000.14 The average renovation cost of a classroom is assumed to be 75 per cent and 50 per cent of the cost of constructing a new classroom for schools with a classroom condition of one and two, respectively.
A study by Psacharopoulos and Patrinos (2004) estimated the economic returns of investments in education for several countries. The economic returns on investment for primary and secondary schools in South Africa were estimated at 22.1 per cent and 17.7 per cent respectively. Based on these rates of return, the economic return on investments is 25 per cent higher in primary schools than in secondary schools, and the parameter P in the adjustment factor will therefore be 25 per cent.15
3.2 Construction scenario
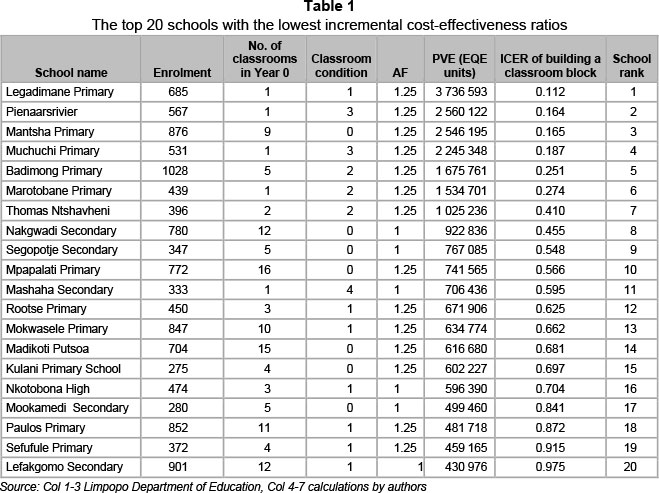
In this scenario, the objective of the analysis is to determine the best locations to build the new classroom blocks in Limpopo. It is assumed that the available budget for this project is about R250 million. Since the analysis is carried out on a 10 per cent sample, the budget available for the analysis is R25 million. The first step in the analysis is to calculate the effectiveness of building a new classroom block. It is assumed that it takes one year for a new block to become ready for use, and that it will be usable for about 20 years.16 As shown in section 2.2, the construction investments are ranked based on the ICER of building a new block in each school in Limpopo. The ranking for the top 20 schools is shown in Table 1.
It is important to note that this ranking does not show the best strategy for budget allocation. Only the first school can be chosen with certainty as the best place to receive funding. To determine the next place, it is necessary to recalculate the ICER of the chosen school, assuming that the school will have four more classrooms from Year 1. Legadimane Primary School, with the lowest ICER, estimated at 0.112, will be chosen as the first place for construction of a new classroom block. With four more classrooms, the incremental cost-effectiveness of building a classroom block in Legadimane Primary School would be 1.012, which would be ranked 23rd.
Based on the updated ICER, the school with the lowest ratio will be selected as second place in the prioritised list of construction projects. The selection procedure continues until the cumulative cost of construction becomes equal to the available budget. The prioritised list of construction investments determines the most efficient sequence for schools to receive funding in order to realise the greatest improvements in the education system. Table 2 illustrates the top 20 construction projects on this list.
As shown in Table 2, Badimong Primary School and Mantsha Primary School are both chosen twice. This implies that if the available budget is limited to the construction cost of 20 classroom blocks, the most efficient strategy is to build two blocks at Badimong Primary School, two at Mantsha Primary School, and one at each of the other 16 schools listed.
3.3 Renovation scenario
In this scenario, the objective is to select those renovation projects that result in the greatest improvement in the education system, assuming that an amount of R25 million is dedicated to renovation projects. The first step is to determine the situation of schools without any infrastructure investments in the next 20 years. Since the number of learners is assumed to be constant, the main factor in the analysis would be the number of usable classrooms in each year. Schools that are considered in this analysis are those that have a classroom condition lower than or equal to two.
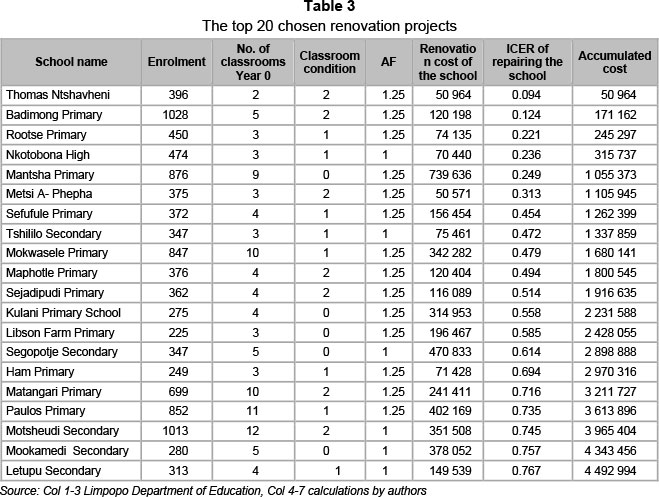
The average cost of renovation of a classroom with a condition of two is R52 500, which is 50 per cent of the cost of building a new classroom. As previously mentioned, the renovation costs of classrooms are assumed to follow a normal distribution around the average cost, with a standard deviation of 0.07. In the same manner as described in section 2.2, the renovations for the schools are ranked according to their ICER from low to high. The most efficient budget allocation for renovation is to choose the schools from this list until the accumulated cost becomes equal to the available budget.17 The list of the top 20 renovation investments is shown in Table 3.
3.4 Construction-and-renovation scenario
In this section, the construction and renovation projects are ranked simultaneously in order to find the most efficient strategy for spending the R25 million dedicated to building and repairing the schools. The potential investment options are renovating schools that are in desperate need of repair and building a new classroom block for every school in Limpopo. In this scenario, the first step is to determine the most efficient investment for the schools that are in desperate need of repair. In other words, it is necessary to determine whether building a new classroom block or repairing the school has a lower ICER.
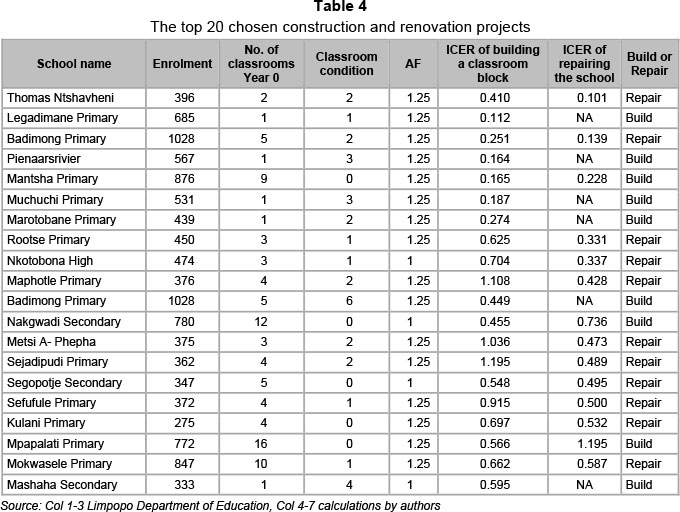
In the same manner as shown in section 2.2.3, the ICERs are estimated for the renovation and construction projects of all schools in the analysis. Schools are ranked based on their ICER. Schools in desperate need of repair that have a ratio for renovation and a ratio for construction are ranked based on the lower of the two ratios, which represents the most efficient investment for the school. Among all schools in Limpopo, Thomas Ntshavheni Primary School has the lowest ICER, which is 0.101 for the renovation of the school. This school is selected as the first place to receive the funds.
To find the next place for the allocation of funds, the ranking list should be updated, assuming that Thomas Ntshavheni Primary School is no longer in need of renovation. This assumption means that Thomas Ntshavheni Primary School can use its classrooms for the entire period of the analysis. Based on this assumption, the PVE of building a new classroom block at Thomas Ntshavheni Primary School falls from 1 025 236 to 520 324 EQE units. Consequently, the ICER for this school rises from 0.410 to 0.807. Table 4 shows the list of top 20 infrastructure investments in this scenario. Note that the ICER of renovation is not applicable (NA) for schools with no classrooms in desperate need of repair.18
4 Potential impact of the model
To illustrate the advantages of using the suggested model, a comparison is made between the results in terms of the present value of the units of effectiveness produced by a given budget allocation using the model, and a budget allocation that does not use such an analysis or criterion.
When describing a budget allocation without any analysis, it is assumed that the budget is randomly allocated to the schools where the LCRs of the schools are higher than the standard ratio, which is 40 in Limpopo. Therefore, during this random selection, whenever the LCR of a school falls below 40, that school is erased from the list of possible investments.
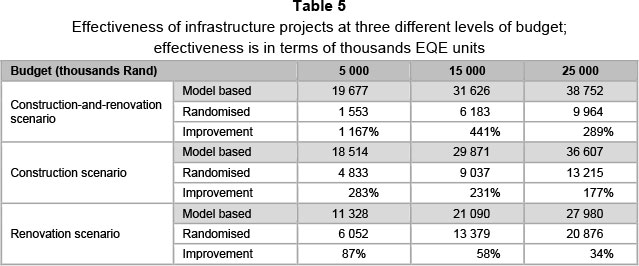
A random selection may not necessarily reflect the current system for budget allocation. However, in the past schools were often built in locations close to other villages where new schools had recently been built. Although these schools could be used by more than one village, because of the need for local politicians to be seen to be delivering at least as good a set of educational services as their competing politicians were delivering nearby, the system for school selection is yielding a pattern of resource allocation that is likely to be worse than a random selection rule (Jenkins & Klevchuk, 2004). In practice, funding might be given to school districts with an LCR lower than 40, which is worse than the random selection rule used here. In this paper, randomised budget allocation provides a base case for the situation of not using an analysis, in order to quantitatively estimate the advantages of using the suggested system for ranking areas for construction and repair of schools in a real-world situation. The randomised budget allocation iscarried out for an amount of R25 million for the three scenarios similar to those described in the previous sections. The results of the randomised budget allocation are displayed and compared with the model-based budget allocation in Table 5 and Figures1 to 3.
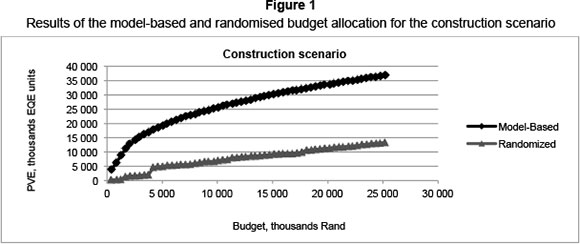
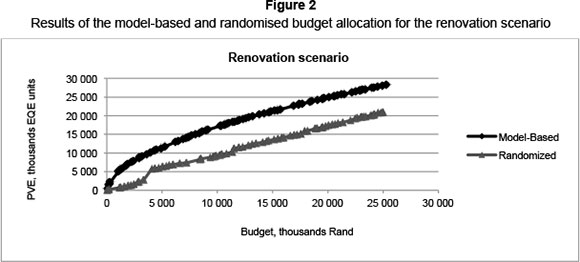
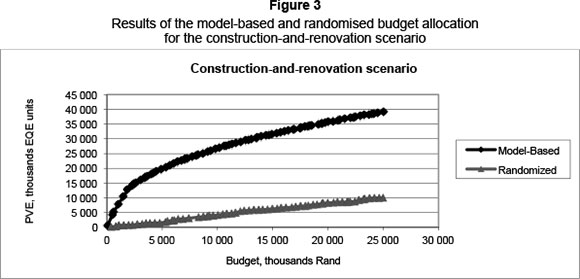
As shown in Table 5, for the construction, renovation, and construction-and-renovation scenarios the EQE units obtained from the model-based scenarios are about 177 per cent. 34 per cent, and 289 per cent greater, respectively, than those for the randomised budget allocation for a budget of R25 million. The improvement obtained by using the model is even greater when the budget is smaller.
Among the three scenarios, the improvement in the renovation scenario is not as great as in the other two scenarios. However, this does not imply that the model is less effective for renovation projects. The reason for this difference is that the R25 million that is assumed as the available budget in all three scenarios is a relatively large sum for the renovation scenario given the total number of repairs needed. In fact, the cost of repairing all schools in Limpopo is about R50 million, and if the available budget was R50 million, there would be no difference between a model-based and a randomised budget allocation. Alternatively, for the construction scenario, with R50 million it would be possible to build only a proportion of the classroom blocks required.
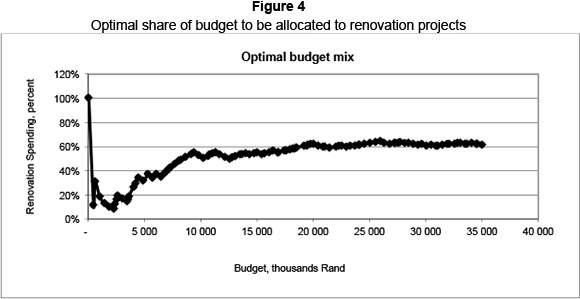
A question that is often raised by decision makers for infrastructure investments in education is how to optimally balance budget expenditures between construction and renovation projects. The results of the model-based budget allocation show that the greatest enhancement in the education system is achievable by using the model in the construction-and-renovation scenario. Allocating separate budgets for construction and renovation does not generally lead to the greatest enhancement in the education system.
The results of the model-based construction-and-renovation scenario suggest that about 62 per cent of the R25 million budget should be spent on renovation projects to obtain the greatest enhancement in the education system. Figure 4 illustrates the optimal budget mix between construction and renovation projects when allocating a budget of up to R35 million. It is important to note that these results for the optimal budget mix are heavily dependent on the assumptions for the situation and renovation costs of old schools. The optimal budget mix may be very different for an education system with different situation and renovation costs.
5 Conclusion
Around the world decisions concerning the location of school buildings have been the focus of much political lobbying and controversy. As a result, many of the locational decisions for school buildings have produced an inefficient allocation of investments for this sector. While the criteria used in this study to rank investment opportunities may not be perfect, it represents a major improvement over the current practice in many countries. The information used to carry out the analysis for Limpopo province was information routinely gathered by the government as part of its asset management system, and did not require the development of a special survey or a sophisti-cated education information system. Hence, it has the potential to be relatively easily replicated across other provinces in South Africa, and perhaps other counties. The model is operational and its use would have a major impact over time on the educational achievement of learners in the province.
Acknowledgements
The assistance and contributions of Andrey Klevchuk to this research effort are greatly appreciated. The guidance and support of M. Benjamin Mphahlele, the Head of Treasury, province of Limpopo, during the time this study was initiated was a critical element in its completion.
References
BURGESS, D.F. 2013. Reconciling alternative views about the appropriate social discount rate. Journal of Public Economics, 97:9-17. [ Links ]
GLASS, G.V. & SMITH, M.L. 1979. Meta-analysis of research on class size and achievement. Educational Evaluation and Policy Analysis, 1(1):2-16. [ Links ]
GLEWWE, P. 2002. Schools and skills in developing countries: Education policies and socioeconomic outcomes. Journal of Economic Literature, 40(2):436-82. [ Links ]
GLEWWE, P. 2004. An investigation of the determinants of school progress and academic achievement in Vietnam. In Glewwe, P., Dollar, D. & Agrawal, N. (eds.) Economic growth, poverty, and household welfare in Vietnam (pp. 467-501) Washington, DC: World Bank. [ Links ]
GLEWWE, P. & KREMER, M. 2006. Schools, teachers, and education outcomes in developing countries. In Hanushek, E.A. & Welch, F. (eds.) Handbook of the economics of education, 2:945-1017. Amsterdam and Oxford: Elsevier, B.V. [ Links ]
HARBERGER, A.C. 1971. On measuring the social opportunity cost of public funds. IDA Economic Papers, Arlington: Institute for defense analyses, program analysis division. [ Links ]
JENKINS, G.P & KLEVCHUK, A. 2004. Project selection handbook for Department of Education: Limpopo province, DDP 2004-03, JDINT'L Queen's University, Kingston, Canada. dintl.econ.queensu.ca/working-papers/. [ Links ]
KUO, C-Y., JENKINS, G.P. & MPHAHLELE, M.B. 2003. The economic opportunity cost of capital in South Africa. South African Journal of Economics, 71(3):496-516. [ Links ]
LEVIN, M. 2001. Waiting for Godot: Cost-effectiveness analysis in education. New Directions for Evaluation, 90:55-68. [ Links ]
PSACHAROPOULOS, G. & PATRINOS, H.A, 2004. Returns to investment in education: A further update. Education Economics, 12(2):111-134. [ Links ]
SANDMO, A. & DREZE, J.H. 1971. Discount rates for public investment in closed and open economies. Economica, 38:395-412. [ Links ]
SSEWAMALA, F.M., WANG, J.S.H., KARIMLI, L. & NABUNYA, P. 2011. Strengthening universal primary education in Uganda: The potential role of an asset-based development policy. International Journal of Educational Development, 31(5):472-477. [ Links ]
Accepted: May 2014
1 For example, assume that a classroom is expected to be unusable in two years. Repairing the classroom makes it usable after Year 2 for a certain period of time. On the other hand, building a new classroom in Year 2 also provides additional class-space from Year 2; therefore, building a new classroom in two years results in similar effects on the supply of education services to those of repairing the old classroom.
2 'School district' represents the catchment area of one or two schools in a district. However, in the available data from Limpopo, each school district represents a school.
3 This is an estimate for measuring the effectiveness of adding one classroom to a school district. The formulas for finding the exact amount of effectiveness for infrastructure investments are explained in sections 2.2 and 2.3.
4 The standard number of learners in a classroom differs from one place to another. In Limpopo province, South Africa, this number is 40 (Jenkins & Klevchuk, 2004).
5 In countries where the economic return on investment in secondary school is higher than that in primary school, P will become negative.
6 The school districts are specified separately for primary and secondary education, based on the physical location of the available primary or secondary schools.
7 The length of the period of the analysis can be set at the life of a new classroom.
8 In 2004 the policy of the government of Limpopo was to pay the same price for the construction of a school consisting of a block of 4 classrooms anywhere in the province. Hence, the model here assumes a uniform cost of construction. If different costs were expected to be incurred depending on the location of the new construction, then the incremental cost-effectiveness would be calculated on the basis of the site specific construction costs. In addition, we were assured by the ministries involved that the construction costs of building a new school would be incurred over a period of one year or less. Hence it was decided to not apply a discount rate to the monthly expenditures within a year. If the construction costs were to be spread out over more than one year then these cost should be discounted back to the same period as the incremental effectiveness is evaluated.
9 A school district may be selected several times. The number of times that the school district is selected indicates the number of classroom blocks to be built in that school district.
10 As in the previous scenario, n stands for the length of the analysis. For simplicity, it is assumed that the renovation of a school will lengthen the useful life of its old classrooms and make it equivalent to that of a new classroom.
11 Since the information for each school represents the situation of a school district, there is no relationship between infrastructure investments in one school and the LCR of another school. Therefore, in the analyses of this section, the ICERs are calculated for the schools.
12 In this paper reasonable assumptions are made for this missing information in terms of a distribution of likely classrooms requiring repair and the costs of such repairs. However, in operationalising the model as a planning tool this information is relatively easy to obtain from the work of the survey engineers in the Provincial Department of Public Works. They carry out a periodic survey of the state of the buildings in the province as part of their efforts to maintain a record of the public sector assets in the province. The survey engineers could specify the actual number of classrooms requiring repair and also estimate the cost of such repairs, as they are specialists in this area.
13 This value for the standard deviation is chosen since it provides reasonable estimates for the actual renovation cost of the schools.
14 Since the data is for 2004, the analysis is carried out in 2004 prices. The present value of the effectiveness of infrastructure investments is also calculated using 2004 as the base year.
15 The information in the available dataset does not specify whether schools are located in urban or rural areas. Therefore, the economic returns of infrastructure investment in education systems in urban and rural areas are set equal for schools in this analysis.
16 The discount rate used in these calculations is economic opportunity cost of funds estimated to be 11 per cent for South Africa (Kuo, Jenkins & Mphahlele, 2003).
17 In the general model, determining the renovation budget allocation strategy is not as straightforward. Since in the Limpopo case each school represents a school district, renovation of a school does not alter the ICER of other schools. Therefore, recalculation of the ICERs is not required.
18 Some schools in Table 4 have one classroom with a condition of one or two. Since they only have one classroom, no renovation project is assigned to these schools.

