


Services on Demand
Article
 English (pdf)
 Article in xml format
 Article references
Indicators

Related links
-
 Cited by Google
 -
 Similars in Google
Share

 Permalink
South African Journal of Economic and Management Sciences
On-line version ISSN 2222-3436
Print version ISSN 1015-8812
S. Afr. j. econ. manag. sci. vol.18 n.1 Pretoria 2015
http://dx.doi.org/10.17159/2222-3436/2015/v18n1a4
ARTICLES
Economic inequality as a source of interpersonal violence: Evidence from Sub-Saharan Africa and South Africa
Geoff HarrisI; Claire VermaakII
ISchool of Public Management & Economics, Durban University of Technology
IISchool of Accounting, Economics & Finance, University of KwaZulu-Natal
ABSTRACT
This article examines whether the close association of income inequality and violence identified for high income countries applies also to sub-Saharan Africa and, in particular, to South Africa. Cross sectional analysis across sub-Saharan countries provided no evidence of such an association. However, using homicide rates and several measures of inequality across South Africa's 52 districts does provide evidence of a significant positive relationship between homicide rates and expenditure inequality. A one per cent increase in inequality is associated with an increase in the homicide rate of 2.3 to 2.5 per cent. This relationship remains significant after controlling for other characteristics of the district.
Key words: violence, income inequality, expenditure inequality, sub-Saharan Africa, South Africa
1 Introduction
The most reliable indicator of interpersonal violence - the intentional homicide rate per 100 000 people, where intentional homicide is 'unlawful death purposefully inflicted on a person by another person' - has been compiled by the United Nations Office on Drugs and Crime (UNODC). Their data suggests a world rate of about 7.0, with a total of approximately 450 000 homicides per annum. For Africa as a whole, the rate was 17.0 in 2010, with some 145 000 homicides. For South Africa, the rate was 31.8, placing it sixth in Africa and fifteenth in the world (UNODC, 2011:21-22). Among these first 15, South Africa has the highest number of murders - 15 609 in 2011, a figure which has fallen dramatically since 1995, when the number was 26 877 and the rate was 64.9.1
There is other evidence concerning violence in South Africa. Some 55 000 rapes and other sexual assaults are reported to the police each year. Using the findings from the Gauteng Gender Violence Prevalence Study that one in 25 such assaults is reported (Gender Links & the Medical Research Council, 2010) suggests that 1.375 million out of a population of about 25 million women are raped or sexually assaulted each year. In a nationally-representative survey of 1738 African males in KwaZulu-Natal and the Eastern Cape (Jewkes, Sikweyiya, Morrell & Dunkle, 2009), 27.6 percent of the respondents said that they had raped a woman or girl, and 4.6 per cent said they had done so within the last year. Furthermore, 42.4 per cent said that they had been physically violent to an intimate partner, and 14 per cent said that this had occurred within the last year.
In a recent study of the 'cost of violence containment' to individual countries by the Institute for Economics and Peace (2014), it was estimated that, in 2012, South Africa allocated 8.5 per cent of its GDP to this task,2 placing it 27th equally out of 163 countries and among the highest of those countries not involved in a civil war or low intensity armed conflict. Their study used the estimates by McCollister, French & Fang (2010) of the unit cost of criminal offences for the United States, which put the direct costs of a homicide (comprising the victim's lost productivity, criminal justice system costs and the opportunity costs to the perpetrator) at US$1.3 million in 2008.
Considerable research effort has been applied in trying to explain why South Africa, in particular, is so violent.3 One obvious explanation is the legacy of apartheid and its various precedents. As a social engineering strategy, apartheid was a classic example of structural violence in that its policies and programmes advantaged one social group and disadvantaged others, often resulting in premature death as a result of preventable disease. One of the consequences of the migrant labour system which underpinned apartheid was the breakup of families, with high proportions of children growing up without a male role model4 and a weakening of the communal control of individual behaviour. More specifically, the structural violence was maintained by direct violence, resulting in several generations of South Africans being 'educated' to deal violently with their conflicts. The fact that South Africa's neighbours -except for Lesotho, which supplies large numbers of migrant labourers to South Africa -have far lower homicide rates provides support for this explanation.
A more general explanation is the extent of economic inequality, commonly measured by the Gini coefficient or the ratio of the average income of the highest income earners to the average income of the lowest earners.5 The UNODC (2011:30) reports that 'countries with large income disparities (Gini Index higher than 0.45) have a homicide rate almost four times higher than more equal societies'. In their book The spirit level: Why more equal societies almost always do better, Richard Wilkinson and Kate Pickett (2010) demonstrate that higher income inequality almost invariably results in a worse performance on nine basic social indicators, including levels of violence. Their study was based on the most recent data from various international agencies for 23 rich countries and the 50 states of the US. They note (2010:144) that 'the association between inequality and violence is strong and consistent and has been demonstrated in many different time periods and settings'.
A number of prior studies have investigated the relationship between income inequality and violence, almost all - for reasons of data availability - in developed countries. They have generally found that violence levels are highest in areas (local government areas, states/provinces, countries) where income inequality is highest. Fajnzylber, Lederman & Loayza (2002), for example, examined income inequality (measured by the Gini coefficient) and violent crime (using homicide and robbery rates) across and within developed countries and concluded that income inequality had a positive and significant effect on crime rates.
An important finding from these studies was that violence did not appear to be linked to poverty. In their study of the 10 Canadian provinces and the 50 US states, Daly, Wilson & Vasdev (2001) found no association between homicide rates and median household income, but there was a significant positive correlation between homicide rates and income inequality, as measured by the Gini coefficient. They concluded that it is 'relative rather than absolute deprivation ... [which] has the greater effect on local levels of violent competition' (Daly et al., 2001:220-221).
It is important to consider why we might expect greater violence in the context of greater inequality. In economic terms, the standard explanation is that by Gary Becker (1968), who sees crime rates as a consequence of decisions based on comparisons of the anticipated gains from crime with the risk of being caught and the likely penalties that might follow. This reasoning can explain why, apart from the fact that they may live in close proximity to each other, poor people rob other poor people. That is, while the expected payoff is likely to be lower, the chances of being apprehended are also lower, given that the rich are likely to be better protected in terms of state-provided and private security resources. Decision-making of the kind discussed by Becker may well occur in the case of property crimes but, as we discuss in section 3.1, this does not seem to be a feature of murders, which predominate in South Africa; these typically result from an argument, fight or spontaneous anger, or else they occur during the course of another crime. Premeditated murders involving rational calculation are relatively uncommon in South Africa.
There are a number of explanations of crime from the disciplines of sociology and criminology and we briefly discuss several which seem the most relevant to our research. The term anomie has long been used by sociologists to refer to a society characterised by normlessness - an absence of the rules that govern behaviour - in which high levels of crime can be expected. Robert Merton (1938) extended the concept of anomie to become strain theory, which sees crime as a normal response to conditionswhich prevent some individuals from achieving economic success by legitimate means. Albert Cohen's (1971) study of young delinquent males in the US emphasised the 'status frustration' of being unable to achieve success, defined by the majority middle classes. While some lower-class boys accept their lot in life, others become 'angry failures' and develop a new culture in opposition to middle class values, authority figures and social control agents such as the police. More recent researchers, particularly Agnew (1992; 2007), have proposed a general strain theory, in which strain is defined simply as events and conditions which are disliked by individuals. Agnew (2012) identifies three main types of strain: an inability to achieve one's goals, the loss of positive stimuli (e.g. money, property or a relationship) and the presence of negative stimuli (e.g. verbal or physical abuse). He identifies the key role played by anger in promoting crime, particularly where the strain experienced is perceived as unjust. Feelings of relative deprivation mean that more unequal societies are likely to be societies that are angry and therefore more prone to violence. Inequality, then, breeds social tensions, because the less well-off feel disadvantaged when they compare themselves with better-off people. This might apply particularly in South Africa, given the coexistence of affluent and poor communities side by side as a result of apartheid spatial planning and policy.
From their epidemiological perspective, Wilkinson and Pickett stand firmly in this tradition and assert that the positive relationship between violence and income inequality is 'part of a more general tendency for the quality of social relationships to be less good in more unequal societies' (Wilkinson, 2004:2). Wilkinson argues that chronic stress is one of the most important influences affecting health in developed societies, and that three features of the social environment are major determinants of chronic stress. These are low social status (including relative income), low levels of social affiliation or connectedness, and stress in early life. In unequal societies, more people will feel 'disrespected and looked down on and unwilling to ignore incidents that appear to involve a loss of face' (2004:8). As a result, they are more likely to engage in violentbehaviour. Wilkinson and Pickett (2010:140141) add that 'violence is most often a response to disrespect, humiliation and loss of face and is usually a male response to these triggers' and that 'Shame and humiliation become more sensitive issues in more hierarchical societies'. Certainly the extent of conspicuous consumption by the rich in South Africa - previously white and to a lesser extent Indian, but increasingly black - is extreme. Those who struggle to survive might well be angry at such opulence. Again, this explanation can accommodate the fact that poor people overwhelmingly commit crimes, including murder, against other poor people and not against the rich; angry and frustrated people may lash out, when circumstances arise, against those closest to hand.
The aim of this article is thus to investigate the relationship between inequality and interpersonal violence in sub-Saharan Africa (SSA) and in South Africa. We used cross sectional data from sub-Saharan African (SSA) countries and district level data for South Africa to investigate the relationship between homicide rates and several measures of economic inequality. We did not find a significant relationship between inequality and homicide rates in the sample of SSA countries. However, we found a significant positive relationship between expenditure inequality and homicide rates for South Africa. Multivariate models using district level data confirmed this relationship. The remainder of the paper is structured as follows. Section 2 examines the data available for this analysis at the national level across sub-Saharan Africa, and calculates the correlation between economic inequality and violence for these countries. In section 3, we focus the analysis on South Africa in particular, and estimate the relationship between inequality and violence in both bivariate and multivariate contexts, using district-level data. Finally, section 4 summarises the findings and provides a conclusion.
2 Sub-Saharan Africa
2.1 Data sources and variables
The limitations and in many cases the non-existence of statistical data on violence throughout SSA made it necessary to use the UNODC's 'intentional homicides per 100 000 persons' as a proxy for inter-personal violence.6 Inequality was measured by two variables -the income Gini coefficient, which would have a value of 0.0 in a perfectly equal society and 1.0 in a perfectly unequal society, and the ratio of the average income of the richest 10 per cent of the population to the average income of the poorest 10 per cent (hereafter the rich:poor income ratio). Longitudinal data on these and other variables is limited so cross sectional country data were used. Three measures of poverty were employed: GDP per capita (2005 PPP), the percentage of the population living below US$1.25 PPP per day and the percentage of the population in multidimensional poverty, i.e. with a weighted deprivation score of at least 33 per cent in education, health and living standards. All inequality and poverty data were derived from the United Nations Development Programme's (UNDP), International Human Development Indicators and the World Bank's World Development Indicators.7
2.2 Results
It might be expected that violence is positively related to poverty, as poor people may be more likely to commit murder because of the sheer frustration of being poor, or perhaps as part of an attempt to escape from poverty through robbery. However, when homicide rates were correlated with the three measures of poverty -GDP per capita, the proportion of the population existing on less than US$1.25 per day and proportion of the population in multidimensional poverty, the correlations were not significant (respectively, r = 0.018, p = 0.905; r = -0.030, p = 0.853; and r = -0.149, p = 0.385) across the SSA countries.
The relationship between inequality and violence is central to this article. We can note that there is a very close relationship between the two measures of inequality - the Gini coefficient and the rich:poor income ratio (r = 0.830, p = 0.000). The correlation coefficients between homicide rate and the Gini coefficient for 30 countries were 0.086 (p = 0.653), while with the rich: poor ratio it was 0.160 (p= 0.477) for 22 countries.8 The relationship found by Wilkinson and Pickett for developed countries, then, does not seem to apply to SSA.
3 South Africa
There have been several previous investigations of the inequality-crime link in South Africa. Brown (2001) used data from South Africa's 1994 Household Survey at the magisterial district level (there are 52 districts) to investigate for the causes of 'the crime rate', which may well have included non-violent crimes.9 Brown found only a few significant correlations, among them a negative correlation between the crime rate and several education variables. The crime rate was not found to be significantly related to median income, the poverty gap index or the Gini coefficient at the district level.
Demombynes and Ozler (2005) investigated how the location of communities in South Africa, specifically their economic position compared with that of their neighbours, might be associated with property and violent crime. Using census data and crime data from each police precinct for 1996, they found that inequality in terms of average expenditure between neighbouring communities was positively and significantly related to the number of property crimes but not to the number of violent crimes. They found a positive and significant relationship between average expenditure within communities and both types of crime. For violent crime, the results showed rates increasing as average expenditure increased for the poorer half of communities and then decreasing for the richer half. Using 2001 census data, O'Donovan (2011) reached similar conclusions, that there was no correlation between the level of inequality in a police precinct and its level of crime, and that while both types of crime increased along with average income in the poorer police precincts, this effect fell away for violent crime in the richer precincts.
The only longitudinal study for South Africa of which we are aware (Luiz, 2001) examined the trends and determinants of criminal offences between the early 1960s and 1993. Given the high correlations between the six types of offences,10 this study used total offences per capita as its dependent variable, with income per capita, the percentage of offences solved, the number of police per 1000 of population and an index of political instability/repression as its explanatory variables. Income per capita had a significant negative sign while the other coefficients were not significant. The imputed elasticity of the offences and income variables showed a larger fall in offences per capita at lower levels of income than at higher levels. With murders per capita as the dependent variable, the income coefficient was not significant but the other three were significant (the offences solved and political instability/repression variables had the expected negative sign, but the police variable was 'perplexingly' positive). Luiz concludes that long-term solutions to crime must include an expansion of economic opportunities.
3.1 Data sources and variables
In this study, we used data from Statistics South Africa's Income and Expenditure Survey (IES) for 2005/6, which collected data from some 24 000 households, to compile three measures of per capita household income and expenditure inequality at the District Municipality level - the Gini coefficient, the Theil index (which measures the extent of the redundancy of income of some individuals, which implies scarcity of income for others) and the ratio of the average income and expenditure of the richest households to the poorest. We also constructed variables for a number of likely covariates of violent crime at the district level, using demographic and economic data from the IES.
The number of intentional homicides for 2009/10 was provided by the Crime and Justice Programme of the Institute for Security Studies, which converted data from the some 1040 police precincts to district level. The district-level homicide rate per 100 000 in the population serves as the dependent variable in our analysis. A potential concern might be that only some types of murders (crimes of passion, family disputes, robberies gone wrong) were likely to be committed by the 'angry poor', and thus might be affected by the level of inequality. In fact, it is precisely these types of murders which predominate in South Africa. The CSVR (2008b) study Streets of pain, streets of sorrow reports an intensive study of 1161 murders between 2001 and 2005 in six areas - all urban - with high murder rates. The murders had much in common in terms of locality, levels of blood alcohol, weapons used, the percentage of male and female victims, and more, with murders examined in other South African research. Of most interest to this article is their classification of murders into seven main categories: murders related to an argument, fight or spontaneous anger (26 per cent of the sample); murders in the course of another crime (12 per cent); killings in self-defence (2 per cent); murders related to conflicts between formal groups (less than 1 per cent); other types of murder (7 per cent); and murders for which the motives are unclear (12 per cent) or unknown (41 per cent).11 Of the 'killings in known circumstances', 55 per cent were argument-type murders. Clearly many of the other killings also occurred in situations which had got out of hand. Premeditated murders, in which a potential killer (following the logic of Becker and others) makes a decision based on the potential gain adjusted for the likelihood of being caught, do not seem common in South Africa. The 'premeditated killing of a current or former intimate partner', for instance (one of the components of 'other types of murder') accounts for less than one per cent of murders in the sample.
The inequality data and the crime data are not completely concurrent, but this is unlikely to pose a particular problem for the analysis, for two reasons. First, the demographic and economic characteristics of a district are likely to change fairly slowly over time, and second, there may well be a lag between changes in such characteristics and any changes in the violent crime that they provoke. The summary statistics for the inequality measures and homicides are presented in Table 1.
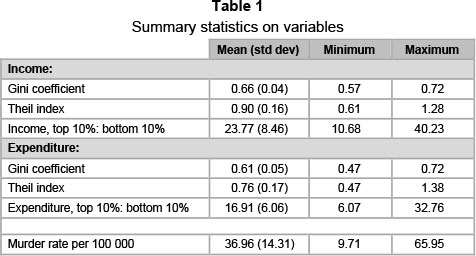
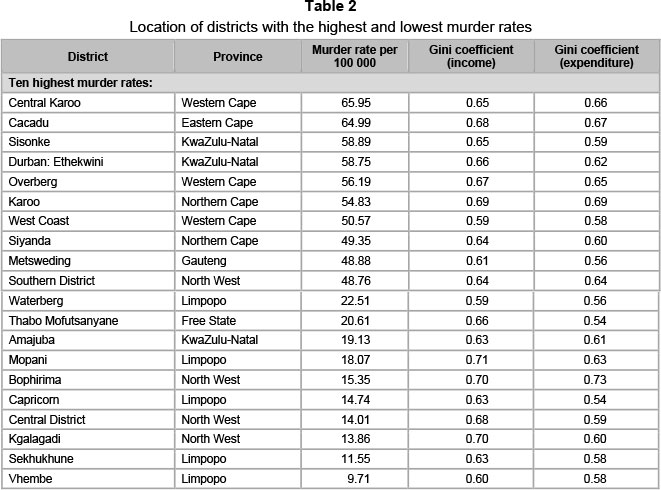
Table 2 below lists the location of the ten districts with the highest, and ten with the lowest, murder rates. There is considerable geographical variation in the murder rate, which provides a strong motivation for analysing violent crime at the sub-national level. In investigating crime at the district level, we have implicitly assumed that crimes occurred where they were reported, and were committed by individuals living in this same geographical location. These assumptions would not be valid, and we would be concerned about measurement error if, for example, the bodies of homicide victims were found in a different district from where the crime took place, or if the crime was committed in one district by individuals who were resident in a different district. Such issues are most likely to arise close to the district boundaries, and this would be of considerable concern if the geographical units analysed were very small. However, the 52 district municipalities are large, with an average population size of almost 900 000 people and land area of more than 23 000km.2 We were therefore confident that the 'signal to noise' ratio in the data was satisfactory.
3.2 Results
We then examined the relationship between the homicide rate and the various measures of inequality. Figures 1 and 2 plot the homicide rate against one of the three measures of economic inequality, namely the Gini coefficient, calculated using per capita household income and expenditure respectively. While no relationship is visible in the first figure, the second figure clearly indicates that districts with higher levels of inequality in household expenditure also have higher homicide rates.


We correlated homicide rates with the three economic inequality measures. The resulting Pearson correlation coefficients are presented in Table 2. There are no significant correlations at the five per cent level between any of the three income inequality measures and the murder rate, but two of the expenditure inequality measures are positive and significant, which is consistent with the relationships suggested in Figures 1 and 2. This result accords with the reasoning of Wilkinson and Pickett (2010) it is the expenditure from high incomes, perhaps particularly on visible and ostentatious houses, cars and the like, which has the potential to make the poor feel angry. An additional explanation for the more significant expenditure results is that expenditure may be better measured in the IES data than income. Households kept a diary in which they recorded their purchases, which may have resulted in more accurate data on expenditure, whereas income data were collected using the recall method.
The correlation results from Table 3 thus indicate that homicide rates positively and significantly correlate with measures of expenditure inequality, but not with inequality in incomes. We did not conduct any further analysis on the income measures, owing to their statistical insignificance. We explored the significant expenditure correlation further by conducting multivariate analysis on the correlates of the homicide rate.

One potential concern when conducting such an analysis using cross-sectional data is that, as a result of unobserved heterogeneity across the districts, it may not be possible to identify the causal determinants of the homicide rate. We have therefore discussed the results below in terms of identifying, in a multivariate context, the correlates of the homicide rate, but without drawing any conclusions about the causal effect of inequality.
In order to deal with unobserved heterogeneity, we would need to construct a panel of homicide rates, inequality and other socioeconomic factors. The causal effect of inequality on crime would then be identified through changes in these two variables across time. We have not done this here owing to serious concerns about the comparability of crime data over time. Changes in policing priorities over time in South Africa have created perverse incentives for the reporting and classification of violent crimes, especially in poorer areas. In discussing these changes in detail, Bruce (2010:15) warns against using such statistics as '...a reliable indicator of trends in crime, particularly in violent crime'. In such a context, the 'signal to noise' ratio in crime statistics is likely to be larger in a panel, where effects are identified through changes in crime over time, rather than in the cross-sectional data that we used here. Nonetheless, we suggest that this may be an interesting, although challenging, area for future analysis.
In each model displayed below, the dependent variable was the homicide rate per 100 000 persons; the key variable of interest was the measure of expenditure inequality. In addition, a number of possible covariates were explored, based on the existing literature.12 These included district-level measures of access to resources (mean household expenditure, the employment rate and the poverty rate), demographic characteristics (population size, the proportion of female-headed households, the proportion of the population aged 20-39 and the racial composition) and geographical characteristics (the proportion of households living in rural areas).
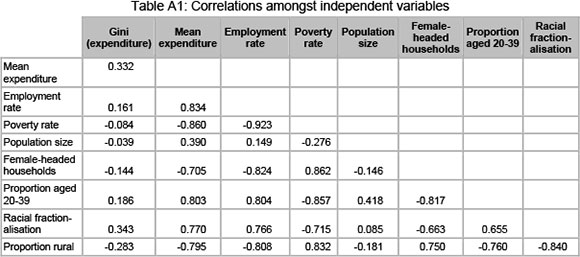
One potential concern was that many of these covariates were correlated highly with each other, and with the degree of inequality in the district (these correlations are presented in Table A1 in the appendix). It was therefore not possible to include all of the covariates in a single model. Instead, we estimated several models containing subsets of these covariates, and compared the results.
The models, focusing on the Gini coefficient for expenditure as the measure of inequality, are presented in Table 4.13 All the variables were entered in logarithm form, so the coefficients represent elasticities.14 We found that the level of expenditure inequality, as measured by the Gini coefficient for expenditure, positively and significantly correlated with the homicide rate across all three of the model specifications: a one per cent increase in inequality was associated with an increase in the homicide rate of 2.3 to 2.5 per cent. The degree of statistical significance of this relationship varied, depending on which other covariates were included in the model. Most notably, the significance of inequality as a determinant of crime fell when we also controlled for the district level poverty rate in Model 3.
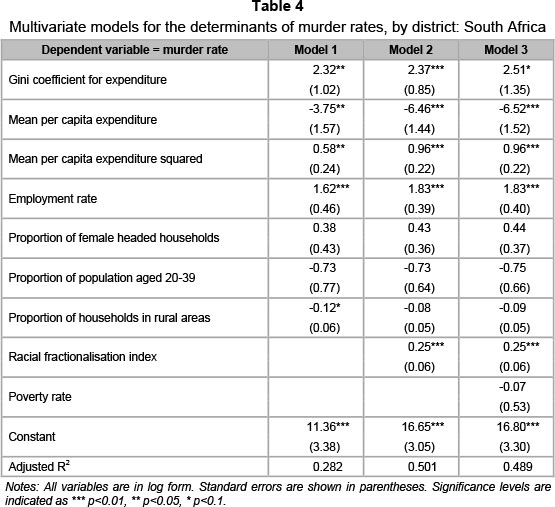
We also found a number of other statistically significant correlates of the homicide rate. There was a strong U-shaped relationship between the average level of per capita household expenditure and the homicide rate. Thus, for a given level of inequality, increases in average expenditure were associated with lower murder rates in poor districts, but with higher murder rates in wealthier districts. In addition, the proportion of working-age adults who were employed15 was positively associated with violent crime. There are at least two potential explanations for this latter finding. First, the employment rate may measure the value of assets, and thus the potential benefit to be gained from crime (Demombynes & Ozler, 2005).16 Districts with high employment rates may thus represent 'rich pickings' and the murder rate may partially reflect the violence that occurs during robberies. Second, an unemployed individual's feelings of marginalisation and isolation may be lower if many other people in the district are also unemployed (Clark & Oswald, 1994). Therefore, when the employment rate is high, the relatively small number of people who are out of work may feel more marginalised and more violently disposed towards others.
We did not find a significant association between the proportion of households that are headed by women, or the proportion of the population aged 20 to 39, and the homicide rate. The former finding is consistent with Demombynes and Özler (2005), but the latter is not. Districts in which a greater proportion of households are located in rural areas had lower homicide rates, but only in Model 1, when we did not control for the racial composition or poverty rate in the district. Racial fractionalisation was correlated with significantly higher homicide rates.17 A one per cent increase in the degree of racial heterogeneity in the district was associated with a 0.25 per cent increase in the murder rate.
The poverty rate in the district was not a significant correlate of the homicide rate.18 The inclusion of this variable in Model 3 decreased both the statistical significance of the relationship between inequality and crime, from the one to the ten per cent significance level, and the fit of the model. The poverty rate was also not significantly associated with the homicide rate when we omitted mean expenditure from the model. Our results suggest that the key correlates of the homicide rate were the average level of expenditure and the degree of inequality in expenditure, rather than the level of poverty.
It was suggested to us that we could also examine the relationship between property crime (burglary, theft of motor vehicles, theft from motor vehicles and stock theft) and inequality, given that such crimes are more likely to be the result of rational decisions in the Beckerian sense, as opposed to homicides.19 While the main focus of our research is on the relationship between economic inequality and interpersonal violence, we did carry out a parallel analysis with the number of property crimes per 100 000 people in 2009/10 as the explanatory variable. The property crime rate was not significantly related to the Gini coefficient for either income or expenditure but it was very significantly related to the ratio of the richest to the poorest 10 per cent, for both income and expenditure. Extreme inequality, then, may be an important determinant of property crime. In multivariate models; however, this significance disappears once racial fractionalisation is controlled, suggesting that the racial aspect is of central importance. The results are complex, and, given that property crime is not the main focus of this article, we plan to prepare a Research Note to discuss the results in detail.
4 Conclusion
This article set out to examine whether the close association of income inequality and violence identified for high income countries also applies to sub-Saharan Africa and South Africa. Cross sectional analysis using district-level data did not provide evidence of such an association for sub-Saharan Africa, nor for income inequality in South Africa. However, there was evidence of a statistically significant relationship between expenditure inequality and the murder rate for South Africa. In addition, we found that the relationship between the Gini coefficient and the murder rate remained significant, even when controlling for a range of other demographic and economic correlates of violent crime.
This study indicates an important reason for adopting policy measures that reduce expenditure inequality. Income and wealth inequality have become much greater since the early 1980s, particularly in the US and the UK, but also in many other countries. It is increasingly recognised that this is having widespread negative impacts across a range of social indicators and is resulting in less cohesive and less sociable societies. There has been significant thinking about how societies have become more unequal and how they can become more equal again. Paul Krugman (2009) attributes the source of increased inequality in the US to changes in institutions, norms and the use of political power. He mentions in particular the decline in trade union power, a reduced willingness on the part of capital to share productivity gains with labour, the influence of the political right, reduced tax rates for high income earners and reduced expenditure on services that benefit low income earners. The last two have been a result of deliberate policy choices by governments with a strong pro-market stance. Joseph Stiglitz (2012) also emphasises the centrality of changes in tax and welfare policies in explaining increasing income inequality in the US.
In a measured discussion of ways of making societies more equal, Wilkinson and Pickett note that there is no lack of means available to a society which is motivated to reduce inequality (2010:241). Based on the varied experience of different countries, they suggest two quite different paths, which are not mutually exclusive - the use of taxes and benefits to redistribute income and reduction of differences in gross earnings before any further redistribution takes place. There is a cost to not acting to reduce inequality; in their words, 'There may be choice between using public expenditure to cope with social harm where inequality is high [e.g. police, prisons], or to pay for real social benefits [e.g. education, health] where it is low' (2010:246).
References
AGNEW, R. 1992. Foundation for a general strain theory of crime and delinquency. Criminology, 30(1): 47-87. [ Links ]
AGNEW, R. 2007. Pressured into crime: An overview of general strain theory, New York: Oxford University Press. [ Links ]
AGNEW, R. 2012. Reflections on 'a revised strain theory of delinquency'. Social Forces, 91(1):33-38. [ Links ]
BECKER, G. 1968. Crime and punishment: An economic approach. Journal of Political Economy, 76(2):169-217. [ Links ]
BROWN, K. 2001. The determinants of crime in South Africa. South African Journal of Economics, 69(2):269-298. [ Links ]
BRUCE, D. 2010. 'The ones in the pile were the ones going down': The reliability of violent crime statistics. SA Crime Quarterly, 31:9-17. [ Links ]
CENTRE FOR THE STUDY OF VIOLENCE & RECONCILIATION (CSVR). 2008a. Adding insult to injury: How exclusion and inequality drive South Africa's problem of violence, Johannesburg: CSVR. [ Links ]
CENTRE FOR THE STUDY OF VIOLENCE& RECONCILIATION (CSVR). 2008b. Streets of pain, streets of sorrow: The circumstances of the occurrence of murder in six areas with high murder rates, Johannesburg: CSVR. [ Links ]
CENTRE FOR THE STUDY OF VIOLENCE & RECONCILIATION (CSVR). 2009. Why does South Africa have such high rates of violent crime? Johannesburg: CSVR. [ Links ]
CLARK, A. & OSWALD, A.J. 1994. Unhappiness and unemployment. Economic Journal, 104(424): 648-659. [ Links ]
COHEN, A. 1971. Delinquent boys: The culture of the gang. New York: Free Press. [ Links ]
DALY, M., WILSON, M. & VASDEV, S. 2001. Income inequality and homicide rates in Canada and the United States. Canadian Journal of Criminology, 41(2):219-236. [ Links ]
DEMOMBYNES, G. & OZLER, B. 2005. Crime and local inequality in South Africa. Journal of Development Economics, 76(4):265-292. [ Links ]
FAJNZYLBER, P., LEDERMAN, D. & LOAYZA, N. 2002. Inequality and violent crime. Journal of Law and Economics, 45(1):1-40. [ Links ]
GENDER LINKS & THE MEDICAL RESEARCH COUNCIL. 2010. The war @ home: Preliminary findings of the Gauteng gender violence prevalence study. Johannesburg: Gender Links & Medical Research Council. Available at: www.genderlinks.org.za/page/16-days-of-activism-2010 [accessed 2014-02-15]. [ Links ]
GENEVA DECLARATION ON ARMED VIOLENCE & DEVELOPMENT. 2011. The global burden of armed violence 2011. Geneva: Geneva Declaration on Armed Violence. [ Links ]
HALL, K. & WRIGHT, G. 2010. A profile of children living in South Africa in 2008. Journal for Studies in Economics and Econometrics, 34(3):45-69. [ Links ]
INSTITUTE FOR ECONOMICS & PEACE. 2014. The economic cost of violence containment: A comprehensive assessment of the global cost of violence. IEP Paper 25. Available at http://visionofhumanity.org/sites/default/files/The%20Economic%20Cost%20of%20Violence%20Containment.pdf [accessed 2014-02-15]. [ Links ]
JEWKES, R., SIKWEYIYA, Y. MORRELL, R. & DUNKLE, K. 2009. Understanding men's health and use of violence: Interface of rape and HIV in South Africa. Pretoria: Medical Research Council. [ Links ]
KRUGMAN, P. 2009. The conscience of a liberal: Reclaiming America from the right. London: Penguin. [ Links ]
LUIZ, J. 2001. Temporal association, the dynamics of crime, and their economic determinants: A time series econometric model of South Africa. Social Indicators Research, 53:33-61. [ Links ]
McCOLLISTER, K., FRENCH, M. & FANG, H. 2010. The costs of crime to society: New crime specific estimates for policy and program evaluation. Drug and Alcohol Dependence, 108:98-109. [ Links ]
MERTON, R. 1938. Social structure and anomie. American Sociological Review, 54(5):597-611. [ Links ]
O'DONOVAN, M. 2011. Crime, poverty and inequality in South Africa: What the data shows. In C. Gould (ed.) National and international perspectives on crime and policing: Towards a coherent strategy for crime reduction in South Africa beyond 2010. Pretoria: Institute for Security Studies:26-33. [ Links ]
STATISTICS SOUTH AFRICA. 2008a. Income and expenditure of households 2005/2006: Unit records, Pretoria: Statistics South Africa. [ Links ]
STATISTICS SOUTH AFRICA. 2008b. Measuring poverty in South Africa: Methodological report on the development of the poverty lines for statistical reporting. Technical report D0300. Pretoria: Statistics South Africa. [ Links ]
STIGLITZ. J. 2012. The price of inequality. London: Allen Lane. [ Links ]
UNITED NATIONS DEVELOPMENT PROGRAMME. 2013. Humanity divided: Confronting inequality in developing countries, New York: UNDP. [ Links ]
UNITED NATIONS OFFICE ON DRUGS AND CRIME (UNODC). 2011. Global study on homicide. Vienna: UNODC. [ Links ]
WILKINSON, R. 2004. Why is violence more common where inequality is greater? Annals of the New York Academy of Sciences, 1036:1-12. [ Links ]
WILKINSON, R. & PICKETT, K. 2010. The spirit level: Why equality is better for everyone. London: Penguin. [ Links ]
Accepted: May 2014
1 There are reasons to suspect the accuracy of South Africa's crime statistics. Following the government's announcement in 2004 of its intention to reduce violent crime by 7-10 per cent per annum, Bruce (2010) examined the recorded levels of six major categories of violent crime between 2003/4 and 2008/9. He found 'a number of peculiarities', which he explained in terms of the strong incentives for police at the station level to under-report violent crime. Using such data to determine trends in crime levels is therefore problematic. That said, when it comes to violent crimes, murders are probably the least amenable to under-reporting and they recorded the lowest decline (8.5 per cent) over the five years.
2 Worldwide, military expenditure made up 51 per cent of the total cost, with homicides the next most important component at 15 per cent, followed by internal security officers and police at 14 per cent.
3 The major research effort in this respect was carried out by the Centre for the Study of Violence & Reconciliation (CSVR), and is summarized in CSVR (2009).
4 In 2008, only 35 per cent of South African children lived in the same household as their biological father (Hall & Wright, 2010).
5 A major study (CSVR 2008a) is sub-titled How exclusion and inequality drive South Africa's problem of violence.
6 Intentional homicide rates per 100 000 people are reported by the UNDP, based on UNODC (2011). For nine countries, there are non-trivial differences between the UNDP rates and those reported in the UNODC's website under 'Homicide statistics 2013' (www.unodc.org/unodc/en/data-and-analysis/homicide.html [accessed 2013-08-17], which reports rates for the years 2007-2011. Correlations were run with both lists of rates but this made virtually no difference to the results. The correlations reported are based on the more recent 'Homicide statistics 2013. For a discussion of the data sources for homicide rates and why the numbers reported are likely to under-estimate the actual numbers of homicides, see Geneva Declaration on Armed Conflict (2011:48-51).
7 http://hdrstats.undp.org/en/indicators and http://data.worldbank.org/indicator [accessed 20 August, 2013].
8 Data on the rich-poor ratio were not available for the full sample of sub-Saharan African countries.
9 We have not been able to locate the precise nature or source of this variable.
10 With the exception of assault, the offences had correlation coefficients with each other of 0.8 or more.
11 It is possible to perform such an analysis only with access to individual dockets. Owing to the level of aggregation of our data, it was not possible for us either to conduct a similar breakdown of murder types, or to analyse only particular categories of murder.
12 We particularly referred to the studies using South African data, such as Brown (2001), Luiz 2001, Demombynes and Õzler (2005) and O'Donovan (2011).
13 We focused on the Gini coefficient, as this is the most common inequality measure analysed in the literature. The multivariate results were similar when we used the ten per cent rich:poor ratio instead of the Gini coefficient. The Theil index, which was insignificant in the bivariate context in Table 3, was also insignificant in the multivariate context. These results are available from the authors on request.
14 The findings were qualitatively similar when the variables were entered in levels, the main exception being the level of significance on the mean expenditure variables. These results are available from the authors on request. The log regression was preferred here as it appeared to fit the data better.
15 It is not possible to calculate a district level unemployment rate using these data, as the survey does not distinguish between the unemployed and the economically inactive. Instead, we calculated the employment rate as the proportion of adults aged 15 to 59 who were employed.
16 Our models are able to control for average current expenditure in the district, but not for households' stocks of assets.
17 The index of racial fractionalisation measures the probability that two randomly-selected individuals will belong to the same racial group.
18 The poverty rate was calculated as the proportion of households with per capita household expenditures of less than R413 per month in 2005 prices (Statistics South Africa, 2008b).
19 However, there is a concern that property crime data are less likely than homicide data to be accurate. In addition to incentives for the police to under-estimate crimes (see footnote 1), members of the public may not take the trouble to report property crimes unless this is needed for insurance claim purposes.
Appendix

