


Servicios Personalizados
Articulo
 Inglés (pdf)
 Articulo en XML
 Referencias del artículo
Indicadores

Links relacionados
-
 Citado por Google
 -
 Similares en Google
Compartir

 Permalink
South African Journal of Economic and Management Sciences
versión On-line ISSN 2222-3436
versión impresa ISSN 1015-8812
S. Afr. j. econ. manag. sci. vol.17 no.5 Pretoria 2014
ARTICLES
Aspects of volatility targeting for South African equity investors
Bhekinkosi KhuzwayoI; Eben MaréII
IStanlib Asset Management
IIDepartment of Mathematics and Applied Mathematics, University of Pretoria
ABSTRACT
We consider so-called volatility targeting strategies in the South African equity market. These strategies are aimed at keeping the volatility of a portfolio consisting of a risky asset, typically an equity index, and cash fixed. This is done by changing the allocation of the assets based on an indicator of the future volatility of the risky asset. We use the three month rolling implied volatility as an indicator of future volatility to influence our asset allocation. We compare investments based on different volatility targets to the performance of bonds, equities, property as well as the Absolute Return peer mean. We examine risk and return characteristics of the volatility targeting strategy as compared to different asset classes.
Key words: volatility, equities, risk, return, draw-down, asset allocation, VIX, implied volatility
1 Introduction
Volatility targeting strategies aim to allocate between cash and a risky asset, typically an equity index, with the aim to keep the overall volatility of the strategy stable at a targeted level. The effect on asset allocation due to volatility targeting is deleveraging of the risky asset in periods of high volatility and leveraging in periods of low volatility.
Volatility targeting holds the promise of higher risk-adjusted returns (as well as decreased tail-risks) relative to a static asset allocation, see for example, Ribeiro and Di Pietro (2008) and De Rossi and Nakisa (2011). The latter authors note that a study of volatility controlled strategies leads to insights for fund managers typically constrained by targeted tracking error mandates which in turn are directly impacted by market volatility. Risk budgeting is also directly impacted by volatility. Additionally, investment strategies with controlled volatility lend themselves to structured products with riskcontrolled derivative structures as an overlay.
On 1 August 2012 the FTSE/JSE launched a new suite of indices called the 'FTSE/JSE Africa TOP40 risk target indices' or the 'risk target indices'. These indices are set to target 10, 15 and 20 per cent volatility on an excess and total return basis, respectively. See, FTSE (2012) and Jooste (2012).
The purpose of this article is to investigate some key aspects of volatility targeting in a South African equity market setting, focusing on the potential risk management aspects and benefits of the strategy. In Section 2 we provide an example of the workings of the strategy over time based on the FTSE/JSE All Share (All Share) index; we also review relevant literature. In Section 3 we compare risk and return of volatility controlled strategies to typical South African investment asset classes as well as risk controlled investment strategies typified by the Absolute Return peer universe. We provide conclusions as well as some suggestions for future research on this topic in Section 4.
2 Aspects of volatility targeting
In an equity based volatility targeting strategy the optimal allocation to equities can be calculated as follows:
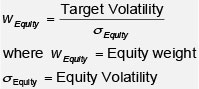
The equity volatility is the decision-making variable in the formula above. To implement the formula we would typically, at time t, generate a forecast of the equity volatility for time t+1, thereby adjusting the exposure to the equity so as to set the ex ante volatility of the strategy equal to the targeted volatility.
In general, the future volatility of an asset is not known with certainty although there are numerous techniques to forecast it with a fair degree of accuracy using simple measures of past volatility and historical returns. See, for example, the review by Poon and Granger (2003) which compares historical volatility and GARCH-based forecasting methods as well as implied volatility with findings which support implied volatility forecasts. In this paper we shall use option implied volatility. See also, Banerjee, Doran and Peterson (2007).
At the onset of every investment period, typically daily, one would invest the allocation above to equities and the balance in cash. Note that the ratio could be larger than one which would imply a geared position in equities. For the purpose of our analysis we cap the equity investment at 100 per cent therefore allowing no gearing as is typically the norm in the South African investment industry.
By construction this strategy will up-weight equities during times of low market volatility and down-weight equities during times of increased market volatility. For the purposes of illustrating the method we use the 12-month realised historical volatility as our decision variable. The graph below depicts rolling 12-month volatilities and returns of the All Share index over the period 1976 to 2012.
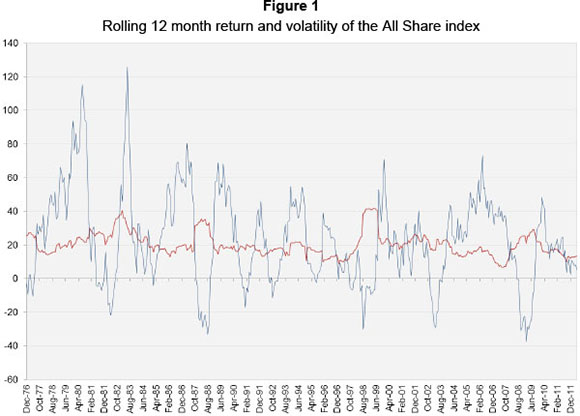
We note that we would not typically use the 12-month historical volatility to influence our asset allocation change decisions; though, we would typically use a volatility forecasting methodology or make use of implied volatility. It is used here mainly for illustrative purposes.
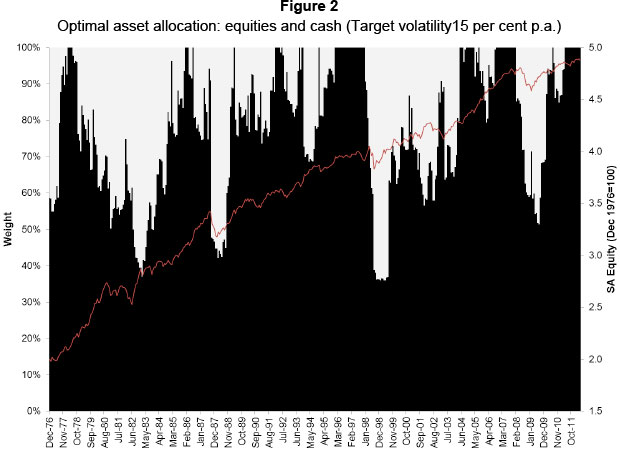
In Figure 2 we show what the optimal asset allocation to equities and cash would have been over the period December 1976 - July 2012, assuming a volatility target of 15 per cent p.a. The figure also depicts the cumulative returns of equity on a logged-basis (in red).
We note some important points. As the market rallies the equity allocation increases until there is a significant decline in the market. Consequently, the equity allocation is generally at its highest (i.e. 100 per cent) just before a downturn. Subsequent to a downturn the equity weight is reduced. However, the reduction only happens after the downturn which means that the strategy would fail to avoid the large drawdowns in equity markets. Secondly, after a crash the equity market seems to rally. However, the equity allocation is at its lowest just after the crash. As a result, the strategy also fails to capture the initial phase of the market upturn. All-in-all such a strategy would be expected to underperform equity at a reduced volatility. However, the drawdowns could be similar to equity drawdowns given that the portfolio is generally fully exposed to equity prior to significant market drawdown periods.
Volatility targeting strategies are a recent financial innovation. We highlight some relevant research here to illustrate the insight and background - clearly, if such a strategy were to be successful it would need to exploit some relation between volatility and future returns; however, a detailed study on the causality between volatility and returns is beyond the scope of this article.
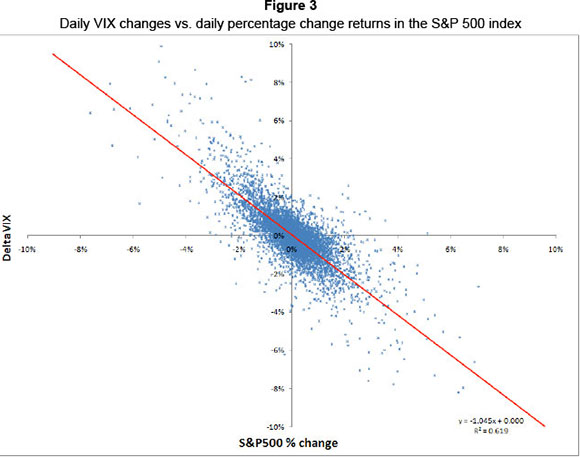
Black (1976) noted that the volatility of a stock depends on the level of the stock. Consider Figure 3 below. This figure details the daily change in the CBOE volatility index (VIX) against the daily percentage change in the S&P 500 equity index. This figure demonstrates a strong link between short-term index-based returns and implied volatilities of options traded on the index.
French et al. (1987) demonstrated a positive relationship between expected market risk premia and predictable volatility of stock returns. Chu et al. (1996) relate variation in stock market volatility to regime shifts in stock market returns and note the asymmetric relationship. More recently, Li et al. (2005) found evidence that stock market returns and stock market volatility are negatively correlated, lending support to claims by Bekaert and Wu (2000) as well as Whiteaw (2000). See also, Cont (2001), who notes the persistence of volatility in the equity markets, i.e., periods of high volatility tend to be followed by periods of high volatility.
The relationship between returns and volatility is difficult to capture, however, and also changes over time, see for example, Poterba and Summers (1986), Harrison and Zhang (1999) and Baillie and DeGennaro (1990). Using S&P500 data, Bollerslev and Zhou (2006) consider and explain implied and realised volatility and return relations. A number of papers consider the implied volatility skew for equities, detailing an increase in implied volatility with a decrease in equity returns, see, for example, Derman (1999).
Banerjee et al. (2007) demonstrate links between VIX-related variables and returns. Copeland and Copeland (1999) also demonstrate use of the VIX for market timing while Fleming et al. (2003) demonstrate the economic value of volatility timing using realised volatility. Malz (2000) demonstrate that implied volatility could signal increased likelihood of market turmoil.
Graham and Harvey (1996) examined invest-ment newsletters offering advice on asset allocations - finding no evidence of forecasting ability although, interestingly, the disagreement between newsletters is found to be correlated with future realised and implied volatility.
It is clear from the literature surveyed above that there is informational content in asset return volatilities (measured on a historical and implied basis). The link with future returns is less clear and varies by holding period. However, from the literature surveyed above one can follow the logic of a volatility targeted investment; in periods of high volatility, frequently associated with bear-markets, the strategy would have a lower weight in the risky asset than in periods of lower volatility, frequently associated with Bull-markets. In principle, the volatility weighting becomes a tactical asset allocation methodology.
3 Risk and return comparisons
In this section we consider a more realistic volatility targeting strategy than demonstrated in Section 2. Using the results by Malz (2000) and Banerjee et al. (2007) and inspired by Poon and Granger (2003) we consider using implied volatility to forecast future volatility and consequently to signal asset allocation changes.
We use the rolling 3-month interpolated implied volatility obtained from SAFEX traded options on the FTSE/JSE Top40 index to signal volatility changes. The rolling implied volatility is obtained by linearly interpolating implied volatility data between the so-called 'near' and 'middle' SAFEX futures contract expiration dates to obtain a consistent 3-month volatility control. The data used in our analysis covers the period from November 2000 to July 2012. We also use equity invested in the FTSE/JSE Top40 index and cash investments are based on the so-called SteFi (Short-term fixed interest call deposit index).
We consider weekly portfolio changes. We also assume the strategy is implemented on the FTSE/JSE Top40 index using futures - this is a practical assumption and has the benefit of simplifying our analysis as the futures are highly liquid and transaction costs are minimal.
The performance of volatility targeting strategies of 10, 15 and 20 per cent is compared to equity and cash in Figure 4 below.
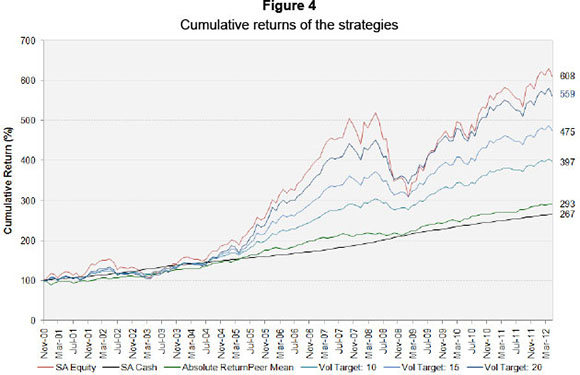
Note that we also consider an alternative strategy to avoid drawdowns and thus preserve capital. We therefore analyse the volatility targeting strategy relative to the peer mean of the Absolute Return funds in the South African setting. These funds typically have an investment objective of delivering inflation-linked returns, at least, but simultaneously preserving capital over rolling twelve month periods.
From Figure 4 we note the following. All the strategies have underperformed equity and outperformed cash. In addition, the volatility targeting strategies have outperformed the Absolute Return peer mean. However, we notice that these strategies have significantly higher drawdowns than the 'average' Absolute Return fund. The attractive characteristic of the Absolute Return peer mean is the consistency of the series. This series has very low drawdowns relative to the other strategies.
In Figure 5, below, we analyse these strategies on a risk-return chart.
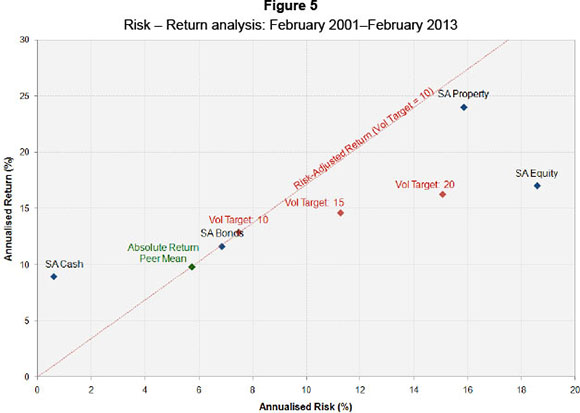
On a risk-return basis we note that the Absolute Return peer mean has delivered a return comparable to bonds at a relatively low risk. The volatility targeting strategies have delivered returns that are similar to South African bonds but at a meaningfully higher risk. Considering the volatility targeting strategies, the strategy targeting 10 per cent has the highest risk-adjusted return. The slope of the line through this point gives the risk-adjusted return of this strategy. Points above this line have a higher risk-adjusted return and vice versa. As can be seen on a risk-adjusted basis this strategy is inferior to the Absolute Return peer mean.
The motivation behind lower volatility is that such portfolios supposedly have lower drawdowns than the market. As a result they should be more likely to preserve capital than equities in the short term.
In Figure 6 we analyse the probability of these strategies delivering a negative 12 month return. In addition we also analyse the magnitude of such returns. This will help us understand, not only the probability of delivering negative returns, but also the magnitude of such negative returns.
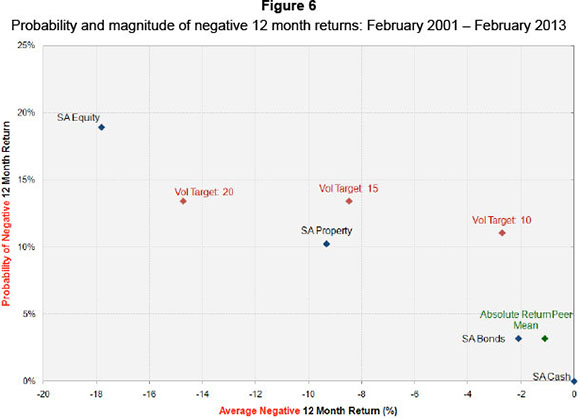
Equities have approximately 20 per cent probability of delivering a negative 12 month return. On average the magnitude of such a return is 18 per cent. On the other hand property has a 10 per cent probability of delivering a negative return, with an average magnitude of around -9 per cent.
The volatility targeting strategies have at least a 12 per cent probability of delivering a negative 12 month return (for the volatility target of 10 per cent). This probability is higher than that for property and bonds. This is one negative aspect of volatility targeting, especially for an investor targeting capital preservation (or seeking risk reduction). In addition the magnitude of such negative returns is at least 3 per cent (for the 10 per cent volatility target) and more than 8.5 per cent for the 15 per cent volatility target. This highlights the fact that volatility targeting as a strategy fails to avoid the drawdowns inherent in equity markets (although the drawdowns for the lower volatility target seem comparable to bonds).
In contrast the probability of a negative 12 month return for the average Absolute Return fund is less than 5.0 per cent p.a. This is a compelling finding that says the average Absolute Return fund will preserve capital at least 95 per cent of the time on a 12 month basis. In addition the magnitude of such negative returns is very low (lower than bonds). All in all, an investment in an average Absolute Return should preserve capital at least 95 per cent of the time. However, if there is a negative 12 month return it can be expected to be at most 2.0 per cent p.a. This renders itself as a compelling argument for Absolute Return investing as opposed to volatility targeting.
We conclude this section by comparing the Sharpe ratio of the different investment strategies described above in Table 1.
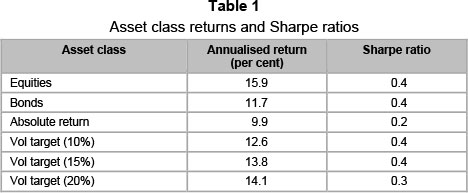
We note that the Sharpe ratio, calculated over the full period of the analysis, does not provide for a clear investment decision between the strategies - this provides further illustration for our preference of comparing the drawdown characteristics of the different strategies.
4 Conclusions and future research
We have examined the performance of volatility targeting strategies for the All Share index by making use of implied volatility as a signalling factor. We compared the performance of these strategies to the returns of traditional asset classes in the South African market including the Absolute Return peer universe.
Our analysis shows that the volatility target strategies outperform equity on a risk adjusted basis. Our analysis does indicate though, that one needs to be careful to consider these strategies as risk controls - the volatility control does not necessarily provide protection against the meaningful drawdowns in the equity market. We have made comparisons with bonds and the Absolute Return peer universe which provide a clear advantage from a risk management perspective. The volatility targeting strategies do, however, seem to capture more returns.
We have not performed work on volatility forecasts using historical index return series; we note that the FTSE/JSE Top40 risk target strategy relies on an exponential moving average methodology. This is clearly an area for interesting future research which should incorporate the stochastic nature of volatility as well as the accuracy of volatility forecasts in relation to conditional equity returns.
Another interesting area of research would be an investigation of protective strategies based on derivatives where the decision to protect would be based on a volatility control. This is an area that has not been investigated.
Acknowledgements
The authors wish to express their gratitude towards Dr Brett Dugmore from BNP-Paribas-Cadiz Securities as well as Emlyn Flint from Peregrine Securities for assistance with historical data.
The authors also wish to express their gratitude towards the comments and suggestions made by two anonymous referees that aided in the presentation and finalisation of this article.
References
BAILLIE, R.T. & DEGENNARO R.P. 1990. Stock returns and volatility. The Journal of Financial and Quantitative Analysis, 25(2):203-214. [ Links ]
BANERJEE, P.S., DORAN, J.S. & PETERSON, D.R. 2007. Implied volatility and future portfolio returns, Journal of Banking and Finance, 31:3183-3199. [ Links ]
BEKAERT, G. & WU, G. 2000. Asymmetric volatility and risk in equity markets. The Review of Financial Studies, 13(1):1-42. [ Links ]
BLACK, F. 1976. Studies of stock price volatility changes. Proceedings of the 1976 meeting of business and economics statistics section of the American Statistical Association, 27:399-418. [ Links ]
BOLLERSLEV, T. & ZHOU, H. 2006. Volatility puzzles: a simple framework for gauging return-volatility regressions. Journal of Econometrics, 131:123-150. [ Links ]
CHU C-SJ, SANTONI, G.J. & LIU, T. 1996. Stock market volatility and regime shifts in returns. Information Sciences, 94:179-190. [ Links ]
CONT, R. 2001. Empirical properties of asset returns: stylized facts and statistical issues. Quantitative Finance, 1:223-236. [ Links ]
COPELAND, M.M. & COPELAND, T.E. 1999. Market timing: Style and size rotation using the VIX, Financial Analysts Journal, 55(2):73-81. [ Links ]
DERMAN, E. 1999. Volatility regimes, RISK, 12(4):55-59. [ Links ]
DE ROSSI, G. & NAKISA, R. 2011. Understanding volatility targeting strategies, UBS Investment Research. [ Links ]
FLEMING, J., KIRBY, C. & OSTDIEK, B. 2003. The economic value of volatility timing using 'realized' volatility, Journal of Financial Economics, 67:473-509. [ Links ]
FRENCH, K.R., SCHWERT, G.W. & STAMBAUGH, R.F. 1987. Expected stock returns and volatility, Journal of Financial Economics, 19:3-29. [ Links ]
FTSE. August 2012. Ground rules of the management for the FTSE/JSE top 40 net risk target index series 2 Version 1.2. [ Links ]
GRAHAM, J.R. & HARVEY, C.R. 1996. Market timing ability and volatility implied in investment newsletters' asset allocation recommendations, Journal of Financial Economics, 42:397-421. [ Links ]
HARRISON, P. & ZHANG, H.H. 1999. An investigation of the risk and return relation at long horizons, Review of Economics and Statistics, 81:399-408. [ Links ]
JOOSTE, R. August 2012. Risk target indices. Available at: http://www.fm.co.za/fm/2012/08/24/risk-target-indices [accessed 2013-01-01]. [ Links ]
LI, Q., YANG, J., HSIAO, C. & CHANG, Y. 2005. The relationship between stock returns and volatility in international stock markets. Journal of Empirical Finance, 12:650-665. [ Links ]
MALZ, A.M. 2000. Do implied volatilities provide an early warning of market stress? RiskMetrics Journal, 1:41-60. [ Links ]
POON, S-H. & GRANGER, C.W.J. 2003. Forecasting volatility in financial markets: A review. Journal of Economic Literature, 41(2):478-539. [ Links ]
POTERBA, J.M. & SUMMERS, L.H. 1986. The persistence of volatility and stock market fluctuations. The American Economic Review, December 1986, 76(5):1142-1151. [ Links ]
RIBEIRO, R. & DI PIETRO, V. 2008. Volatility signals for asset allocation. JP Morgan Investment Strategies, 51. [ Links ]
WHITELAW, R. 2000. Stock market risk and return: an empirical equilibrium approach. Review of Financial Studies, 13:521-547. [ Links ]
Accepted: July 2014

