


Servicios Personalizados
Articulo
 Inglés (pdf)
 Articulo en XML
 Referencias del artículo
Indicadores

Links relacionados
-
 Citado por Google
 -
 Similares en Google
Compartir

 Permalink
South African Journal of Economic and Management Sciences
versión On-line ISSN 2222-3436
versión impresa ISSN 1015-8812
S. Afr. j. econ. manag. sci. vol.17 no.5 Pretoria 2014
ARTICLES
The association between the seven elements of the black economic empowerment score and market performance
Cara Maria van der MerweI; Petri FerreiraII
IDepartment of Financial Accounting, University of South Africa
IIDepartment of Financial Accounting, University of Pretoria
ABSTRACT
The black economic empowerment (BEE) score consists of seven elements, namely ownership, management control, employment equity, skills development, preferential procurement, enterprise development and socio-economic development. The purpose of this study is to establish whether an association exists between an entity's BEE elements and its share returns in the short term. Based on prior literature, it appears that the market reacts positively to an announcement of a BEE deal, although the literature also indicates that an entity's BEE score, which includes all seven elements of the BEE score, bears a negative relationship to its share returns. Therefore the association between the various BEE elements and share returns needs to be investigated. The study uses a multivariate regression analysis that controls for factors influencing share returns. The study includes the BEE element data as obtained from the survey of the top empowerment companies carried out by Empowerdex/Financial Mail for the period 2005 to 2011. The results of this study indicate that a significant positive association exists between the management control element of the BEE score and the entity's share returns. Furthermore, a significant negative association exists between the ownership and preferential procurement elements of an entity and its share returns. This study contributes to the literature on BEE in the accounting and finance field in South Africa as well as enhances the understanding and effect of BEE compliance through implementation of the generic scorecard as required by the 2007 codes of good practice. The results of this study would be of interest to government policy analysts, investors and managers.
Key words: black economic empowerment; BEE; BEE elements; ownership element; management control; preferential procurement; share returns
1 Introduction
Since 1994 one of the key objectives of the South African government has been the transformation of the economy through the redress of historical inequalities. During the apartheid era, great social and economic imbalances existed between black1 and white people. Black people were explicitly excluded from economic participation, and were also denied the right to economic and intellectual growth through various destabilisation mechanisms (Jack & Harris, 2007). The government has developed a focused strategy and comprehensive plan to restore the imbalances that are unique to South African history by the implementation of the Broad-Based Black Economic Empowerment Act 53 of 2003 (B-BBEE Act). A number of years have passed since the adoption of BEE2 and there is still no certainty as to what the real benefits and disadvantages are.
BEE is broadly defined by the government in their BEE strategy document as 'an integrated and coherent socio-economic process that directly contributes to the economic transformation of South Africa and brings about significant increases in the number of black people that manage, own and control the country's economy, as well as significant decreases in income inequalities' (DTI, 2003). The importance of BEE compliance for companies and organisations within South Africa is visible through the public disclosure of their BEE status. Such disclosures are published on company websites, or take the form of advertisements, email disclaimers or information notices.
A BEE score is calculated on the basis of the generic scorecard included in the codes of good practice.3 The BEE score consists of seven elements, namely ownership, management control, employment equity, skills development, preferential procurement, enterprise development and socio-economic development (South Africa, 2007). The essence of BEE therefore lies in these seven elements.
The Department of Trade and Industry (DTI) released a revised code of good practice in 2013 (South Africa, 2013). It is therefore evident that BEE in its current format is not operating at an optimum level. One of the reasons could be the fact that there is not enough, if any, financial incentive for a company to be BEE compliant. If the negative elements of the BEE score are identified, government policy analysts could take these elements into account to create sustainable transformation policies.
The purpose of this study is therefore to investigate the association between the seven elements of the BEE score and companies' future share returns. This study identifies the positive and negative association of the elements comprising the BEE score with future share returns. Through identification of the positive and negative elements of the BEE mechanism, government policy decision makers can further investigate, modify or alter the negative elements and companies can choose to make further investments in the positive elements, which generate shareholder wealth.
BEE deal announcements have a positive effect on companies' share prices in the short term (Alessandri, Black & Jackson, 2011; Jackson, Alessandri & Black, 2005; Strydom, Christison & Matias 2009; Ward & Muller, 2010; Wolmarans & Sartorius, 2009). However, a study done by Ferreira and De Villiers (2011) found a negative association between companies' BEE scores and their share returns in the short term. A multivariate regression analysis based on the model by Fama and French (1998) is applied.
This study contributes to the BEE literature in the finance and accounting field and provides empirical evidence of the association of the BEE elements as included in the generic scorecard with future share returns. The remainder of the article is structured as follows: a literature review, which is followed by a discussion of the research design, and then the results and conclusion.
2 Literature review
In the first democratic elections in South Africa in 1994 the African National Congress (ANC) was elected as the ruling party. The ANC has a clear mandate to address the inequalities of the past, specifically in respect of the black and other previously disadvantaged communities. Section 9 of the B-BBEE Act allows the codes of good practice of 2007 (hereafter the codes) to provide further guidance on BEE and puts the practicalities of BEE in context. The objective of the codes is to create a framework for measuring BEE compliance (South Africa, 2003). This has been done by standardising the definitions, allocating weightings to the seven elements and setting targets to achieve BEE compliance. The generic scorecard included in the codes is the instrument used to measure a company's level of commitment towards BEE.
Although there are various reasons and motivations as to why a company would elect to be BEE complaint, the reasons could be combined into the following two main categories as indicated by Ferreira and De Villiers (2011):
1) The desire to be socially responsible by correcting the inequalities of the past.
2) Economic profits as a result of the preferential business treatment afforded to BEE-compliant entities in South Africa.
2.1 The seven BEE elements
The generic scorecard in terms of the codes has seven elements, which comprise the total BEE score and their weightings, totalling 100, are set out as follows:
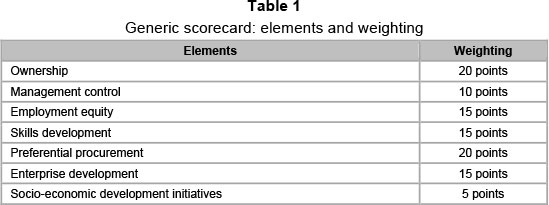
As explained by Jack and Harris (2007), the ownership element is not about freely giving black people shares but about exposing black people to the economic substance of ownership. The ownership element consists of three categories, namely voting rights, economic interest and realisation points. The management element consists of two categories, namely board participation and top management. The employment equity element relates to the percentage of black employees, taking gender into account, on a senior, middle and junior management level. The percentage of black, disabled employees is also a compliance category.
The skills development element includes two categories, namely skills development spending on learning programmes and learner-ships. The difference between these two indicators is that skills development spending measures the monetary contribution and learnerships measure the number of participants (South Africa, 2007).
Preferential procurement refers to the purchasing of goods and services from preferred suppliers. The status of suppliers as preferred suppliers is measured by their BEE status. For entities that do business with the government or depend on government licences for business, it is crucial to have a high BEE score. Furthermore, even if an entity does not directly do business with the government, the preferential procurement element influences any business operation in South Africa to increase its procurement spending from BEE suppliers in order to influence its own BEE score. This is known as the trickledown effect (Jack & Harris, 2007). The framework of the code includes procurement recognition levels for BEE-compliant entities. A level one contributor, a company with 100 points or more on the scorecard, will have a procurement recognition level of 135 percent. Eight levels of contributors exist and a non-compliant contributor is an entity with less than 30 points on the generic scorecard, which results in a zero (0) percent procurement recognition level (South Africa, 2007). Jack and Harris (2007) notes that the preferential procurement element is the driver of the BEE process as it enhances the need for BEE and creates real BEE commitment.
Enterprise development is incorporated into the BEE score as it gives black people an opportunity to develop businesses. Furthermore it is likely to result in long-term sustainability of black economic participation as it encourages entrepreneurship and generates black capital (Jack & Harris, 2007). The socio-economic development element could consist of monetary or non-monetary contributions actually applied with the specific objective of facilitating sustainable access to the economy (South Africa, 2007).
2.2 BEE studies in accounting and finance
The majority of studies in the accounting and finance discipline relate to the BEE deal announcement. Strydom, Christison and Matias (2009) did an event study on the market reaction to the announcement of 254 BEE transactions between 1996 and 2006. They found a positive, insignificant, market reaction to the announcement of BEE transactions, though they are of the opinion that the positive relationship may relate to firm-specific or transaction-specific features. Wolmarans and Sartorius (2009) came to the conclusion that BEE announcements have a positive impact on shareholder wealth, but their event study results were only significantly positive in 2006. Ward and Muller (2010) arrived at a similar conclusion. In general BEE announcements have a positive effect, in that share returns reach a peak cumulative abnormal return of 10 percent, 180 days after the announcement date. This event study was conducted between 2000 and 2008.
Furthermore the announcement of a BEE transaction is associated on average with positive three-day and five-day cumulative abnormal returns. Firms that engaged in BEE deals outperformed the market index by 30.76 percent over the one-year period immediately after the BEE transaction announcement in the period 1996 to 1998 (Jackson, Alessandri & Black, 2005). In addition, Alessandri, Black and Jackson (2011) investigated the motivations behind BEE transactions between 1993 and 2005 and suggested that the announcement of sincere BEE transactions, perceived as a corporate social responsibility initiative, creates value for companies. They further found that BEE deals that were conducted at a discount attracted significant positive shareholder returns and that BEE deals concluded at a premium attracted significant negative average shareholder returns. The market responses indicate that the market rewards firms that engage in BEE deals.
Ferreira and De Villiers (2011) present evidence of a significant negative relationship between companies' BEE score and the share return over a one-year period. Their study was conducted on the total BEE score and not only an element thereof, using 594 firm years from 2005 to 2008.
Van Heerden (2011) compared the financial performance measures of 49 JSE listed companies with BEE scores, with the sector indices and with each other. On average, sector indices exceeded the performance of companies with high BEE scores.
In a survey done by Sartorius and Botha (2008) which included 72 companies from 1999 to 2005, only 17 companies transferred 25 percent or more of their equity to BEE partners. The compliance target percentage required in terms of the codes for the ownership element is 25 percent black shareholding. The authors further noted that as the majority of companies do not comply, it is expected that more BEE deals will be witnessed in the future or it may be expected that entities will invest more in the other elements contributing to the BEE score.
2.3 Corporate social responsibility
BEE can be viewed as a form of corporate social responsibility based on the fact that the inequalities of the past under the apartheid regime are being rectified. Sartorius and Botha (2008) found that the main reason why companies implement a BEE ownership initiative is that BEE is essential for South Africa to sustain its economic and democratic structures, in other words to be socially responsible. Other common reasons were value creation and the fact that companies are committed to the principles of BEE.
The frequency and levels of corporate social responsibility reporting in South African companies were significantly higher than those of the Fortune Global 100 companies during 2006. The high level of reporting on diversity policies and programmes in South African companies compared to other companies is influenced by the BEE requirements (Dawkins & Ngunjiri, 2008). While 91 percent of the South African population is represented by black4 people (Statistics South Africa, 2011), only 36 percent of the company's boards are black representative and only 16 percent of the executive directors are black representative (Empowerdex, 2011a). Therefore uplifting and developing the majority of the population through BEE is a method of being socially responsible.
A significant positive association exists between BEE performance and the voluntary disclosure of a value-added statement. This positive association suggests that a value-added statement is a method used by South African companies to establish legitimacy with labour (Cahan & Van Staden, 2009). The finding emphasises the importance of being socially responsible by following the principles of BEE.
In the words of Davis (1973), the risk for South African companies is that if entities do not choose to be socially responsible they will 'gradually sink into customer and public disfavour'. From a social responsibility perspective South African companies may benefit by being BEE compliant.
2.4 Contribution
This study contributes to the literature on BEE in South Africa by investigating the association between the share return and the seven elements that comprise the BEE score individually instead of investigating them in aggregate or investigating the BEE deal announcement. No specific previous studies were conducted on the BEE elements' association with share returns. Furthermore, this study contributes to the literature on corporate social responsibility in South Africa.
3 Research design
3.1 Hypotheses
Previous research examined the relationship between a company's BEE score and the company's future share returns. The purpose of this study is to investigate the association between the seven BEE elements that comprise the BEE score and the company's future share returns.
Every element of the BEE score has costs associated with it (Van Wyk, Dahmer & Custy, 2004). These costs may include:
-
ownership - providing discounts to black shareholders when issuing shares
-
management control and employment equity - implementing suboptimal strategies, hiring incompetent personnel, providing additional training and development programmes, skilled black employees are usually acquired at a premium
-
skills development - additional training to develop black employees
-
preferential procurement - purchasing substandard products or obtaining unsatisfactory services from BEE suppliers, acquiring products or services at a premium
-
enterprise and socio-economic development - direct costs relating to the compliance targets to be met.
The benefits of BEE compliance include greater market access due to the acquisition of licences for business operations, greater government procurement opportunities and an enhanced reputation for social responsibility. These benefits lead to increased revenues and profits, which in turn results in higher share prices and share returns (Ferreira & De Villiers, 2011).
It should be borne in mind that the concerns about and arguments against BEE might influence the market reaction towards BEE. Esser and Dekker (2008) state that BEE can place an unnecessary burden on companies in that they are obliged to comply with the applicable requirements. Compliance with BEE requirements is costly (Van Wyk, Dahmer & Custy, 2004). Other authors argue that BEE discourages foreign investments and is a risk to investor confidence (Ponte, Roberts & Van Sittert, 2007; Southall, 2007). The exodus of skilled whites from the country along with the limited pool of black talent creates a skills shortage problem (Horwitz & Jain, 2011). The upliftment of only the black elite is another argument against BEE compliance (Jack & Harris, 2007; Tangri & Southall, 2008).
The starting point is an examination of the association between the total BEE score and share returns. The hypothesis used follows the study by Ferreira and De Villiers (2011) which examined the relationship between the BEE score and share returns. The first hypothesis, stated in alternative form, is based on previous literature and is as follows:
H1. The higher the BEE score the lower the future share returns for the company.
A number of studies have been done on the BEE deal announcement (Alessandri, Black & Jackson, 2011; Jackson, Alessandri & Black, 2005; Strydom, Christison & Matias 2009; Ward & Muller, 2010; Wolmarans & Sartorius, 2009). These studies have shown that the market's perception of the BEE deal announcement, representing the ownership element, is positive. A BEE deal announcement results in an increase in ownership by black people in a company through issuing shares. The increased ownership by black people therefore results in an increase in the ownership element of the BEE score. BEE deal announcement studies therefore relate to the ownership element of the BEE score. Although this study covers a longer time period than the previous studies, there is no reason to believe that the market's perceptions have changed.
The previous studies on the BEE deal announcement, representing the ownership element, were event studies whereas this study is an association study. Therefore, for the ownership element we predict the following hypothesis, stated in the alternative form:
H2. The higher the BEE ownership element score the higher the future share returns for the company.
The BEE score consists of seven BEE elements, namely ownership, management control, employment equity, skills development, preferential procurement, enterprise development and socio-economic development. Previous research has found evidence of a negative relationship between the total BEE score and future share returns. The BEE deal announcement (ownership element) however suggests a positive market reaction. The existence of a positive BEE element and an overall negative BEE relationship with market performance indicates that positive and negative elements exist. A single element could drive the negative correlation between the BEE score and share returns, as postulated by Ferreira and De Villiers (2011). On the other hand, there might be a mixture of negative elements, which could indicate that the BEE score might be a proxy for other social and economic issues in South Africa.
The benefit versus cost contention is applicable to each element. Each element has associated costs which can be greater than the benefits of being BEE compliant. No other specific BEE element and market performance studies were conducted. Therefore, no specific predictions regarding the associations of the remaining BEE elements with share returns can be made. The following hypothesis, stated in alternative form for the remaining six elements, is:
H3. The BEE management control, employment equity, skills development, preferential procurement, enterprise development and socioeconomic development element score has either a positive or a negative association with the future share returns for the company.
BEE compliance results in increased market access as well as an enhanced reputation for social responsibility and this leads to increased sales and profits. When these benefits exceed the associated costs, a positive association with share returns exists. The counter-argument also holds good, with a resulting negative relationship.
3.2 Research method
This study follows a quantitative approach with positive theories to identify the association between the seven elements of the BEE score and share returns. Positive theories seek to explain and predict, rather than prescribing a specific method or approach (Deegan, 2009).
Firstly, the association between the overall BEE score and future share returns of a company is tested to determine the effect of the extended period used in this study. Future share returns are the dependent variable and the overall BEE score is the independent variable. Fama and French (1998) found that future share returns are associated with firm size, book-to-market ratio and earnings-to-price ratio. These variables control for factors relating to size, growth and risk. Abdo and Fisher (2007) also used annual share returns, market-to-book value and the price-to-earnings ratio to test the impact of corporate governance disclosures on the financial performance of JSE listed companies. Ferreira and De Villiers (2011), Van Heerden (2011), and Abdo and Fisher (2007) controlled for the industry in which the entity operates. Based on these studies, the following ordinary least squares regression is used:

A multivariate regression analysis is used to test the association between the seven BEE elements and future share returns of companies. The BEESCORE above is therefore divided into the seven elements for the purposes of the second multivariate regression. The following multivariate regression is used to test hypotheses two and three (H2 and H3):

The variables used in the regressions are explained as follows:
- SR represents share returns over a one-year period, after taking a four-month lag period into account.
- BEESCORE represents the overall BEE score as provided in the annual Financial Mail/ Empowerdex ranking.
- BEEOWN represents the BEE ownership element score as a percentage of the score provided in the annual Financial Mail/ Empowerdex ranking.
- BEEMGT represents the BEE management control element score as a percentage of the score provided in the annual Financial Mail/Empowerdex ranking.
-ΒΕΕEE represents the BEE employment equity element score as a percentage of the score provided in the annual Financial Mail/Empowerdex ranking.
- BEESKILLS represents the BEE skills development element score as a percentage of the score provided in the annual Financial Mail/Empowerdex ranking.
- BEEPP represents the BEE preferential procurement element score as a percentage of the score provided in the annual Financial Mail/Empowerdex ranking.
- BEEENTRPSE represents the BEE enterprise development element score as a percentage of the score provided in the annual Financial Mail/Empowerdex ranking.
- BEESEC represents the BEE socio-economic development element score as a percentage of the score provided in the annual Financial Mail/Empowerdex ranking.
- Size represents the natural log of market capitalisation at the beginning of the share period as an indicator of firm size.
- EP represents the earnings-to-price ratio at the beginning of the share return period.
- BM represents the book-to-market ratio at the beginning of the share return period.
- (IND) represents the industry in which the firm trades. A dummy variable one or zero is used.
- E represents the error term.
The developmental stage of the codes, 2005 and 2006, also prescribed the seven elements, as in the codes of 2007, but the weightings allocated to the elements differed slightly from those in the codes of 2007. In order to avoid influencing the inferences drawn from the study, the variation in weightings and weighting allocated to each element during the sample period needs to be controlled for. To eliminate the weighting effect of the elements, each element will represent the percentage scored per element. The score per element as obtained from the top empowerment rankings was divided by the weighting allocated. The result of this calculation is that each element counts out of 100 (a percentage) throughout the period. Percentages, and not scores, are therefore compared throughout the period. The BEE elements are variables that change continuously throughout the year and the use of a regression analysis mitigates the risk of the moving BEE target (Ferreira & De Villiers, 2011).
3.3 Data
BEE score and element data for seven years (2005 to 2011)5 were obtained from the Financial Mail and Empowerdex website (Empowerdex, 2011b). The companies are scored on the basis of the BEE generic scorecard as included in the codes. A higher value indicates higher BEE performance. The top empowerment companies are announced in April each year. It should be noted that the accuracy of the BEE score falls outside the scope of this study. This study investigates the association between the BEE score and future share returns, not the accuracy of the BEE score. Furthermore, the DTI gazetted the Broad-Based Black Economic Empowerment Amendment Bill of 2011 which, amongst other matters, introduces penalties for circumventions (DTI, 2011).
Adjusted annual share prices were obtained from McGregor BFA to calculate the share returns of the companies over a one-year period. The one-year period ends four months after the announcement of the top BEE companies. Taking into account that the top BEE companies are announced in Aprilt every year, the annual share returns are calculated as Augustt - Augustt-1 in August each year. Augustt - Augustt-1 are used because the information relating to the elements of the BEE score is available during the year. Accordingly, the market imputes some of the benefits and costs relating to the BEE elements into the share price continuously throughout the year.
The share price needs to reflect the costs and benefits associated with the BEE elements, therefore a four-month period after the announcement was used. Ferreira and De Villiers (2011) tested the four-month lag period to a one-month lag period, and found that the one-month lag period provided results at lower significance levels; the four-month period therefore suggests that the market had sufficient time to incorporate the costs and benefits associated with the announcement of the BEE elements. Contributing to the literature the study tests the relationship between the score of the BEE elements for the year and the share price information for the year, with a four-month lag.
All the control variables were obtained from the McGregor BFA database (McGregor BFA, 2012). All the control variables were winsorised at one percent, to avoid the effect of spurious outliers on the inferences.6 All original values outside one and 99 percent of the distribution is replaced with the value of the 1st or 99th percentile. Thereby outliers are not rejected, but rather replaced (Tukey, 1962).
Companies which delisted before 31 August 2011 were eliminated from the sample.7 The last date for which market information is required is 31 August 2011. Companies for which no market data could be obtained from McGregor BFA and companies with no BEE score and element data were also eliminated from the sample. The final sample comprised 905 firm-years for the seven-year period, 2005 to 2011.
4 Detailed findings
This study investigates the association between a company's BEE elements and its share returns. However, following previous research, the study firstly examines the association between the company's total BEE score and its share returns. The descriptive statistics, correlation coefficients and regression results will be discussed firstly for the total BEE score relationship and thereafter for the BEE element relationship with future share returns in the short term.
4.1 Results - BEE score
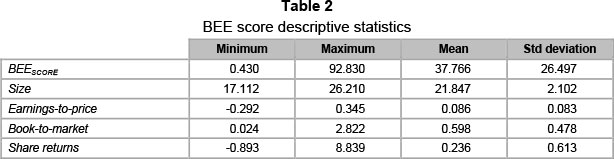
The descriptive statistics (Table 2) for the BEE score data indicate the minimum BEE score as 0.430, the maximum score as 92.830 and the mean score of 37.766. In both the Pearson and Spearman correlations (untabulated) the BEE score is significantly and negatively related to share returns at the one percent level. This agrees with the significant negative association between the BEE score and share returns as found by Ferreira and De Villiers (2011). These correlations indicate that the higher the BEE score of an entity the lower the share returns.
The ANOVA table generated an F-stat of 4.448, significant at the one percent level, and the coefficient of determination (R2) is six percent (5.6 percent) which is acceptable. The R2 is acceptable as the study does not aim to predict or explain the future share returns, but rather investigates the association between the share returns and the BEE score of a company. Brown, Lo and Lys (1999) also notes that the explanatory power of specifically returns models is generally low and the R2 is also similar to the Ferreira and de Villiers (2011) study which indicated a coefficient of determination of six percent (6.2 percent).
The regression results (Table 3) for H1 provide evidence that the BEE score is negative and significantly (one percent level) related to share returns. This finding supports H1 and agrees with prior literature. The higher an entity's BEE score the lower the share returns in the short term. The costs relating to BEE compliance exceed the benefits of being BEE compliant for the period 2005 to 2011. This study indicates that the longer time period used in the study does not affect the relationship between a company's BEE score and share returns. The variance inflation factors (VIF) are far below the suggestive levels of multicollinearity.
4.2 Results - BEE elements
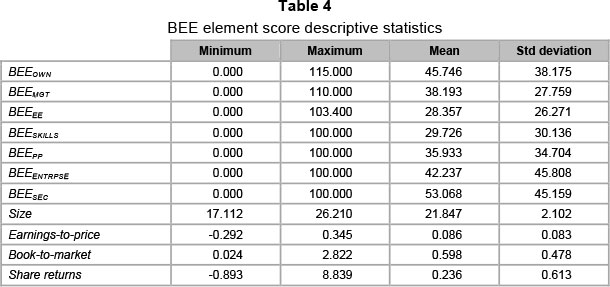
Table 4 presents the descriptive statistics for data on the BEE elements for the period 2005 to 2011. From the means it is clear that companies perform best in the socio-economic development element and the employment equity element is the element of the BEE score with the lowest score. The maximum scores for some elements are above 100, the reason being that these elements, ownership, management control and employment equity, carry bonus points as per the generic scorecard, which raises the score per element to above 100.
The Pearson and Spearman correlations (untabulated) between the variables for the BEE elements indicate that the BEE ownership element, preferential procurement, enterprise development and socio-economic development elements are significantly negatively correlated with share returns using the Pearson correlations. The Spearman correlation on the BEE ownership element and preferential procurement elements are significantly negatively correlated with share returns. All correlations are significant at the one percent level, except for the enterprise development element which is significant at the five percent level. This might indicate that the higher the BEE element scores of the ownership element, preferential procurement, enterprise development and socioeconomic development elements, the lower the share returns of the company.
The ANOVA table generated an F-stat of 4.275, significant at the one percent level, and the coefficient of determination (R2) is eight percent, which is acceptable, similar to the BEE score testing. The variance inflation factors (VIF) are again far below the suggestive levels of multicollinearity.
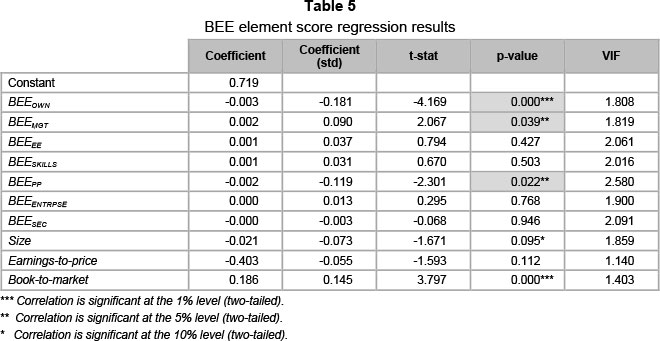
Table 5 presents the regression results for H and H3 and yields the following findings: the BEE ownership, management control and preferential procurement elements are significantly associated with share returns. For the other elements, namely employment equity, skills development, enterprise development and socio-economic development, no significant association exists with share returns, and therefore no conclusion can be drawn relating to these elements in the short term for the period 2005 to 2011. The null hypothesis for H3 is accepted.
A strongly significant (one percent level) negative association exists between the BEE ownership element and share returns in the short term. The second hypothesis stated in the alternative form (H2) is not supported by the evidence, as there is a negative association and not a positive association as predicted in the hypothesis. This evidence indicates that the costs relating to the BEE ownership element exceeds the benefits of being BEE compliant. Costs include the issuance of shares at a discount to new black shareholders in order to increase BEE scores and indirectly the possible loss of local and foreign investors. This strongly significant negative element might be the driver of the negative association between the BEE score and company share returns in the short term.
The negative relationship between the ownership element and share returns is in contrast with the findings of prior literature on BEE deal announcements which relate to the ownership element. Previous studies were event studies and only two of the prior studies calculated share returns over a one-year period, namely those of Ward and Muller (2010) and Jackson, Alessandri and Black (2005). These contradictory findings in the literature are surprising but also very interesting. The market reacts positively to the BEE deal announcement when the announcement is made but the actual association between the BEE ownership element score and share returns over a one-year period is negative.
The previous studies on the ownership element (BEE deal announcements) relate mainly to periods prior to 2006 and only a single study was conducted up to 2008 (Ward & Muller, 2010). The present study relates to the period 2005 to 2011. One possible conclusion is that the BEE deal announcements relating to the ownership element were perceived as positive by the market at inception and/or adoption of the newly accepted BEE concept, but that a few years into BEE compliance the perceptions of the market might have changed.
The BEE management control element is significantly (five percent level) positively associated with share returns. Benefits emanating from this element include the representation of black directors at board and top management level, leading to increased market access and a socially responsible reputation. In turn, these benefits lead to increased revenues and profits, thereby boosting the share price and share returns of the company. This finding confirms the need to train and develop black directors as their association with the company creates benefits flowing towards the entity.
A significant (five percent level) negative association exists between the BEE preferential procurement element and share returns in the short term. This indicates that the higher an entity's BEE preferential procurement score the lower the share returns. The preferential procurement element motivates BEE compliance in South Africa (trickledown effect). These products or services may be acquired at a premium and/or may be substandard products or services, which in turn results in increased financial expenditure and negatively impacts the effectiveness of an entity. Furthermore, entities might need to change previously efficient suppliers to new BEE suppliers and this can lead to increased inefficiencies leading to higher costs. The costs relating to the BEE preferential procurement element exceed the benefits of BEE compliance.
5 Conclusion
BEE compliance is an on-going process and a very prominent topic in the South African economic environment. BEE compliance is regulated by the generic scorecard originating from the codes of good practice of 2007. The BEE score consists of seven elements, namely ownership, management control, employment equity, skills development, preferential procurement, enterprise development and socioeconomic development.
The purpose of this study is to investigate the association between the seven elements of the BEE score and companies' future share returns. An association study following a multivariate regression based on the F ama and French (1998) model as well as controlling for factors and insights from other similar studies is used in this study (Alessandri, Black & Jackson, 2011; Ferreira & De Villiers, 2011; Jackson, Alessandri & Black, 2005; Strydom, Christison & Matias 2009; Van Heerden, 2011; Ward & Muller, 2010; Wolmarans & Sartorius, 2009). Previous literature has found a negative association between the BEE score and future share returns in the short term (Ferreira & De Villiers, 2011). However, the ownership element, one of the seven elements, is perceived by the market as positive on the BEE deal announcement date (Alessandri, Black & Jackson, 2011; Jackson, Alessandri & Black, 2005; Strydom, Christison & Matias 2009; Ward & Muller, 2010; Wolmarans & Sartorius, 2009).
The results of this study suggest that there is a significant negative relationship between the ownership element as well as the preferential procurement element and share returns. The costs relating to BEE compliance for these two elements exceed the benefits of being BEE compliant in the short term. The evidence relating to the ownership element does not bear out the findings of prior literature relating to this element. The difference might relate to the use of different research methodologies as well the investigation of different time periods. On the other hand, the BEE management control element is positively associated with share returns in the short term, which indicates that the benefits relating to the management control element exceed the costs of this element.
It is important to note that this study relates to the period 2005 to 2011 and furthermore tests the association between the BEE elements and share returns in the short term. The longterm effect of BEE compliance as well as the optimal BEE element score are areas for future research (Ferreira & De Villiers, 2011). The reasons for the positive and negative associations can be investigated in more depth along with a consideration of other non-financial benefits surrounding BEE compliance. There could be other reasons for being BEE compliant and investing in certain BEE elements, such as managerial self-interest, avoidance of political pressures and costs (Watts & Zimmerman, 1978). These motivations are not considered in this study, and could be explored in future research.
The DTI released a revised code of good practice in 2013. The revised codes broaden the scope and increase the compliance levels of BEE (South Africa, 2013). This study relates to some of the key changes in the revised codes.
BEE is a crucial and integral part of the new South Africa, and the success of the policy can only be achieved by embracing, challenging and contributing to the process. This study contributes to the BEE literature in the finance and accounting field and provides evidence of the association of the BEE elements as included in the generic scorecard with future share returns.
References
ABDO, A. & FISHER, G. 2007. The impact of reported corporate governance disclosure on the financial performance of companies listed on the JSE. Investment Analysts Journal, 66:43-66. [ Links ]
ALESSANDRI, T.M., BLACK, S.S. & JACKSON, W.E. 2011. Black economic empowerment transactions in South Africa: Understanding when corporate social responsibility may create or destroy value. Long Range Planning, 44(4):229-249. [ Links ]
BROWN, S., LO, K. & LYS, T. 1999. Use of R2 in accounting research: Measuring changes in value relevance over the last four decades. Journal of Accounting and Economics, 28(2):83-115. [ Links ]
CAHAN, S.F. & VAN STADEN, C.J. 2009. Black economic empowerment, legitimacy and the value added statement: Evidence from post-apartheid South Africa. Accounting and Finance, 49(1):37-58. [ Links ]
DAVIS, K. 1973. The case for and against business assumption of social responsibilities. Academy of Management Journal, 16(2):312-322. [ Links ]
DAWKINS, C. & NGUNJIRI, F.W. 2008. Corporate social responsibility reporting in South Africa: A descriptive and comparative analysis. Journal of Business Communication, 45(3):286-307. [ Links ]
DEEGAN, C.M. 2009. Financial accounting theory (3rd ed.) Australia: McGraw-Hill Australia. [ Links ]
DTI (DEPARTMENT OF TRADE AND INDUSTRY). 2003. South Africa's economic transformation: A strategy for broad-based black economic empowerment. Available at: http://www.dti.gov.za/economicempowerment/beecodes.jsp [accessed 2012-09-24]. [ Links ]
DTI (DEPARTMENT OF TRADE AND INDUSTRY). 2011. Trade and Industry Minister gazetted the B-BBEE Amendment Bill. Available at: http://www.thedti.gov.za/editmedia.jsp?id=2309 [accessed 2012-03-16]. [ Links ]
EMPOWERDEX. 2011a. Ownership cannot be the only aspect of transformation. Available at: http://www.empowerdex.co.za/RESEARCH/ResearchArchive/tabid/192/Default.aspx [accessed 2012-03-28]. [ Links ]
EMPOWERDEX. 2011b. Top BEE Companies 2011. Available at: http://www.empowerdex.com/RESEARCH/TopBEECompanies/tabid/193/Default.aspx [accessed 2012-03-21]. [ Links ]
ESSER, I. & DEKKER, A. 2008. The dynamics of corporate governance in South Africa: Broad based black economic empowerment and the enhancement of good corporate governance principles. The Journal of International Law and Technology, 3(3):157-169. [ Links ]
FAMA, E.F. & FRENCH, K.R. 1998. Value versus growth: The international evidence. The Journal of Finance, 53(6):1975-1999. [ Links ]
FERREIRA, P. & DE VILLIERS, C. 2011. The association between South African listed companies' BEE scores and market performance: An introductory study. Meditari Accountancy Research, 19(1/2):22-38. [ Links ]
HORWITZ, F.M. & JAIN, H. 2011. An assessment of employment equity and broad based black economic empowerment developments in South Africa. Equality Diversity and Inclusion: An International Journal, 30(4):297-317. [ Links ]
JACK, V. & HARRIS, K. 2007. Broad-based BEE: The complete guide (1st ed.) Johannesburg: Frontrunner Publishing. [ Links ]
JACKSON, W.E. III, ALESSANDRI, T.M. & BLACK, S.S. 2005. The price of corporate social responsibility: The case of black economic empowerment transactions in South Africa. Working Paper Series No. 29, Federal Reserve Bank of Atlanta, Atlanta. [ Links ]
McGREGOR BFA. 2012. Available at: www.mcgregorbfa.com/data [accessed 2012-07-06, [ Links ] 2012-07-30, 2012-07-31, 2012-08-07 and 2012-08-13].
PONTE, S., ROBERTS, S. & VAN SITTERT, L. 2007. Black economic empowerment, business and the state in South Africa. Development and Change, 38(5):933-955. [ Links ]
SARTORIUS, K. & BOTHA, G. 2008. Black economic empowerment ownership initiatives: A Johannesburg stock exchange perspective. Development Southern Africa, 25(4):437-453. [ Links ]
SOUTH AFRICA. 2003. Broad-based black economic empowerment Act no 53 of 2003, Government Gazette 25899, 9 January 2004, Pretoria: Government Printer. [ Links ]
SOUTH AFRICA. 2007. Broad-based black economic empowerment codes of good practice, Government Gazette 29617, 9 February 2007, Pretoria: Government Printer. [ Links ]
SOUTH AFRICA. 2013. Broad-based black economic empowerment Act (53/2003): Issue of codes of good practice, Government Gazette 36928, 11 October 2013, Pretoria: Government Printer. [ Links ]
SOUTHALL, R. 2007. Ten propositions about black economic empowerment in South Africa. Review of African Political Economy, 34(111):67-84. [ Links ]
STATISTICS SOUTH AFRICA. 2011. Mid-year population estimates 2011. Available at: http://www.statssa.gov.za/publications/P0302/P03022011.pdf [accessed 2012-03-28]. [ Links ]
STRYDOM, B., CHRISTISON, A. & MATIAS, J. 2009. An empirical investigation of the effect of black economic empowerment transactions on share prices: 1996-2006. African Journal of Accounting, Economic, Finance and Banking Research, 5(5):67-76. [ Links ]
TANGRI, R. & SOUTHALL, R. 2008. The politics of black economic empowerment in South Africa. Journal of Southern African Studies, 34(30):699-716. [ Links ]
TUKEY, J.M.1962. The future of data analysis. The Annals of Mathematical Statistics, 33(1):1-67. [ Links ]
VAN HEERDEN, J.H. 2011. Contribution of broad-based black economic empowerment to the financial performance of companies listed on the JSE during a recession. Unpublished Master's of Business Administration research report, Gordon Institute for Business Science, University of Pretoria, Gauteng, South Africa. [ Links ]
VAN WYK, J., DAHMER, W. & CUSTY, M.C. 2004. Risk management and the business environment in South Africa. Long Range Planning, 37(3):259-276. [ Links ]
WARD, M. & MULLER, C. 2010. The long-term share price reaction to black economic empowerment announcements on the JSE. Investment Analysts Journal, 71:27-36. [ Links ]
WATTS, R.L. & ZIMMERMANN, J.L. 1978. Towards a positive theory of the determination of accounting standards. The Accounting Review, 53(1):112-134. [ Links ]
WOLMARANS, H.P. & SARTORIUS, K. 2009. Corporate social responsibility: The financial impact of black economic empowerment transactions in South Africa. South African Journal of Economic and Management Sciences, 12(2): 180-193. [ Links ]
Accepted: April 2014
Endnotes
1 'Black people' is a generic term that refers to Africans, Indians and Coloured people in accordance with the definition given in the Broad-Based Black Economic Empowerment Act 53 of 2003.
2 The terms 'broad-based black economic empowerment' and 'black economic empowerment' are used only with the abbreviation BEE for simplicity purposes.
3 The generic scorecard referred to in this study refers to companies with an annual turnover of more than R35 million. Qualifying small enterprises (QSE), companies with an annual total revenue of R5 to R35 million, must select any four of the seven elements for the purposes of measurement under the QSE scorecard in the codes or the best four elements will be used for measurement of the BEE score (South Africa, 2007).
4 Black people represent 79.5 percent Africans, 9 percent Coloureds and 2.5 percent Indians/Asians.
5 Data from 2005 to 2009 are available to the public on the Empowerdex website. The data for 2010 and 2011 are only available on the website per total BEE score and are not presented per element; Empowerdex provided the data set separated per element for 2010 and 2011.
6 The dependant variable, share returns, was not winsorised, but an outlier with a share return of 200 (20 000 percent) was eliminated from the sample to ensure that this single firm-year does not affect the study's results. The minimum share return is -0.893 and the maximum share return 8.839 - refer to Table 2.
7 Companies which have delisted might have other negative elements which could influence the share returns. The focus of this study is to compare companies' share returns and determine what effect the BEE score, per element, has on returns. The study tests the association between companies' BEE scores and BEE elements and share returns to determine the effect of higher or lower scores. The study does not compare companies with BEE scores/elements with companies without BEE scores/elements nor does it compare companies with BEE scores/elements with the market.

