


Servicios Personalizados
Articulo
 Inglés (pdf)
 Articulo en XML
 Referencias del artículo
Indicadores

Links relacionados
-
 Citado por Google
 -
 Similares en Google
Compartir

 Permalink
South African Journal of Economic and Management Sciences
versión On-line ISSN 2222-3436
versión impresa ISSN 1015-8812
S. Afr. j. econ. manag. sci. vol.17 no.2 Pretoria feb. 2014
ARTICLES
The non-consumptive value of selected marine species at Table Mountain National Park: an exploratory study
Melville Saayman
Tourism Research in Economic Environs and Society, North-West University
ABSTRACT
This exploratory study aimed to determine firstly the non-consumptive value of five marine species (whales, the Great White shark, penguins, dolphins and seals) and secondly the sociodemographic and behavioural variables that influence willingness to pay to see these species. This was achieved by means of a structured questionnaire survey conducted at Table Mountain National Park, the largest urban national park in South Africa. The data consisted of responses to 319 fully completed questionnaires. These were analysed using factor analysis and Ordinary Least Squares (OLS) regression analysis. The results showed that the variables influencing willingness to pay differed from species to species, with the biggest differences being found in behavioural rather than sociodemographic variables. In showing how much respondents were willing to pay to see the various species and which species they preferred, the results also highlighted the non-consumptive value of the species.
Key words: factor analysis, marine tourism, non-consumptive value, regression analysis, urban park, willingness to pay.
JEL: C830, H410, Q250
1 Introduction
South Africa is a well-known nature-based tourism destination where tourists travel to see and experience the wide variety of fauna and flora on offer. The country boasts 21 national and more than a hundred provincial parks and conservation or protected areas. The most visited national park is Table Mountain National Park, established in 1998 and attracting more than two million visitors a year. Situated at the south-western tip of Africa, the Park stretches from Signal Hill in Cape Town to Cape Point in the south. Its current size is 25 000 hectares, and its jurisdiction extends across 1 000 square kilometres of seas and coastline around the Cape Peninsula (SANParks, 2011). It is also known for two world-renowned landmarks, namely Table Mountain (a World Heritage Site and one of the world's seven wonders of nature) and the Cape of Good Hope. Its diverse and unique fauna offer tourists the opportunity to view a variety of marine species. The focus of this exploratory research is on the Park's marine attractions and specifically tourists' willingness to pay to see marine species. Therefore, one wants to know how much, in monetary terms, a visitor values the sighting of particular species. This type of research has been done in several areas of conservation, environment management and wildlife recreation. However, Hay and McConnell (1979:462) stated in 1979 that "no studies have successfully estimated the net economic value of wildlife watching". Ten years later, Wagner (1989) also sounded a plea for more research on this topic to gain a better understanding of the non-consumptive value of different species. An assessment of the latest available literature on the topic reveals that the situation has not changed dramatically (see for example Tsi, Nij & Mühlenberg, 2008). Rockel and Kealy (1991) emphasise the importance of this area of research when they state that although non-consumptive wildlife recreation or game watching enjoys wider participation than all hunting and fishing combined, it receives comparatively less attention from scientists. In essence, it is true that the tourism and leisure industries do not know the non-consumptive value of different species, yet managers have to manage these resources. This is a bit like running a business without knowing the value of the goods and services you are selling.
In addition to the above, this paper will explain the sociodemographic and behavioural variables that determine willingness to pay. This information will be useful not only for marketing and managing the Park, but also to fill the gap in the literature concerning the non-consumptive value of marine species. The species under investigation in this study are whales, the Great White shark, penguins, dolphins and seals, since these are some of the key species among those protected by this Park that tourists have a good chance of seeing.
2 Literature review
The fastest-growing element of tourism today is nature-based tourism, which includes trips to national parks and wilderness areas. Many tourists today want get in touch with nature; for them, nature provides a special holiday experience (Kuenzi & McNeely, 2008:156). This is confirmed by numerous studies on this topic (see Van der Merwe, Slabbert & Saayman, 2011; Kruger & Saayman, 2009). Opportunities for wildlife viewing are a valuable asset to national parks since tourists are willing to pay a significant amount of money to view particular species of animals and nature in general. Moreover, in South Africa, as in many other African and developing countries, this type of tourism forms the backbone of the tourism industry. It is a growing segment of nature-based tourism (Aziz, Radam & Samdin, 2010). For wildlife tourism to succeed, the market demand must be realistically assessed in terms of price, quality and type of activities preferred, so as to appeal to the kind of tourists that predominate in the area. Wildlife watching covers a wide range of different species. Some are easy to access, but getting to see species like the "Big Five" (i.e. lion, buffalo, rhinoceros, leopard and elephant) is difficult and costly (Tapper, 2006:16). Little research has been done on the topic of how much tourists are willing to pay for the opportunity to see different species in their natural environment, so there are still questions to be answered. In this regard, Lindsey, Alexander, Mills, Romanach and Woodroffe (2007:30) state that international tourists visiting South Africa are primarily interested in large predators, while local, more experienced wildlife tourists show more interest in bird diversity, plant diversity and scenery, and are less interested in high-profile mammal species.
The value of wildlife can be divided into direct or indirect value (Chardonnet, Des Clers, Fisher, Gerhold, Jori & Lamarque, 2002:15). The direct value is the consumptive use of wildlife where wildlife resources are directly exploited, for example by means of hunting and fishing. Indirect value is the non-consumptive use of wildlife, which essentially means wildlife viewing, and this value is more difficult to determine (Hay & McConnell, 1979; Chardonnet et al., 2002:17). Whichever way one looks at it, it is clear that tourists do value the non-consumption or viewing of species and it is likely that they place different values on different species. Various studies have been conducted on different aspects of wildlife and environmental management as well as wildlife-associated recreation. Examples include the work of Hay and McConnell (1979), Chae, Wattage and Pascoe (2012), Park, Bowker and Leeworthy (2002), Leeworthy, Wiley, English and Kriesel (2001), Rockel and Kealy (1991), Tongson and Dygico (2004), and Zawacki, Marsinko and Bowker (2000) on wildlife recreation, Swanson (1994) and Alexander (2000) on the economics of extinction, Skonhoft (1998) on the conflict between African conservation and agriculture, and Muchapondwa, Carlson and Kohlin (2008) on managing elephants in Zimbabwe. These and several other studies do not, however, address the question raised by this research. The only similar studies are those by Hadkler, Sharma, David and Muraleedharan (1997), Tsi et al. (2008), Aziz et al. (2010), Tisdell and Wilson (2001), and Wilson and Tisdell (2001). However, of these studies, it was only Tisdell and Wilson (2001) who did research on marine species, namely sea turtles. Therefore, much more needs to be done in this regard.
A review of the literature revealed three methods of assessing willingness to pay for wildlife viewing (Spash, 2000). The first is the travel cost method, which is used to estimate the economic use values associated with the particular animal (Zawacki et al., 2000; King & Mazzotta, 2000). This method uses a cost-benefit analysis based on three factors, namely changes in access cost, the establishment or abolition of recreational sites, and changes in the environmental quality of a particular site. It establishes visitors' willingness to pay by assessing the number of trips they make when one or more of these factors change (Zawacki et al., 2000; King & Mazzotta, 2000). The travel cost method was not considered ideal for the present study because it is based on the following two assumptions: (i) that people will respond to changes in travel cost in the same way as to a change in the cost of entrance permits (this is not always the case), and (ii) that a person travels for a single purpose (should a person visit another destination, then the value of the original destination would be overestimated).
The second method, which was also not considered ideal, is the hedonic price method, which uses the price of goods with different measurable characteristics in order to determine the price of each item (Gundimeda, 2005; Hanley & Spash, 2003). This method is commonly used to set house prices by determining willingness to pay for each characteristic of a house.
The third method, which is the one used in this paper, is the contingent valuation (CV) method. According to Spash (2000), the contingent valuation method has risen to prominence among the three methods mentioned above. This method is commonly used to determine the economic value of new market environmental attributes or services (King & Mazzotta, 2000). It can apply both non-use and use values of environmental services and it generally uses a questionnaire or survey. One of the challenges in this type of study remains sample size, which is generally small (Du Preez, Lee & Cloete, 2013; Hausman, 2012). A review of the literature shows that the main factors influencing willingness to pay are income, age, education, nationality, marital status, number of children, loyalty and donations (see Kosz, 1996; Hadkler et al., 1997; Tisdell & Wilson, 2001; Tsi et al., 2008; Aziz et al., 2010). All these studies showed that both education and income are positively related to willingness to pay, but education more strongly than income. Age showed a negative relation to willingness to pay, which implies that older respondents will probably not be willing to pay as much as the younger ones (Kosz, 1996; Tisdell & Wilson, 2001; Aziz et al., 2010). Hadkler et al. (1997) found the opposite, namely that older respondents are willing to pay more. Marital status generally shows a positive relationship with willingness to pay, which is to say that married visitors are willing to pay more than unmarried visitors (Aziz et al., 2010; Kosz, 1996), while nationality shows a negative correlation, meaning that international visitors are likely to pay more than local visitors (Hadkler et al., 1997; Aziz et al., 2010).
In terms of profession, the higher the visitors' professional standing, the more likely they are to pay more (Hadkler et al., 1997; Tisdell & Wilson, 2001; Aziz et al., 2010).
Loyalty is also positively related to willingness to pay (Kosz, 1996). An interesting finding from the literature is that people who make donations to conservation causes show less willingness to pay (Kosz, 1996; Hadkler et al., 1997; Tisdell & Wilson, 2001). The underlying research questions are: What are the non-consumptive values of the different marine species? and What are the sociodemographic and behavioural variables influencing willingness to pay to see these species? Based on the literature review, the following hypotheses will be tested.
Hypothesis 1
There is a positive relationship between income and willingness to pay.
Hypothesis 2
There is a positive relationship between education and willingness to pay.
Hypothesis 3
Married people are willing to pay more.
Hypothesis 4
Foreigners show a higher willingness to pay.
Hypothesis 5
A loyal customer is willing to buy more.
3 Method of research
The method will be discussed under the following headings: the questionnaire, sampling method and survey and statistical analysis.
3.1 The questionnaire
The survey used a five-section questionnaire adapted from Tisdell and Wilson (2001) and Aziz et al. (2010). The guidelines for performing CV studies by the NOAA Report were also followed (see Arrow et al., 1993). Section A elicited the respondents' sociodemographic particulars (gender, age, home language, marital status and province of residence), Section B their spending behaviour, Section C their perception of the Park's facilities, Section D their reasons for visiting the Park, and Section E how they rated the Park's marine species and what rand (R) value they would place on them. In determining the value they would place on marine species, respondents could allocate any amount, making this an open question. The questionnaire was pretested with a group of ten people in order to determine whether the questions were clearly understood by the respondents.
3.2 Sampling method and survey
All tourists who visited Table Mountain National Park during the period of the survey, 18 to 22 August 2011, formed part of the sample and were requested to complete the questionnaire. Fieldworkers distributed the questionnaires to visitors at the three key points in the Park: Table Mountain Cable Station (n=123), Boulders Beach (n=154) and the Cape of Good Hope (n=42). A total of 319 fully completed questionnaires were used in the statistical analysis. Based on the total number of visitors (152 233) to the Park during August, this provides a 5.5 per cent margin of error with 95 per cent certainty. Forty-three per cent of the respondents were nationals and 57 per cent were international visitors; according to a report by Kruger, Scholtz & Saayman (2012), Table Mountain National Park attracts more foreign visitors than locals. Therefore, the profile of the respondents, if compared with results obtained in the research conducted by Kruger et al. (2012) over a couple of years, is a good representation of visitors to this park.
3.3 Statistical analysis
The data were captured using Microsoft© Excel© and analysed using IBM SPSS (SPSS Inc, 2010). The statistical analysis was done in three stages. Firstly, the data from the survey were pooled. Secondly, a principal factor analysis with Oblimin rotation and Kaiser normalisation was performed on the 40 items that determined the reasons for visiting the Park. All items with a factor loading above 0.4 were considered as a contributing factor, since, according to Field (2006), for a sample size above 300, one could use factor loadings above 0,3. All reliability coefficients (Cronbach's alpha) were captured to estimate the internal consistency of each factor and all factors had a reliability coefficient above 0.6, which again, according to Field (2006), is acceptable for this kind of research. From the factor analysis, eight factors were identified and labelled as Facilities (4.21), Amenities (4.26), Activities (1.95), Learning (3.36), Attraction (2.98), Family and friends (2.76), Escape (2.98) and Nature experience (3.42). The numbers shown here in brackets are the mean values of the factors. These explained 70.35 per cent of the variance. In the third stage of the analysis, these factors were used as variables in an Ordinary Least Squares (OLS) regression analysis. The five species were used separately as the dependent variable in order to discover which variables determined willingness to pay. Wooldridge (2009:45) explains that the main reason for incorporating natural logarithms into a model is to impose a constant percentage effect of independent variables on the dependent variable.
4 Results
This section describes first the findings pertaining to respondents' preferences for the five species and then the regression analysis of the species separately.
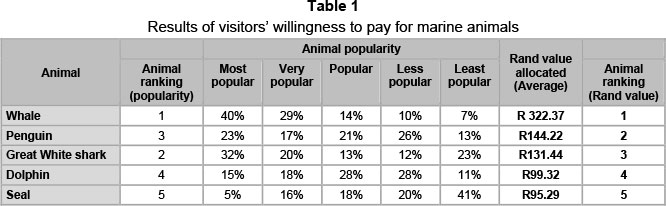
Respondents first indicated their preference, by rating the species on a scale of 1 to 5, and then indicated how much they were willing to pay to see these animals, by allocating a specific amount per species. Table 1 shows that the preference of the five species was ranked from most popular to least popular as follows: whales, the Great White shark, penguins, dolphins and then seals. When it came to the non-consumptive value, whales were rated significantly higher than sharks, penguins, dolphins or seals. In one case (i.e. the Great White shark), there is a difference between preference and willingness to pay. The second analysis entailed a deeper investigation into what drives these differences. This was done by means of regression analysis. Table 2 below shows the regression coefficient and the standard error in brackets.
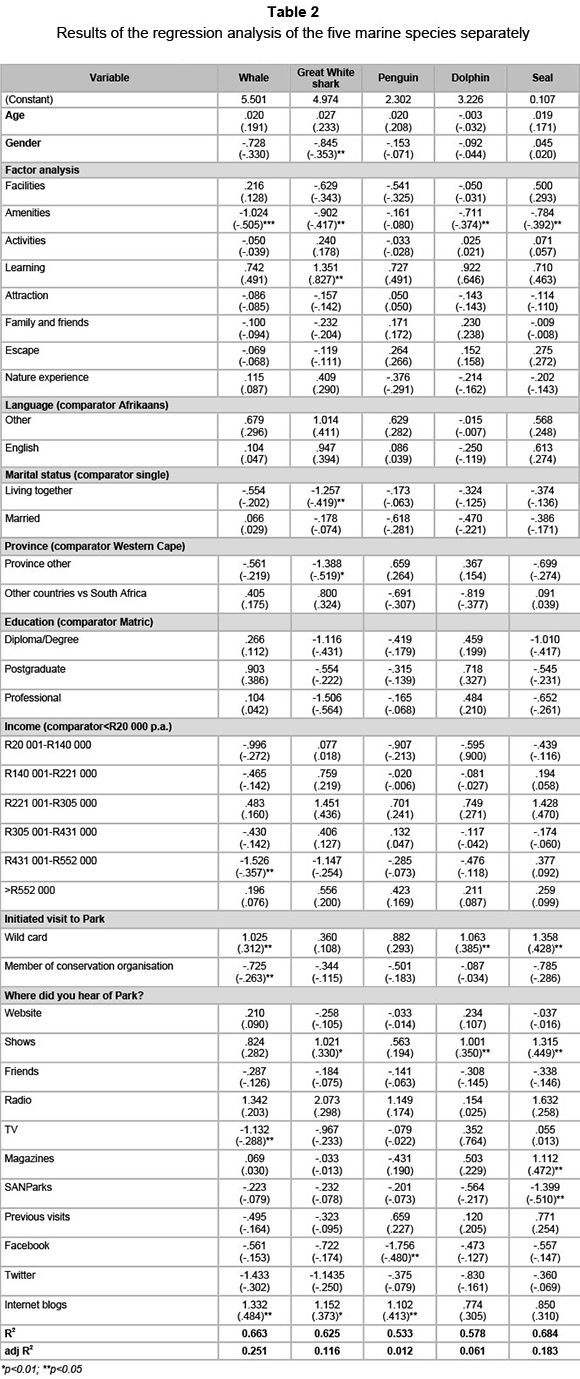
Analysing the sociodemographic characteristics of visitors in relation to the five species, we can see from Table 2 that it was only in the case of the Great White shark that males were more willing to pay than females. The same applies to people/couples living together and those living in the Western Cape Province who are willing to pay more to see the Great White shark. Therefore, this research rejects hypothesis 3 in that the fact that people were married was not found to be positively correlated with willingness to pay. In addition to this, the research finds little support for hypothesis 2, since no relationship was found between education and willingness to pay. An interesting finding is that there is no clear relationship between willingness to pay and income, with only one income category being moderately significant. Therefore, hypothesis 1 is also rejected. Another interesting finding is that this research also rejects hypothesis 4, since foreigners who make up the largest percentage of the sample are clearly not willing to pay more than locals.
Looking at behavioural characteristics, one can see that visitors who are motivated by the Park's amenities show a negative relationship with willingness to pay more and were therefore more willing to pay for what the Park offers in terms of other attractions and hiking trails than to see whales, Great White sharks, dolphins and seals. Visitors with a Wild Card (loyalty card) were also willing to pay more (in the case of whales, dolphins and seals), thereby confirming hypothesis 5. In contrast to Wild Card members, not all members of conservation organisations or agencies were willing to pay more. It was interesting to note that those who had heard about the Park on Facebook were not willing to pay more in the case of penguins, and that shows, magazines and Internet blogs as marketing tools showed a positive relationship with willingness to pay.
The results also show the R-square and adjusted R-square of the regression analysis. For all five species, more than 50 per cent of the variance in willingness to pay is explained by independent variables. In all the regressions, the adjusted R-squares are much lower. This is to be expected since the adjusted R-square penalises one for each variable included. The analysis tested various hypotheses, which resulted in a large number of independent variables, which were retained in the equations.
5 Findings and implications
The first major finding is that visitors are willing to pay more to see the supposedly less important species than the large predators that Lindsey et al. (2007) say are the main interest for international visitors. Results show that there is a demand to see these marine species and a willingness to pay for the experience, by both national and international visitors, thereby confirming the non-consumptive value of these species, as indicated in Table 1. This implies that the Park should not only promote these species, but should also offer visitors the opportunity to experience them. An interpretation centre that provides more detail and information on these species would also be advantageous in promoting them, especially the whales, Great White shark, dolphins and seals. There is an interpretation centre for penguins at Boulders.
Secondly, it is also interesting to find that visitors are willing to pay significantly more to see whales than to see the other four marine species. Penguins are the second most favoured, followed by the Great White shark, dolphins and seals. A possible reason for the high interest in penguins is that the visitor is guaranteed to see them, since the Park offers a facility (Boulders Beach) where they live and breed. In addition, international visitors visit all three key points where the surveys were conducted; and therefore they would probably all be able to see penguins at close range at Boulders Beach. Interpretation of these species also takes place at Boulders. The implication of the findings is that offering trips to see these species, especially whales, is a tourism option that management at Table Mountain National Park should strongly consider.
The third finding is that the variables influencing willingness to pay for the five species produced a mixed bag of results and that several variables influence willingness to pay. Most of the variables that influence willingness to pay are behavioural rather than sociodemographic. In fact, when one compares the five species it is difficult to detect a pattern. This proves that factors that influence interest in one species cannot be seen as applicable to another. The reason for this is probably the uniqueness of each species and the differences in the likelihood of seeing a particular species. In contrast to findings mentioned in the literature review (Tisdell & Wilson, 2001; Tsi et al. 2008; Aziz et al. 2010), this research does not confirm that income influences willingness to pay, and therefore this study does not clearly support research by Tisdell and Wilson (2001), Tsi et al. (2008) and Aziz et al. (2010). In terms of age, the results are inconclusive. Again, this research contradicts previous work done by Kosz (1996) and Aziz et al. (2010), but supports research by Hadkler et al. (1997). Gender was found to be a positive variable only in the case of the Great White shark.
Marital status, specifically as regards couples living together, was found to be significant in the case of the Great White shark. For the other species, it was inconclusive, thereby contradicting Kosz (1996) and Aziz et al. (2010). In no case did being married appear to be a significant variable that influenced willingness to pay and since no previous studies have applied all the categories of marital status it is difficult to make a comparison.
There was no significant relationship for nationality (other countries versus South Africa), thereby contradicting research by Hadkler et al. (1997) and Aziz et al. (2010), who found that foreigners are willing to pay more than locals. This research confirms research done by Kruger et al. (2012), who indicated that foreign visitors to national parks in South Africa spend less than local tourists do. Higher levels of education did not appear to be positively correlated with spending either. Loyalty was found to show a positive relationship, thereby confirming results by Kosz (1996). This research also confirms that in the case of whales visitors who belong to conservation organisations are less willing to pay more.
A very interesting finding is that, in the case of whales, the Great White shark, dolphins and seals, respondents who are motivated by amenities in the Park are willing to pay less to see these species. The amenities that the Park offers, such as hiking trails and other activities, are greater attractions and a possible reason for this is that those species are more difficult to see than penguins or that there is not sufficient opportunity to spot them or respondents do not know enough about them or how they should go about seeing them. Therefore, Park managers should create more opportunity for visitors to see and experience these species.
6 Conclusion
If one asks whether visitors value (in monetary terms) marine species such as whales, the Great White shark, penguins, dolphins and seals, the answer is clearly yes. This study showed, however, that the monetary or non-consumptive value that visitors attach to the different species differs according to the type of visitors and that several variables influence willingness to pay. These variables also differ from species to species. This is the first time that the non-consumptive value of these marine species has been determined. This innovative research therefore makes an important contribution to understanding the non-consumptive value of marine species and the variables influencing willingness to pay, although it is exploratory. It shows that much more research is still needed on the non-consumptive value of species. In this regard, this research echoes Hay and McConnell's (1979) and Wagner's (1989) plea for more research on this topic. This research rejected four of the hypotheses and confirmed one. It clearly shows that the variables influencing willingness to pay differ significantly from one species to the next. An interesting study would be to determine which species would create the optimum demand. This would help conservation organisations to make it possible for visitors to experience them. Another possibility would be to determine to what extent interpretation such as information brochures, pamphlets and oral presentations as well as environmental education would contribute to willingness to pay. A limitation of this study is that a larger sample size would be preferable. However, this study is seen as exploratory, since willingness to pay has not been determined for these species.
Acknowledgements
The author would like to acknowledge SANParks and specifically Mr. Glenn Phillips and Bheki Zwane for financial assistance, the visitors for completing questionnaires and the National Research Foundation for cofunding and the reviewers for useful comments.
References
ALEXANDER, R.R. 2000. Modelling species extinction: The case for non-consumptive values. Ecological economics, 35(2):259-269. [ Links ]
ARROW, K., SOLOW, R., PORTNEY, P., LEAMER, E., RADNER, R. & SCHUMAN, H. 1993. Report of the NOAA panel on contingent valuation. Federal register, 58(10):4602-4614. [ Links ]
AZIZ, Y.A., RADAM, A. & SAMDIN, Z. 2010. Factors influencing the willingness to pay for entrance permit: The evidence from Taman Negara National Park. Journal of sustainable development, 3(3):212-220. [ Links ]
CHAE, D., WATTAGE, P. & PASCOE, S. 2012. Recreational benefits from a marine protected area: a travel cost-analysis of Lundy. Tourism Management, 33(4):971-977. [ Links ]
CHARDONNET, P., DES CLERS, B., FISHER, J., GERHOLD, R., JORI, F. & LAMARQUE, F. 2002. The value of wildlife. Scientific and Technical Reviews of the Office International des Epizooties, 21(1):15-51. [ Links ]
DU PREEZ, M., LEE, D. E., & CLOETE, L. 2013. Estimating the willingness to pay for the removal of a local undesirable land use: The case of the Manganese ore dump and oil tank farm in the Port Elizabeth Harbour. Economic Research Southern Africa, (Working Paper No. 338). [ Links ]
FIELD, A. 2006. Discovering statistics using SPSS. London: UK: Sage. [ Links ]
GUNDIMEDA, H. 2005. Hedonic price method - A concept note. Madras School of Economics: Chennai. Available at: http://coe.mse.ac.in/dp/hedonic%20price.pdf [accessed 25-04-2011]. [ Links ]
HADKLER, N., SHARMA, S., DAVID, A. & MURALEEDHARAN, T.R. 1997. Willingness-to-pay for Borivli National Park: Evidence from a contingent valuation. Ecological Economics, 21(2):105-122. [ Links ]
HANLEY, N. & SPASH, C.L. 2003. Cost-benefit analysis and the environment. Bodmin, Cornwall: MPG Books. [ Links ]
HAY, M.J. & McCONNELL, K.E. 1979. An analysis of participation in nonconsumptive wildlife recreation. Land Economics, 55(4):460-471. [ Links ]
HAUSMAN, J. 2012. Contingent valuation: From dubious to hopeless. Journal of Economic Perspective, 26(4):43-56. [ Links ]
KING, D.M. & MAZZOTTA, M.J. 2000. Contingent valuation method. Available at: http://www.ecosystemvaluation.org/contingent_valuation.htm [accessed 25-04-2011]. [ Links ]
KOSZ, M. 1996. Valuing riverside wetlands: The case of the "Donau-Auen" national park. Ecological Economics, 16(2):109-127. [ Links ]
KRUGER, M. & SAAYMAN, M. 2009. Travel motivations of visitors to Kruger and Tsitsikamma National Parks: A conceptual study. South Africa journal of wildlife research, 40(1):93-102. [ Links ]
KRUGER, M., SCHOLTZ, M. & SAAYMAN, M. 2012. Executive summary of research profiles of selected national parks in South Africa over 10 years. Tourism Research in Economic Environs and Society, Potchefstroom. [ Links ]
KUENZI, C. & McNEELY, J. 2008. Nature-based tourism (2nd ed.) The Netherlands: Springer. [ Links ]
LEEWORTHY, V.R., WILEY, P.C., ENGLISH, D.B.K. & KRIESEL, W. 2001. Correcting response bias in tourist spending surveys. Annals of Tourism Research, 28(1):83-97. [ Links ]
LINDSEY, P.A., ALEXANDER, R., MILLS, M.G.L., ROMANACH, S. & WOODROFFE, R. 2007. Wildlife viewing preferences of visitors to protected areas in South Africa: Implications for the role of ecotourism in conservation. Journal of Ecotourism, 6(1):19-33. [ Links ]
MUCHAPONDWA, E., CARLSON, F. & KOHLIN, G. 2008. Wildlife management in Zimbabwe: Evidence from a contingent valuation of elephants. South African Journal of Economics, 76(4):685-704. [ Links ] PARK, T., BOWKER, J.M. & LEEWORTHY, V.R. 2002. Valuing snorkelling visits to the Florida Keys with stated and revealed preference models. Journal of Environmental Management, 65(3):301-312. [ Links ]
ROCKEL, M.L. & KEALY, M.J. 1991. The value of nonconsumptive wildlife recreation in the United States. Land Economics, 67(4):422-434. [ Links ]
SANParks see South African National Parks (SANParks). [ Links ]
SKONHOFT, A. 1998. Resource utilization, property rights and welfare - wildlife and the local people. Ecological economics, 26(1):67-80. [ Links ]
SOUTH AFRICAN NATIONAL PARKS (SANParks). 2011. Kruger National Park. Available at: http://www.sanparks.org.za/parks/kruger/ [accessed 07-02-2011]. [ Links ]
SPASH, C.L. 2000. Multiple value expression in contingent valuation: Economics and ethics. Environmental Science and Technology, 34(8):1433-1438. [ Links ]
SPSS Inc. 2010. SPSS® 16.0 for Windows, Release 16.0.0, Copyright© by SPSS Inc., Chicago, Illinois. Available at: www.spss.com. [ Links ]
SWANSON, T.M. 1994. The economics of extinction revisited and revised: A generalised framework for the analysis of the problems of endangered species and biodiversity losses. Oxford Economic Papers, 46(1994):800-821. [ Links ]
TAPPER, R. 2006. Wildlife watching and tourism: A study on the benefits and risks of a fast growing tourism activity and its impacts on species. United Nations, Bonn: UNEP and CMS. [ Links ]
TISDELL, C. & WILSON C. 2001. Wildlife-based tourism and increased support for nature conservation financially and otherwise: Evidence from sea turtle ecotourism at Mon Repos. Tourism economics, 7(3): 233-249. [ Links ]
TONGSON, E. & DYGICO, M. 2004. User fee system for marine ecotourism: The Tubbataha Reef experience. Coastal Management, 32(1):17-23. [ Links ]
TSI, E.A., NJI, A. & MUHLENBERG, M. 2008. The willingness to pay (WTP) for the conservation of wild animals: Case of the Derby Eland (Taurotragus derbianus gigas) and the African wild dog (Lycaon pictus) in North Cameroon. African Journal of Environmental Science and Technology, 2(3):51-58. [ Links ]
VAN DER MERWE, P., SLABBERT, E. & SAAYMAN, M. 2011. Travel motives of tourists to selected marine destinations. International Journal of Tourism Research, 13(5):457-467. [ Links ]
WAGNER, F.H. 1989. American wildlife management at the crossroads. Wildlife Society Bulletin, 17(3): 354-360. [ Links ]
WILSON, C. & TISDELL, C. 2001. Sea turtles as a non-consumptive tourism resource especially in Australia. Tourism Management, 22(3):279-288. [ Links ]
WOOLDRIDGE, J.M. 2009. Introductory econometrics: A modern approach (4th ed.) USA: Mason. [ Links ]
ZAWACKI, W.T, MARSINKO, A. & BOWKER, J.M. 2000. A travel cost analysis of non-consumptive wild-associated recreation in the United States. Forest Science, 46(4):496-506. [ Links ]
Accepted: July 2013

