


Serviços Personalizados
Artigo
 Inglês (pdf)
 Artigo em XML
 Referências do artigo
Indicadores

Links relacionados
-
 Citado por Google
 -
 Similares em Google
Compartilhar

 Permalink
South African Journal of Economic and Management Sciences
versão On-line ISSN 2222-3436
versão impressa ISSN 1015-8812
S. Afr. j. econ. manag. sci. vol.16 no.5 Pretoria 2013
High-tech industries overseas investment performance evaluation - application of data envelopment analysis
Ridong HuI; Chich-Jen ShiehII, *
ISchool of Economics and Finance, Huaqiao University, China
IIDepartment of International Business, Chang Jung Christian University, Taiwan
ABSTRACT
With the rapid change of the social environment, Mainland China has become a new economic market due to the great domestic demand caused by its enormous population and the increasing economic growth rate. Taiwanese businesses have gradually turned to develop in China under the pressure of increasing domestic wages and land costs for expanding factories as well as the enhancement of environmental protection. Mainland China presents the advantages of ample land, low labor costs, monoethnicity, and easy language communication making it an attractive major investment location for Taiwanese high-tech industries. Data Envelopment Analysis (DEA) is applied to measure overseas investment efficiency evaluation of Taiwanese high-tech businesses in China, where the Delphi Method is used for selecting the inputs of the number of employees, R&D expenses, and gross sales in total assets. Sensitivity Analysis is further utilized for acquiring the most efficient unit and individual units with operating efficiency. The research results show that 1.Three high-tech businesses that present constant returns to scale perform optimally with overseas investment efficiency 2.Two high-tech companies with decreasing returns to scale appear that they could improve the overseas investment efficiency by decreasing the scale to enhancing the marginal returns, and 3.Sixteen high-tech enterprises reveal increasing returns to scale, showing that they could expand the scale to enhance the marginal returns and further promote efficiency.
Key words: data envelopment analysis, Fuzzy Delphi Method, high-tech industries, OEM, operating performance, overseas investment, technical efficiency, R&D, slack variable analysis, World Trade Organization
JEL: B400, M160
1 Introduction
International Business Machines Corporation (IBM) unintentionally made the computer structure public in the early 1980s and announced that they planned to develop microcomputers with global manufacturers. Taiwanese manufacturers actively responded and supported such an industrial development. With the cooperation of major international manufacturers, Taiwanese computer OEM manufacturers such as Acer and MiTAC had the chance to develop the business. Taiwanese manufacturers professionally divided the labor for micro-computer components for assembly of the globally renowned computer giant with fine labor division and a closely connected cluster industrial system (Dedrick & Kraemer, 1998). The export value of high-tech industries in Taiwan presented 0.83 trillion US dollars in 1985 and 2.41 trillion US dollars in 1990. This increased about three times, to 8.28 trillion US dollars in 2000. high-tech industries, especially electrical and electronic industries in Taiwan have achieved tremendous industrial performance since the 1990s. By 1995 Taiwan had become the fourth largest IC production country and the top production country of computers and peripheral equipment, such as motherboards, monitors, and keyboards in the world (Ministry of Economic Affairs, 2012). Following this impressive achievement, the researchers are interested in how, through division of labour and depending on supply chains, high-tech manufacturers in Taiwan achieved top production in the world and through good performance to successfully enter the international market.
Although the extraordinary achievements have been created by high-tech manufacturers in Taiwan, the short life-cycle of high-tech products has pushed high-tech businesses into investing or moving overseas in order to pursue the maximal production profits. The issue of overseas investment is therefore emphasized; and, most researchers have appealed to the overseas investment of hightech industries, particularly in the investment in Mainland China. This is why this paper used Taiwan's high-tech industry investment in China as the research sample.
2 Literature review
2.1 Business operating performance measurement indicators
Chang (2007) observed that general businesses aimed to pursue development and acquire maximal profits. Nevertheless, the profit data of conservative businesses could not easily be acquired and most businesses divided their financial data across various products, rather than from a profit-making perspective. Technology-intensive industries such as electronics grew rapidly when newly developed products were accepted in the market and the growth rate of business revenue was considered as an overall performance indicator. Chen (2009) indicated that general operating performance was measured via financial indicators, such as return on assets, profit ratio, and return on investment. When the acquired data were sufficient and reliable, the long-term profit ratio would be the best indicator to measure business performance. Eccles and Pyburn (1992) pointed out the importance of financial indicators when measuring the overall performance of businesses. However, merely regarding revenue as performance did not give the complete picture. Non-financial control should be used to track the key success factors so as to achieve the financial objectives. Lee (2005) indicated that because traditional financial performance indicators did not focus on the process so that they could not assist managers in making decisions. Moreover, they lacked prediction capability that would save costs, but sacrifice long-term competitive strengths. Non-financial performance indicators, such as market share, capability of new product development, product and service quality, productivity, and employee training, should be incorporated in performance measurement indicators. Chen (2003) studied the performance evaluation theories and indicator systems and compiled the aspects for organizational performance evaluation. Delaney and Huselid (1996) used cognitive organization performance and cognitive market performance as measurement indicators. The former contained product or service quality, new products or services development, employee morale, and customer satisfaction. The latter included the growth rate of revenue, market share, profit ratio, and marketing capability. Cognitive organization performance could be regarded as a non-financial indicator which presented great effects on permanent business operations.
2.2 Effects of overseas investment on business performance
Lee, Wang & Liu (2006) measured Taiwanese businesses investing in Southeast Asia (including Mainland China) with a questionnaire that showed that in addition to low labor costs, 18.7 per cent manufacturers tended to have mastered their local market demand and expanded their local sales. With the rapid economic development in China and the World Trade Organization (WTO) exposing the Chinese market to the world, the development of the overseas market is a great opportunity for Taiwanese businesses. Su (2009) listed the key success factors in Taiwan's electronic businesses investing in China as acquiring control of business management, completely utilizing local resources and privileges, and local relationships. Wang (2009) concluded that the development of the Taiwannese information industry would not be affected even if the R&D center and the technology were controlled in Taiwan, while assembly for manufacturing was moved to China. Using Data Envelopment Analysis, Chen (2004) studied the differences in Overall Technical Efficiency, Pure Technical Efficiency, and Scale Efficiency of businesses before and after investing in China. In terms of Scale Efficiency, the sample investing company in China showed a significant enhancement on Scale Efficiency of the mother company in Taiwan. Regarding Pure Technical Efficiency, no remarkable differences appeared among the samples. As Scale Efficiency was improved, Overall Technical Efficiency after investing in China was higher than before investment. With regard to economies of scale, most sample companies revealed increasing returns to scale. Using regression analysis Pai (2005) discusses the effects of the investment scale of listed mother board- and printed circuit board manufacturers on the financial performance in Taiwan . The results showed positive effects of scale and investment scale on the financial performance of operating revenue and production value.
2.3 Data envelopment analysis
Charnes, Cooper & Rhodes (1978) expanded Farrell's single output/input to multiple inputs/ outputs and simplified the linear planning model with mathematical component namely, as a Data Envelopment Analysis. When estimating the production boundary with Data Envelopment Analysis, two dimensions are considered, namely input-orientation and output-orientation. In microeconomics Data Envelopment Analysis (DEA) replaces the production function with envelopment, so that all inputs/outputs are projected to locate boundaries. Decision-Making Units on the boundary are considered as the most efficient input/output combination with the performance indicator is defined as 1, while DMUs not on the boundary are considered inefficient. Having a specific efficient point as the standard, each DMU is given a relative performance indicator. Data Envelopment Analysis presents the flexibility integrating the subjective opinions of experts and decision-makers into an evaluation that could objectively evaluate the performance of each unit and subjectively guide DMUs to the direction emphasized by decision-makers.
3 Research design
To discuss the operating efficiency of hightech industries, one needs to consider the major expenses involved in the rapid market change, short product cycle, R&D of manufacturers, the fixed assets of land, buildings, machinery, and the employees. The efficiency evaluation of Data Envelopment Analysis depends on the input/output data of DMUs that would be distorted when improper inputs/outputs are selected. For this reason, the correct input/output variables are regarded as key success factors in Data Envelopment Analysis.
Labor and capital are the essential inputs in the production process that, in addition to the above principle of input/output variables, the selection of inputs/outputs should combine the experts' opinions and avoid fuzziness in the interview. The Fuzzy Delphi Method is therefore used for selecting the inputs/outputs. Out of a total 40 questionnaires distributed, 35 valid ones were retrieved, giving a retrieval rate of 88 per cent. Fremont, Shull, Delbecg & Curmings (1970) indicated that the public opinion of more than five participants could be accepted as an analysis basis. The interviewed experts in this study appear to be representative, comprising industry, officials, and academia and have had frequent interaction with overseas investment. After the computation with the Fuzzy Delphi Method, the geometric mean among experts was accepted towards inputs/outputs. The median of the evaluation scores of inputs/outputs is regarded as the selection standard of the inputs/outputs for high-tech industries overseas investment measurement. In this study, a total of four input/output variables and 21 DMUs were selected. The data of all the variables were acquired from public prospectuses and annual reports, as the following definitions:
1) R&D expenses Generally speaking, a business could create value through R&D, design, production, marketing, logistics, and after-sales services (Kaplan & Atkinson, 1999).
2) Total assets (I2). Assets are the production tool, which should be (a) tangible and endurable, (b) renewable, and (c) used in the production process. Accordingly, the capital input merely contains total fixed assets, but not current assets, construction in progress, and in-transit equipment.
3) Number of employees (I3). Labor contains staff and workers which are regarded as homogeneous inputs for analyses. Employees with rewards are referred to as labor demand.
4) Gross sales (01). Gross sales are regarded as the output of business operating performance where the operating revenue in 2009-2012 is used as the output variable.
4 Empirical analysis of overseas investment efficiency
4.1 Analysis of high-tech industries overseas investment efficiency
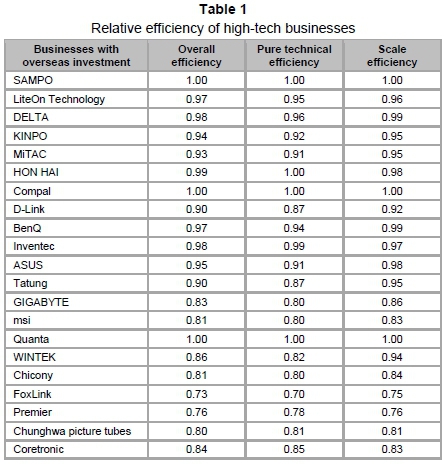
The DEA efficiency evaluation results could help us understand the relative efficiencies of overseas investment among high-tech businesses. When the efficiency equals to 1, the DMU achievements are relatively efficient. Alternately, it is relatively insufficient when the efficiency is less than 1. Table 1 indicates the empirical results, of three companies, including SAMP0, Compal, and Quanta, appeared relatively efficient with an efficiency=1. In other words, the overseas investment efficiency of three such companies achieved an ideal situation, while the rest of the 18 companies reported relatively worse overseas investment efficiency.
4.2 Slack variable analysis
With regard to returns to scale analysis, three high-tech businesses appeared with constant returns to scale, Table 2, which allowed the overseas investment efficiency to reach its optimum. Two high-tech businesses showed decreasing returns to scale and the overseas investment efficiency could be improved by decreasing the scale to enhance the marginal returns. The rest of the 16 enterprises presented increasing returns to scale and efficiency could be promoted by expanding the scale to enhance the marginal returns.
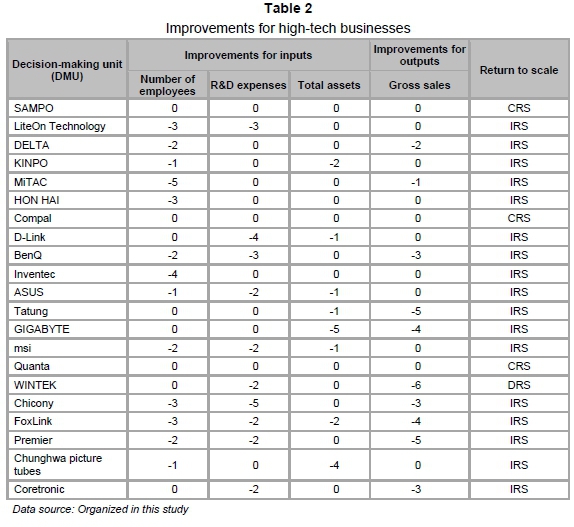
Regarding slack variable analysis, the improvement for high-tech businesses with too many inputs is shown in Table 2. The unit could achieve efficient operation by decreasing inputs. Moreover, three high-tech businesses revealed overseas investment efficiency where the input resource achieved the optimum.
5 Conclusions and suggestions
Originally based on the report by Kung (2009), Ma (2010) further classified DMUs into Strong Efficiency, Marginal Efficiency, Marginal Inefficiency, and Distinct Inefficiency, where Strong Efficiency showed an efficiency=1 and a slack variable=0, whose strength was much larger than inefficient DMUs. Such units could sustain their efficiency unless there were major changes in the inputs/outputs. Marginal Efficiency presented an efficiency=1 and at least one slack variable ≠ 0 where the efficiency would drop below 1 when the inputs were increased or the outputs were decreased. Marginal Inefficiency revealed an efficiency of less than 1 which was larger than 0.9. The efficiency could easily be increased to 1. When the efficiency <0.9, it was regarded as Distinct Inefficiency. Such units could not easily be changed to be efficient in a short period. Units with the efficiency <0.75 would remain to be inefficient unless there were major changes of inputs/outputs.
The efficiency acquired from the DEA and the variables are set out in Table 2, with a total of three DMUs. Fourteen per cent of all DMUs represent Strong Efficiency of the overseas investment with an efficiency=1. This shows relatively favorable overseas investment efficiency. Ten DMUs, namely 48 per cent of all DMUs reveal an overseas investment efficiency between 0.9 and 1 as a marginal inefficiency. This shows the relative overseas investment efficiency as being easily promoted. Eight DMUs which represent 38 per cent of the total DMUs appear with an overseas investment efficiency of less than 0.9 as a distinct inefficiency. Of these FoxLink shows the lowest overseas investment efficiency of 0.73. The DEA results show that many hightech businesses do not achieve scale efficiency and should reconsider and adjust their inputs so as to enhance their competitiveness. It is therefore recommended that business save their production costs and invest in quality R&D which will lead to innovative ways to enhance production efficiency. It is also good to aim for new processes, new products, or creation of new materials to create higher revenue, and to integrate global information of markets so that the business operation can compete more efficiently internationally and achieve sustainable development. It is also suggested that government formulate policies encouraging relevant industries to constantly research and develop to assist industries in innovative development for sustainable management.
Acknowledgements
This paper is supported by "central government special Fund for Quantitative Economics Key Discipline of China" (Project No.12C14093) MOE (Ministry of Education in China) "Project of Humanities and Social Sciences" (Project No. 11YJA790048), "Soft Science Research Project of Fujian Province, China" (Project No. 2012R0058).
The authors are grateful to the valuable comments made by the reviewers.
References
CHANG, CHUNG-CHAO 2007. Relations among production technology stiffness, industrial environment certainty, and business competitive strategies. Management Review, 6:180-193. [ Links ]
CHARNES A., COOPER W.W. & RHODES, E.L. 1978. Measuring the efficiency of decision making units, European Journal of Operational Research, 2(6):429-444. [ Links ]
CHEN, CHIH-YUAN. 2009. The factors affecting activity-based costing system adoption by the CPA firms in Taiwan. Journal of Business Administration, 67:71-103. [ Links ]
CHEN, MEI-FANG. 2004. Effects of listed electrical businesses investing in China on the mother company in Taiwan. Journal of National Chengchi University, 3:162-183. [ Links ]
CHEN, YI-CHH. 2003. The performance appraisal of S&T research organizations. Research and Evaluation Bimonthly, 27(5):62-79. [ Links ]
DEDRICK, J. & KRAEMER, K.L. 1998. Asia's computer challenge: Threat or opportunity for the U.S and the world, N.Y.: Oxford University: 146. [ Links ]
DELANEY, J. & HUSELID, M. 1996. The impact of human resource management practices on perceptions of organizational performance. Academy of Management Journal, 39:949-64. [ Links ]
ECCLES, R.G. & PYBURN, P.J. 1992. Creating a comprehensive system to measure performance. Management Accounting, 74(4):41-44. [ Links ]
FREMONT, A., SHULL, J.R., DELBECG, A.L. & CURMINGS, L.L. 1970. Organizational decision making, McGraw-Hill:151. [ Links ]
KUNG, LIANG-CHIH 2009. Applying DEA to the efficiency evaluation of Taiwan Electric Power Company distribution system. Chiao Da Management Review, 3(2):109-117. [ Links ]
LEE, SHUANG-CHIEH, WANG, HAI-YEN & LIU, JEN. 2006. DEA-based manufacturing technology innovation resource allocation efficiency, Industrial Technology & Economy, 25(3):112-115. [ Links ]
LEE, SHU-HSIN. 2005. Process and results, individual and group-practical strategic performance evaluation. Accounting Research Monthly:113. [ Links ]
MA, CHENG-HIS. 2010. The relative efficiency evaluation of military supply units. Taiwan Economics, 251: 1-14. [ Links ]
MINISTRY OF ECONOMIC AFFAIRS. 2012. Ministry of Economic Affairs Statistics Database, Export value of Taiwan Hi-Tech industries (millions US$). Available at: http://www.moea.gov.tw/~meco/stat/index.html [accessed March 2012]. [ Links ]
PAI, MEI-NA. 2005. The impacts of mainland China investment scale on financial performance, using listed motherboard and PC board companies as examples. Economic Situation and Review Quarterly:58-78. [ Links ]
SU, RUI-XING. 2009. Management strategies for Taiwan electrical industry investing in China. Taiwan Economic Review, 30(2):175-204. [ Links ]
WANG, HUAI. 2009. PRC market entry mode of Taiwanese small-medium enterprises. The Journal of Chaoyang University of Technology, 1:211-238. [ Links ]
* Corresponding author contact: Chich-Jen Shieh, charles@mail.cjcu.edu.tw

