


Serviços Personalizados
Artigo
 Inglês (pdf)
 Artigo em XML
 Referências do artigo
Indicadores

Links relacionados
-
 Citado por Google
 -
 Similares em Google
Compartilhar

 Permalink
South African Journal of Economic and Management Sciences
versão On-line ISSN 2222-3436
versão impressa ISSN 1015-8812
S. Afr. j. econ. manag. sci. vol.16 no.5 Pretoria 2013
A Weighted linear combination ranking technique for multi-criteria decision analysis
Jyh-Rong Chou*
Department of Creative Product Design, I-Shou University, Kaohsiung 84001, Taiwan, ROC
ABSTRACT
Multi-criteria decision analysis (MCDA) is an alternative approach, which provides a way to systematically structure and analyse complex decision problems. This study presents a novel method of applying the weighted linear combination ranking technique (WLCRT) to MCDA. The proposed WLCRT method is based on the linear combinations of matrix algebra calculations. It has distinct advantages in preference modeling, weight elicitation, and aggregation performance. In this method, the decision matrix of preferences is constructed using a 7-point Likert scale. The weights of criteria are elicited from the proximity matrix of preference relations using the eigenvector method. Then, the weighted generalised means are used to aggregate preference information as well as to rank the order of decision alternatives. The WLCRT method can flexibly reflect different decision attitudes for the decision maker. It is both technically valid and practically useful, and can be used in dealing with multiple criteria analysis problems involving ranking of alternatives.
Key words: multiple criteria analysis; weighted linear combination, ranking of alternatives, eigenvector method, weighted generalized means, decision, aggregated values, simple additive weighting, technique, optimisation
JEL: C020
1 Introduction
Human performance in decision terms has been the subject of active research. Decision analysis is the study of identifying and choosing alternatives based on the values and preferences of the decision-maker. It can be regarded as the mental/cognitive process of sufficiently reducing uncertainty and doubt about alternatives to allow a reasonable choice to be made from among them. Many real-world decision situations involve multiple attributes in qualitative domains. Such situations can be modeled as a multi-criteria decision analysis (MCDA) problem that involves making numerous and sometimes conflicting evaluations to come to a compromise in a transparent process. MCDA is both an approach and a set of techniques with the goal of providing an overall ordering of options. In MCDA, values reflect human preferences and in particular the preferences of the decision maker involved in the specific decision context. MCDA have undergone an impressive development over the last 40 years. There are many different MCDA methods based on different theoretical foundations, such as optimisation, goal aspiration, outranking, or a combination of these. Various sophisticated methods have been developed and used, which include the simple multi-attribute rating technique (SMART) (Edwards, 1971), the analytic hierarchy process (AHP) (Saaty, 1980), the technique for order preferences by similarity to ideal solutions (TOPSIS) (Hwang & Yoon, 1981), the ELECTRE methods (Roy, 1968), and the PROMETHEE methods (Brans, Vincke & Mareschal, 1986). A detailed analysis of the theoretical foundations of different MCDA methods and their comparative strengths and weaknesses has been presented in the literature (Mollaghasemi & Pet-Edwards, 1997; Belton & Stewart, 2002).
There are many ways to classify MCDA methods. According to the assumptions of preference elicitation and aggregation, MCDA methods can be divided into two broad categories. One refers to multi-attribute utility theory (MAUT) methods (e.g. SMART); the other refers to outranking methods (e.g. the ELECTRE methods and the PROMETHEE methods). Outranking methods are based on the principle that one alternative may have a degree of dominance over another (Kangas, Kangas, Leskinen & Pykalainen, 2001), rather than the supposition that a single best alternative can be identified. Outranking is considered a partially compensatory technique that does not rely upon optimisation. The ordering of alternatives provided by outranking methods may be incomplete since the methods allow for intransitivities in criteria weightings and for alternatives that are not considered comparable. MAUT methods aim to associate a unique number (value) representing the overall strength of each alternative, taking all criteria into account. The basis of MAUT is the use of utility functions, whose purpose is to create a mathematical model to aid the decision process. The utility theory is used in decision analysis to transform the raw performance values of the alternatives against diverse criteria to a common dimensionless scale (Keeney & Raiffa, 1976). It gives decision makers the ability to quantify the desirability of certain alternatives and brings together different considerations in a structured way. Compared with outranking methods, MAUT methods present the advantage of simplicity and transparency, leading to a complete ranking of all the alternatives based on the decision-maker's preferences.
MCDA is concerned with structuring and solving decision problems involving multiple criteria and numerical analysis of a set of discrete alternatives. It generally consists of three main operations, namely preference modeling, weight elicitation, and aggregation. Preference modeling focuses on capturing the decision maker's preferences for the specific decision context. There are two types of preferences, namely intra-criterion preferences and inter-criterion preferences. The former is judgements that refer to relative values attached to different levels of performances, while the latter is judgements that refer to the relative importance attached to the information carried by each single criterion. The values of judgements can be in ordinal, interval, or ratio scales. Ordinal scales on the overall preference values are sufficient if only the best alternative needs to be selected (Choo, Schoner & Wedley, 1999). Decision problems involve criteria of varying importance to decision makers. The criteria weights usually provide the information about the relative importance of the considered criterion. Criteria weighting is a complex preference elicitation process, which can be classified in different ways (e.g. algebraic or statistical, decomposed or holistic, direct or indirect, and compensatory or noncompensatory). A variety of different methods for determining criteria weights in MCDA have been developed, such as swing method (Von Winterfeldt & Edwards, 1986), trade-off method (Keeney et al., 1976), AHP (Saaty, 1977), SMART (Edwards, 1971), and MACBETH (Bana E Costa & Vansnick, 1994). Many researchers have conducted comparisons among different weighting methods (Hobbs, 1980; Schoemaker & Waid, 1982; Barron & Barrett, 1996; Yeh, Willis, Deng & Pan, 1999), and most research has found that different methods yield different weights (Belton, 1986; Borcherding, Eppel & Winterfeldt, 1991; Olson, Moshkovich, Schellenberg & Mechitov, 1996; Pöyhönen & Hämäläinen, 2001). The criteria weights are generally treated as deterministic, and are usually determined on a subjective basis. The uncertainty in the elicited weights can influence the resultant ranking of alternatives. Therefore, the procedures for deriving criteria weights should not be independent of the manner they are used, and should be taken into consideration as part of the decision analysis process (Rios Insua, 1990; Wolters & Mareschal, 1995).
Aggregation refers to the process of combining several numerical values into a single one, so that the final result of aggregation takes into account in a given manner all the individual values. In MCDA, aggregation operators are used to aggregate the different values of the utility functions. MAUT methods include different aggregation models, but the most used one is the additive model. Additive aggregation is based on the mathematical concept of weighted means. However, different weighted versions (e.g. weighted arithmetic mean, weighted geometric mean, and weighted harmonic mean) may produce different aggregation results. Some performance values in MCDA problems are often subjective and changeable.
Aggregation could yield inconsistent results, since the weights of criteria and the scoring values of alternatives against the judgemental criteria always contain some uncertainties. It is an important issue how the final ranking or the ranking values of the alternatives are sensitive to the changes of some input parameters of the decision problem (Triantaphyllou & Sanchez, 1997; Memariani, Amini & Alinezhad, 2009). Sensitivity analysis is a fundamental concept in the effective use and implementation of quantitative decision models. The purpose of sensitivity analysis is to assess the stability of an optimal solution under changes in the parameters. By knowing which criteria are more critical and how sensitive the actual ranking of alternatives is to changes on the current criteria weights, the decision-makers can more effectively pay attention to the most critical ones. They can also make better decisions to the given MCDA problem (Evans, 1984; Rios Insua & French, 1991; Ríos Insua, 1999).
The aim of this study is to develop a novel weighted linear combination technique for ranking decision alternatives. It is used as a quantitative decision method to assist decision-makers in dealing with MCDA problems. The proposed weighted linear combination ranking technique (WLCRT) is based on the linear combinations of matrix algebra calculations. It is formulated from a decision matrix of preferences, and the criteria weights are elicited from the proximity matrix of preference relations, using the eigenvector method. The weighted generalised means are then used to aggregate preference information, as well as to rank the order of decision alternatives. The remainder of this paper is organised as follows. Section 2 introduces the theoretical foundations. Section 3 describes the WLCRT method, and Section 4 presents an example to illustrate the practicability of the proposed method. The discussion and conclusions are drawn in Section 5 and Section 6, respectively.
2 Theoretical foundations
In this section, some important fundamentals that are used in the proposed method (see Section 3) are addressed. These fundamentals include the distance correlation and proximity matrix, eigenvectors and criteria weights, and aggregation and weighted generalized means.
2.1 Distance correlation and proximity matrix
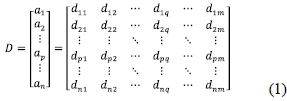
MCDA problems usually involve the ranking of a finite set of alternatives in terms of a finite number of decision criteria. Consider a decision problem with m criteria and n alternatives. Let c1,c2 ...,cm and a1,a2, ...,an denote the criteria and alternatives, respectively. The MCDA problem under consideration is depicted by a decision matrix of preferences shown in Eq. (1). The score dpqdescribes the performance of alternative apagainst criterion cq, where a higher score value means a better performance according to the goal of maximization.
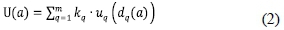
In MAUT, a multi-attribute utility function describes the preferences of the decision maker. It is dependent on the axioms of preferential, utility, and additive independence for normative decision-making. The additive model is the most used MAUT method, which can be formulized as follows:
where
U(a) is the global utility value of alternative a;
dq(a) is the performance value of alternative a against criterion q;
uq (dq(a)) is the local utility value reflecting the performance of alternative a for criterion q;
kqis a scaling constant that reflects the importance of criterion q within the decision context.
The multi-attribute utility function U is a linear combination of uq. In statistics, canonical correlation analysis is a way of making sense of cross-covariance matrices and a procedure for assessing the relationship between two sets of variables (Hotelling, 1936). It identifies linear relationships that describe a maximum correlation between the two data sets, namely predictor and response sets. The predictor set includes variables that describe the cause of changes in the analyzed systems, whereas the response set consists of variables that show the effect of these changes upon that system. The determination of linear combinations that possess a maximum correlation is important for the analysis of common features in both data sets (Tishler and Lipovetsky, 1996, Hardoon et al., 2004). Suppose that there are two sets of variables organized in matrices as x = [x1x2...xp] and y = [y1y2...yq]. The object of canonical correlation analysis is to find the largest possible correlation of linear combinations x1* = aT1x and y1* = bT1y, where
a1= [a11a12...a1p] and b1= [b11b12...b1q]. Such linear combinations can give insight into the relationships between the two sets of variables.
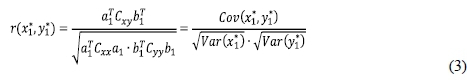
Let Cxxbe the covariance matrix of the x set of variables, Cvvbe the covariance matrix of the y set of variables, and Cxvbe the covariance matrix of x and y, where Cxxand Cvvare the within-sets covariance matrices and Cxvis the between-sets covariance matrix. The correlation between variables x1*and y1* is then given by (Kursun et al., 2011):
where
 Cov(x1*,y1*)is the covariance of x1*and y1*
 is the variance of x1*
 is the variance ofy1*
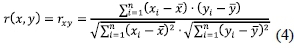
Letting S be a vector space, with x and y being n-dimensional vectors within S, Eq. (3) can then be rewritten as:
where

Eq. (4) is the well-known Pearson correlation coefficient defined as the covariance of the two variables divided by the product of their standard deviations. The Pearson correlation coefficient can be used as a distance metric between two vectors (x and y). The distance correlation analysis is a procedure for calculating any of a wide variety of statistics measuring either similarity or dissimilarity between pairs of variables. It can be used to show the interaction between decision criteria. When the Pearson correlation coefficient is used to measure the similarity of pairwise distances, it is regarded as a similarity function for measuring the global relations among criteria.
The correlation coefficients between m criteria can form to an mxm proximity matrix, Rmxm, which satisfies the following properties: (1) Non-negativity: 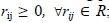 ; (2) Reflexitivity:
  (3) Symmetry:
  and (4) Transitivity: if r12 > r23 and r23 > r34 then r12 > r34, r12, r23, r34 € R. The coefficient rij represents the similarity correlation of preferences between two criteria (i and j). It can be used to determine the local priority of criteria by selecting the most similar preferences. For example, if r12 > r13 > r14, then criterion 2 is more important than criterion 3 and criterion 4 in terms of the performance of alternative 1.
2.2 Eigenvectors and criteria weights
Eigenvalues are a special set of scalars associated with a linear system of equations (i.e., a matrix equation) that are sometimes also referred to as characteristic roots, characteristic values (Hoffman & Kunze, 1971), proper values, or latent roots (Marcus & Minc, 1988). They can be used for a covariance matrix to convert a set of observations of possibly correlated variables into a set of principal components. Technically, a principal component can be defined as a linear combination of optimally-weighted observed variables.
Given a linear transformation R, a non-zero vector wis defined to be an eigenvector of the transformation if it satisfies the eigenvalue equation Rw=λw for some scalar λ. In this situation, the scalar λis called an eigenvalue of R corresponding to the eigenvector w (Kublanovskaya, 1961). Letting Rbe an mxm proximity matrix with eigenvalue λ, the corresponding eigenvectors satisfy:
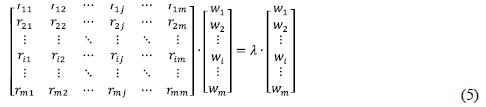
which is equivalent to the homogeneous system:
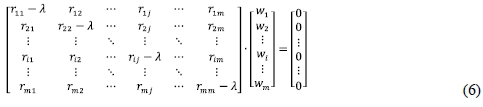
Eq. (6) can be written compactly as (R - λT) · W = 0, where I is the identity matrix. According to the eigen decomposition, the diagonal matrix constructed from the corresponding eigenvalues can be expressed as:

where
W is a matrix composed of the eigenvectors of the proximity matrix R;
W1is the matrix inverse of W.
The eigenvector method provides m sets of possible solutions to the linear combination problem of preference relations (m eigenvalues and each eigenvalue corresponding to m eigenvectors). It can be used to derive the global priority of criteria through determining the most significant relationship between preference dimensions. The weights of criteria represent the priority (or importance) of the principal diagonal components within the covariance matrix. They can be elicited by calculating the absolute values of the eigenvectors wicorresponding to the maximum eigenvalue λmax. This weighting method was proposed by the author, which has proven to be useful in related research areas (Chou, 2011; 2012). The larger the weight, the greater is the respective criterion's unique positive contribution to the whole preference relations.
2.3 Aggregation and weighted generalized means
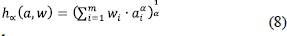
Aggregation refers to the process of synthesizing a collection of numerical values into a unique representative or meaningful value in order to come to a conclusion or a decision. An aggregation operator is generally defined by a function h : [0,1]n → [0,1], which is usually a continuous and symmetric function (Klir & Folger, 1988; Smoliková & Wachowiak, 2002). The monotonicity of the aggregation operator is a crucial issue which involves constraints on the derivative of the weighted aggregation operator with respect to the various attribute preference values. The weighted aggregation based on MAUT is well-known in the literature (Calvo et al., 2002; Ribeiro & Marques Pereira, 2003; Xu & Da, 2003; Yan et al., 2011). When it is desirable to accommodate variations in the importance of individual aggregated sets, the function h can be generalized into weighted generalized means (WGMs), also known as the weighted root-mean-power (Ghiselli Ricci & Mesiar, 2011), as defined by the formula:
where
aiis the preference value of attribute i, 0 < a, < 1;
wiis the weight of attribute i that represents the relative importance of the aggregated set,  is a non-zero real number,
The WGMs are continuous but not symmetric. They are monotonic increasing with  . For
. For  , the function
  is the weighted arithmetic mean operator h1(a,w). When
  approaches
  , the limit of the function
  becomes the weighted geo-metric mean operator h0(a,w); at
  is the weighted harmonic mean operator. The parameter
  plays an important role in the aggregation operation. By varying the κ para-meter within the interval of
  , a homologous
  value can be derived; the
  curves can then be plotted. As shown in Figure 1, there are three sets of decision alternatives. If
  , the maximum of
  is Alternative 2; if
  , the maximum of
  is Alternative 3. For a more precise comparison, the average
  of each alternative must be solved.
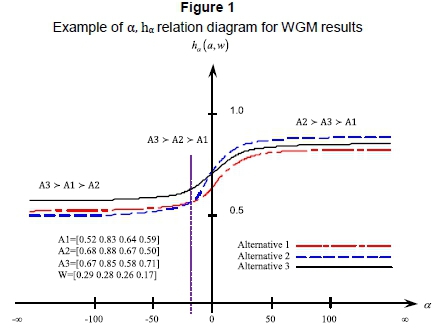
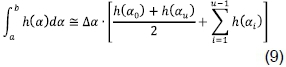
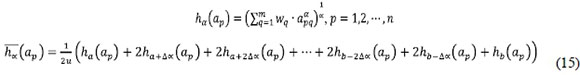
It can be observed in Figure 1 that the curve levels out as it approaches either positive infinity or negative infinity. Hence, the trapezoidal rule associated with the mean value theorem for integrals is used to calculate the average of  . The trapezoidal rule is used for numerical integration. It works by approximating the region under the graph of the function h(a) by a trapezoid, whose area is then calculated. As shown in Figure 2, suppose that the interval [a,b] is split up into u subintervals. The composite trapezoidal rule is then given by
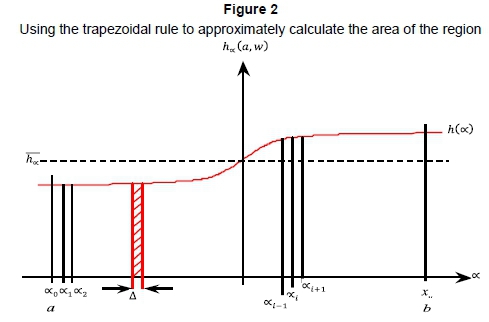
where
a.i = a + (i-∆α), for I =1,2, ..., u - 1
α0 = a, au = b; a + b = 0;Δα = (b - a)/u
Eq. (9) can be rewritten as:
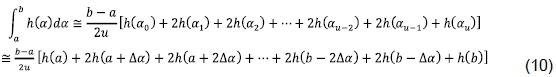
Using the mean value theorem for integrals, the average of  can be obtained as:
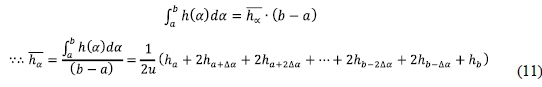
Eq. (11) can be used to rank the decision alternatives as well as to accurately find the most desirable alternative(s) from the given alternative set. The higher the  value, the better is the decision alternative.
3 Outline of the weighted linear combination ranking technique(WLCRT)
Based on the theoretical foundations given in Section 2, the implementation steps of the WLCRT are described as follows:
Step 1: Identify the decision context
In the first step, decision-makers have to establish the objectives of the MCDA, choose the alternatives to be evaluated, and determine criteria for evaluating the consequences of each alternative.
Step 2: Construct a decision matrix
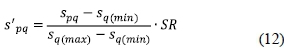
Judgements involve attitudinal assessments of human cognitive behavior. In case the evaluation is derived from real statistics, numerical data can be converted into a comparable scoring scale through standardising the original data. The most commonly adopted methods are based on distance measurement using the maximum and minimum values as scaling scores. The standardisation is formularised as:
where
spqis the raw datum of alternative p against criterion q;
sq(max)is the maximum datum and sq(min)is the minimum datum of all the alternatives against criterion q;
SR is the standardized range used to convert the score from within the interval [0,1] to within the interval [0.1,0.9].
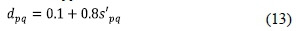
According to the linear interpolation method, the score dpqcan be derived as:
Step 3: Elicit the criteria weights
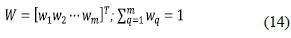
By substituting the scoring data of the decision matrix into Eq. (4) to perform the Pearson distance correlation analysis in pairs, a proximity matrix of the similarity measures can be obtained. Using eigenvalue algorithms (see Section 2.2), a set of eigenvalues and their corresponding eigenvectors can be derived. By calculating the absolute values of the eigenvectors corresponding to the maximum eigenvalue, a set of the priorities of the principal diagonal components can be obtained. Further normalising these values, a set of weights corresponding to the criteria is elicited as:
Step 4: Aggregate the preference information and rank the decision alternatives
Based on Eqs. (8) and (11), the weighted aggregation operator is expressed as follows:
where
 represents the aggregated value of the pth alternative;
The aggregation operator is used to synthesise the weight sand scores for each alternative in order to derive an overall utility value. Numerical integration operations (see Section 2.3) are used to obtain a set of aggregated values, which are then used to rank the order of decision alternatives. The higher the value, the better is the decision alternative.
Step 5: Sensitivity analysis
Sensitivity analysis is an important task in MCDA. It applies post-hoc analyses to a quantitative decision model, and deals with uncertainties related to how sensitive the alternative ranking is to the changes in criteria weights. In an MCDA problem, if the weight of criterion i changes by ∆i, then the weights of other criteria change as (Memariani et al., 2009)
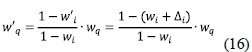
where
wiis one of the original weights, and w'iis its new weight;
By cumulatively increasing or decreasing the value of ∆i, a number of new sets of criteria weights can be obtained. Using the new set of weights to perform the above aggregation operation iteratively, we can identify the criterion for which the smallest change of current weight may alter the existing ranking of alternatives.
4 Illustrative example
A decision analysis example is used in this section to illustrate the proposed method. The aim of this example is to assess the competitiveness of the cultural and creative sector in Europe.
4.1 Identification of the decision context
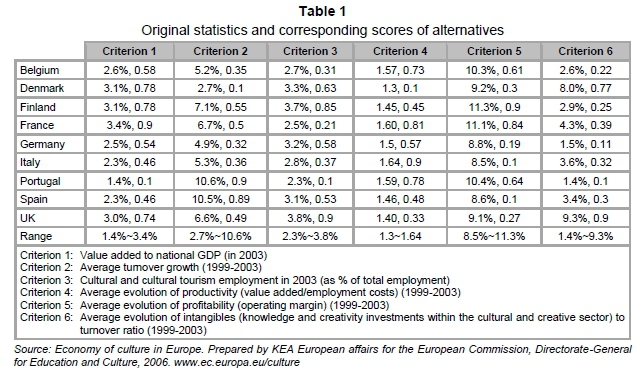
The cultural and creative sectors foster creativity and contribute to innovation in other sectors of the economy. The main objective of this decision problem is to assess which countries are most competitive in terms of the cultural and creative sector. The decision criteria include six items: (1) value added to national GDP, (2) average turnover growth, (3) cultural and cultural tourism employment, (4) average evolution of productivity, (5) average evolution of profitability, and (6) average evolution of intangibles to turnover ratio. Nine countries were selected from the EU 25 as alternatives, which include Belgium, Denmark, Finland, France, Germany, Italy, Portugal, Spain, and the UK.
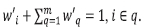
4.2 Construction of the decision matrix
According to the published statistics collected by KEA European Affairs (2006), the raw data are classified and listed in Table 1. Using Eqs. (12) and (13), the corresponding scores of alternatives against each criterion were derived. The decision matrix was constructed as below:
4.3 Elicitation of criteria weights
MCDA problems are usually modeled by choosing a set of criteria that characterise a finite number of alternatives, and by eliciting their relative importance or weights. The process of weighting involves emphasising some aspects of a set of data-giving them 'more weight' in the final result. Substituting the above scoring data into SPSS software to perform the Pearson distance correlation analysis yields the following proximity matrix:
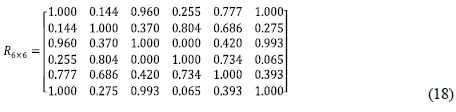
Using eigenvalue algorithms, the following set of eigenvalues is obtained:
λ = [3.7071.880 0.503 - 0.220 - 0.028 0.159].
The eigenvectors corresponding to the maximum eigenvalue λmax= 3.707 are 0.49, 0.321, 0.448, 0.269, 0.429, and 0.447. By normalizing these values, the criteria weights were elicited as follows:

The result shows that criterion 1 (value added to national GDP) has the highest importance whereas criterion 4 (average evolution of productivity) has the lowest importance regarding the desired objective.
4.4 Ranking of decision alternatives
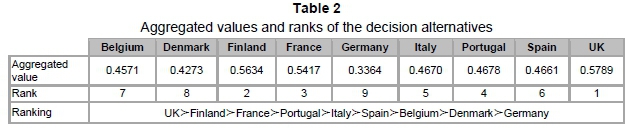
Let a = -100, b = 100, and u = 1 000. The data of matrices (17) and (19) were substituted into Eq. (15) to calculate the WGMs. The set of obtained aggregated values is shown in Table 3. The nine alternatives were ranked as follows:
UK>Finland>France>Portugal>Italy>Spain >Belgium>Denmark>Germany, where the symbol ">" means "is superior to". The UK, Finland, and France in order have the most competitive cultural and creative sectors in Europe. It is worth noting that the UK is slightly superior to Finland according to the aggregated values. However, Finland is better than the UK in terms of the traditional arithmetic mean (MFinland=0.63>MUK=0.605) or weighted mean (WMFinland=0.648>WMUK=0636) results. This divergence of ordering can be explained by Figure 1, which is due to the WGM aggregation that flexibly reflects different decision attitudes in the evaluation.
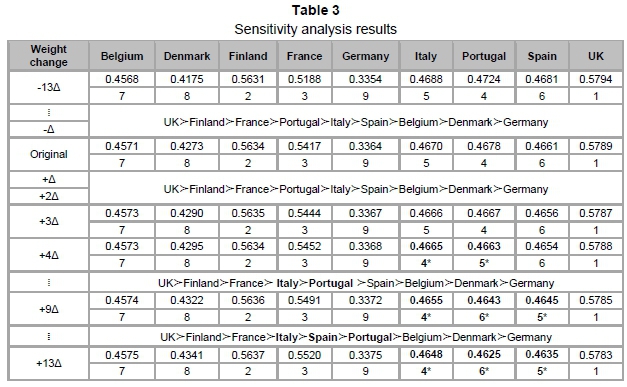
4.5 Sensitivity analysis
As shown in Table 4, the ranking of alternatives is altered when we change the weight of criterion 1 by +4Δ, where Δ=0.015 and the new set of criteria weights is 0.264, 0.124, 0.172, 0.104, 0.164, and 0.172. In case the weight of criterion 1 is changed by +9Δ, the alteration of ranking increases from two alternatives (Italy and Portugal) to three alter-natives (Italy, Portugal, and Spain). However, the ranking of both the first three and last three alternatives is not changed in this decision case.
5 Discussion
Weighted linear combination (WLC), also referred to as simple additive weighting (SAW), is probably the most used MCDA method. Although it has the ability to give different relative weights to each of the criteria by aggregation, there are some fundamental limitations in the use of traditional WLC method (Jiang & Eastman, 2000; Drobne & Lisec, 2009). This paper presents a novel MCDA method for ranking decision alternatives. The proposed weighted linear combination ranking technique (WLCRT) is based on the linear combinations of matrix algebra calculations. It has distinct advantages in preference modeling, weight elicitation, and aggregation performance. The theoretical and practical implications of the WLCRT method are discussed below.
In MCDA, prioritisation of the decision matrix is a core issue that influences the final decision result. Saaty (1980) advocated the use of the eigenvector method for deriving the weights from a given pairwise comparison matrix (a positive reciprocal matrix). In this method, decision-makers must ensure all judgements are to be consistent. Besides, it requires the solution of a set of nonlinear eigenvalue equations which is somewhat complicated and inconvenient for use (Wang & Chin, 2011). Previous research has also found that the priority vector in AHP derived from the eigenvector method can violate a condition of order preservation (Bana E Costa & Vansnick, 2008). Distance-based optimisation plays an important role in deriving criteria weights (Hwang et al., 1981; Hyde, Maier & Colby, 2005; Yu & Lai, 2011). The proposed WLCRT method uses a proximity matrix derived from the distance correlation measures of global scoring relations. It can be regarded as a covariance matrix of the standardised random variables that possesses the properties of non-negativity, reflexitivity, symmetry, and transitivity. Making use of the eigenvalue algorithm, we can derive a set of weights from the optimally weighted observed variables. The weights corresponding to the criteria are sound as they are elicited from the principal diagonal components within the covariance matrix. They can reasonably reflect the respective criterion's unique positive contribution to the whole preference relations, giving a valid process of weighting for the MCDA.
The simple additive weighting (SAW), an additive aggregation using the weighted mean operator, is commonly used to synthesize evaluation results as well as to rank the decision alternatives. This method generates a so-called Pareto-optimal agreement for one issue, independent of the specific weights attached to the individual preferences (Chwolka & Raith, 2001). Although the SAW is an easy and intuitive compensatory technique, it can yield invalid ranking of alternatives as evidenced in the illustrative examples. In practice, an aggregation operator for MCDA should not only consider both the relative importance of the criteria and its own achieved performance, but should also convey the
influence of the decision maker's evaluation attitudes. For example, if one takes a more open attitude in evaluation, the operator should give a higher aggregated index toward the maximum value that the operator can produce  . In contrast, if the evaluation attitude of the decision maker is rigorous or conservative, the operator should be toward a minimum aggregation
  (Guh et al., 2008). The proposed WLCRT method uses WGMs to aggregate preference information. The WGM operator converts a set of discrete preference data into a continuous utility function. It can flexibly reflect different decision attitudes for the decision maker. By varying the
  parameter within the interval of
  , a homologous aggregation value can be derived based on a multi-criteria analysis. The numerical integration technique is used to facilitate the calculations of the continuous utility function. The proposed method can be used to objectively rank the decision alternatives as well as to accurately identify the most desirable alternatives.
6 Conclusions
Most MCDA problems can be depicted as a matrix format, and the commonly-used additive model of a multi-attribute utility function can be considered a linear combination of its utility values. This study presents a novel method of applying the weighted linear combination ranking technique (WLCRT) to MCDA. The proposed method is based on the linear combinations of matrix algebra calculations. It is formulated from a decision matrix of preferences using a 7-point Likert scale scoring, or a standardising scale of the existing statistics. Based on the linear combination of optimally-weighted observed variables of the covariance matrix, the criteria weights are elicited from the proximity matrix of preference relations, using the eigenvector method. The weighted generalised means (WGMs) are then used to aggregate preference information as well as to rank the order of decision alternatives.
This study uses the WGMs as the aggregation operator to perform preference aggregation. In practice, the proposed method considers the relative importance of criteria, and conveys the influence of the decision-maker's evaluation attitudes. It can flexibly reflect evaluation attitudes as open, neutral, or rigorous. The sensitivity analysis results have shown that the WLCRT is more stable and credible in ranking alternatives than the SAW model. In conclusion, this study contributes to our knowledge in MCDA by providing a valid weighting method associated with an effective aggregation operation. This method is both technically valid and practically useful. As sensitivity analysis usually involves an iterative post-hoc procedure, further research could focus on developing a systematised and formularised approach to sensitivity analysis for the WLCRT method.
Acknowledgements
This research was partially supported by the National Science Council of Taiwan under grant NSC 102-2221 -E-214-041.
The authors are grateful to the valuable comments made by the reviewers.
References
BANA E COSTA, C. & VANSNICK, J.C. 1994. MACBETH: An interactive path towards the construction of cardinal value functions. International Transactions in Operational Research, 1(4):489-500. [ Links ]
BANA E COSTA, C.A. & VANSNICK, J.C. 2008. A critical analysis of the eigenvalue method used to derive priorities in AHP. European Journal of Operational Research, 187:1422-1428. [ Links ]
BARRON, F.H. & BARRETT, B.E. 1996. Decision quality using ranked attribute weights. Management Science, 42(11):1515-1523. [ Links ]
BELTON, V. 1986. A comparison of the analytic hierarchy process and a simple multi-attribute value function. European Journal of Operational Research, 26:7-21. [ Links ]
BELTON, V. & STEWARD, T.J. 2002. Multiple criteria decision analysis: An integrated approach. Kluwer Academic Publishers, Boston, MA. [ Links ]
BORCHERDING, K., EPPEL, T. & WINTERFELDT, D. 1991. Comparison of weighting judgements in multi-attribute utility measurement. Management Science, 37:1603-1619. [ Links ]
BRANS, J.P., VINCKE, P.H. & MARESCHAL, B. 1986. How to select and how to rank projects: The PROMETHEE method. European Journal of Operational Research, 24:228-238. [ Links ]
CALVO, T., MAYOR, G. & MESIAR, R. 2002. Aggregation operators: new trends and applications. Physica-Verlag, Heidelberg, NY. [ Links ]
CENTER FOR UNIVERSAL DESIGN, 1997. The principles of universal design, Ver. 2.0, North Carolina State University, Raleigh, NC. [ Links ]
CHOO, E.U., SCHONER, B. & WEDLEY, W.C. 1999. Interpretation of criteria weights in multi-criteria decision making. Computers & Industrial Engineering, 37:527-541. [ Links ]
CHOU, J.R. 2011. A Gestalt-minimalism-based decision-making model for evaluating product form design. International Journal of Industrial Ergonomics, 41(6):607-616. [ Links ]
CHOU, J.R. 2012. A linguistic evaluation approach for universal design. Information Sciences, 190:76-94. [ Links ]
CHWOLKA, A. & RAITH, M.G. 2001. Group preference aggregation with the AHP-implications for multiple-issue agendas. European Journal of Operational Research, 132:176-186. [ Links ]
DROBNE, S. & LISEC, A. 2009. Multi-attribute decision analysis in GIS: Weighted linear combination and ordered weighted averaging. Informatics, 33:459-474. [ Links ]
EDWARDS, W. 1971. Social utilities. Engineering Economist, Summer Symposium Series, 6:119-129. [ Links ]
EVANS, J.R. 1984. Sensitivity analysis in decision theory. Decision Sciences, 15:239-247. [ Links ]
GHISELLI RICCI, R. & MESIAR, R. 2011. Multi-attribute aggregation operators. Fuzzy Sets and Systems, 181(1):1-13. [ Links ]
GUH, Y.Y., PO, R.W. & E. LEE, S. 2008. The fuzzy weighted average within a generalized means function. Computers and Mathematics with Applications, 55:2699-2706. [ Links ]
HARDOON, D., SZEDMAK, S. & SHAWE-TAYLOR, J. 2004. Canonical correlation analysis: An overview with application to learning methods. Neural Computation Archive, 16 (12):2639-2664. [ Links ]
HOBBS, B.F. 1980. A comparison of weighting methods in power plant citing. Decision Sciences, 11:725-737. [ Links ]
HOFFMAN, K. & KUNZE, R. 1971. Linear ALGEBRA. Prentice-Hall, Englewood Cliffs. [ Links ]
HOTELLING, H. 1936. Relations between two sets of variates. Biometrika, 28:321-377. [ Links ]
HWANG, C.L. & YOON, K. 1981. Multiple attribute decision-making. Springer-Verlag, NY. [ Links ]
HYDE, K.M., MAIER, H.R. & COLBY, C.B. 2005. A distance-based uncertainty analysis approach to multi-criteria decision analysis for water resource decision making. Journal of Environmental Management, 77: 278-290. [ Links ]
JIANG, H. & EASTMAN, J.R. 2000. Application of fuzzy measures in multi-criteria evaluation in GIS. International Journal of Geographical Information Systems, 14(2):173-184. [ Links ]
KANGAS, J., KANGAS, A., LESKINEN, P. & PYKALAINEN, J. 2001. MCDM methods in strategic planning of forestry on state-owned lands in Finland: applications and experiences. Journal of Multi-Criteria Decision Analysis,10:257-271 [ Links ]
KEA EUROPEAN AFFAIRS, 2006. The economy of culture in Europe. Available at: http://www.keanet.eu/en/ecoculturepage.html [accessed October 2011]. [ Links ]
KEENEY, R. & RAIFFA, H. 1976. Decisions with multiple objectives: preferences and value tradeoffs. John Wiley & Sons, NY. [ Links ]
KLIR, G.J. & FOLGER, T.A. 1988. Fuzzy sets, uncertainty, and information. Prentice-Hall International, London. [ Links ]
KUBLANOVSKAYA, V.N. 1961. On some algorithms for the solution of the complete eigenvalue problem. USSR Computational Mathematics and Mathematical Physics, 3:637-657. [ Links ]
KURSUN, O., ALPAYDIN, E. & FAVOROV, O.V. 2011. Canonical correlation analysis using within-class coupling. Pattern Recognition Letters, 32:134-144. [ Links ]
MARCUS, M. & MINC, H. 1988. Introduction to Linear Algebra. Dover, NY. [ Links ]
MEMARIANI, A., AMINI, A. & ALINEZHAD, A. 2009. Sensitivity analysis of simple additive weighting method (SAW): The results of change in the weight of one attribute on the final ranking of alternatives. Journal of Industrial Engineering, 4:13-18. [ Links ]
MOLLAGHASEMI, M. & PET-EDWARDS, J. 1997. Making multiple-objective decisions. IEEE Computer Society Press, Los Alamitos, CA. [ Links ]
OLSON, D.L., MOSHKOVICH, H.M, SCHELLENBERG, R. & MECHITOV, A.I. 1996. Consistency and accuracy in decision aids: Experiments with four multi-attribute systems. Decision Sciences 26: 723-748. [ Links ]
Pöyhönen, M. & Hämäläinen, R.P. 2001. On the convergence of multi-attribute weighting methods. European Journal of Operational Research, 129:569-585. [ Links ]
RIBEIRO, R.A. & MARQUES PEREIRA, R.A. 2003. Generalized mixture operators using weighting functions: A comparative study with WA and OWA. European Journal of Operational Research, 145: 329-342. [ Links ]
RIOS INSUA, D. 1990. Sensitivity analysis in multi-objective decision making. 347 of Lecture Notes in Economics and Mathematical Systems, Springer-Verlag, Berlin. [ Links ]
RIOS INSUA D & FRENCH S. 1991. A framework for sensitivity analysis in discrete multi-objective decision-making. European Journal of Operational Research, 54:176-190. [ Links ]
RIOS INSUA, D. 1999. Introduction to the special issue on sensitivity analysis. Journal of Multi-criteria Decision Analysis, 8:117-118. [ Links ]
ROY, B. 1968.Classementetchoix en présence de points de vue multiples (la méthodeELECTRE). Revue Françaised' Informatique et de RechercheOpérationnelle, 8:57-75. [ Links ]
SAATY, T.L. 1977. A scaling method for priorities in hierarchical structures. Journal of Mathematical Psychology, 15:234-281. [ Links ]
SAATY, T.L. 1980. The analytic hierarchy process. McGraw-Hill, NY. [ Links ]
SCHOEMAKER, P.J.H. & WAID, C.D. 1982. An experimental comparison of different approaches to determining weights in additive utility models. Management Science, 28:182-196. [ Links ]
SMOLÍKOVÁ, R. & WACHOWIAK, M.P. 2002. Aggregation operators for selection problems. Fuzzy Sets and Systems, 131:23-34. [ Links ]
STORY, M.F. 1997. Is it universal? 7 Defining criteria. Innovation, 16:29-32. [ Links ]
TISHLER, A.G. & LIPOVETSKY, S. 1996. Canonical correlation analyses for three data sets: a unified framework with application to management. Computers & Operations Research, 23:667-679. [ Links ]
TRIANTAPHYLLOU, E. & SÁNCHEZ, A. 1997. A sensitivity analysis approach for some deterministic multi-criteria decision making methods. Decision Sciences, 28 (1):151-194. [ Links ]
VON WINTERFELDT, D. & EDWARDS, W. 1986. Decision analysis and behavioural research. Cambridge University Press, London. [ Links ]
WANG, Y.M. & CHIN, K.S. 2011.A linear goal programming approach to determining the relative importance weights of customer requirements in quality function deployment. Information Sciences, 181: 5523-5533. [ Links ]
WOLTERS, W.T.M. & MARESCHAL, B. 1995. Novel types of sensitivity analysis for additive MCDM methods. European Journal of Operational Research, 81:281-290. [ Links ]
XU, Z.S. & DA, Q.L. 2003.An overview of operators for aggregating in formation. International Journal of Intelligent Systems, 18:953-969. [ Links ]
YAN, H.B., HUYNH, V.N., NAKAMORI, Y. & MURAI, T, 2011. On prioritized weighted aggregation in multi-criteria decision making. Expert Systems with Applications, 38:812-823. [ Links ]
YEH, C.H., WILLIS, R.J., DENG, H. & PAN, H. 1999. Task oriented weighting in multi-criteria analysis. European Journal of Operational Research, 119:130-146. [ Links ]
YU, L. & LAI, K.K. 2011.A distance-based group decision-making methodology for multi-person multi-criteria emergency decision support. Decision Support Systems, 51:307-315. [ Links ]
* Corresponding author contact: Jyh-Rong Chou, jrchou@isu.edu.tw

