


Serviços Personalizados
Artigo
 Inglês (pdf)
 Artigo em XML
 Referências do artigo
Indicadores

Links relacionados
-
 Citado por Google
 -
 Similares em Google
Compartilhar

 Permalink
South African Journal of Economic and Management Sciences
versão On-line ISSN 2222-3436
versão impressa ISSN 1015-8812
S. Afr. j. econ. manag. sci. vol.16 no.2 Pretoria Jan. 2013
ARTICLE
The cost-effectiveness of intervening in low and high HIV prevalence areas in South Africa
Josue Mbonigaba
School of Accounting, Economics and Finance, University of KwaZulu-Natal
ABSTRACT
This research compared the cost-effectiveness of a set of HIV/AIDS interventions in a low HIV prevalence area (LPA) and in a high HIV prevalence area (HPA) in South Africa. The rationale for this analysis was to assess the interaction dynamics between a specific HIV/AIDS intervention and an area of implementation and the effects of these dynamics on the cost-effectiveness of such an HIV/AIDS intervention. A pair of Markov models was evaluated for each intervention; one model for a HPA and another for an LPA and the cost-effectiveness of that intervention was compared across an LPA and a HPA. The baseline costs and health outcomes in each area were collected from the literature. To depict interaction dynamics between an HIV/AIDS intervention and an area of implementation, baseline health outcomes collected in each area, were adjusted over time based on the patterns of the projections observed in the AIDS model of the Actuarial Society of South Africa (ASSA2008). The study found that the VCT and treatment of STDs were equally cost-effective in an LPA and in a HPA while PMTCT and HAART were more cost-effective in an LPA than in a HPA. As a policy proposal, resources earmarked to non-ARV based interventions (VCT and treatment of STDs) should be equally shared across an LPA and a HPA while more of the resources reserved for ARV-based interventions (PMTCT and HAART) should go in an LPA in order to increase efficiency.
Key words: cost-effectiveness, LPA, HPA health outcomes, simulation, HIV/AIDS, interventions, Markov, prevalence, low, high, South Africa
JEL: I18
1 Introduction
Tailoring the HIV response to the contexts of the epidemic has been claimed to be one of the best responses to HIV/AIDS (Grassly, Garnett, Schwartlander, Gregson, & Anderson, 2001; Parker & Aggleton, 2002; Walker, 2003). To further efficiency, however, such a response is difficult, because of the concurrent influence of the characteristics of the contexts and interventions on costs and health outcomes. In the case of an LPA and a HPA, these complex relationships imply that the cost-effectiveness of interventions across the two areas is not obvious. In this regard, the paper simulates the costs, health outcomes and cost-effectiveness of a set of HIV/AIDS interventions in these areas in South Africa. These interventions are voluntary counselling and testing (VCT), treatment of sexually transmitted infections (STD), prevention of mother-to-child transmission (PMTCT), and highly active antiretroviral therapy (HAART).
Globally, HIV/AIDS has resulted in the deaths of about 40 million people since it became prevalent in the early 1980s (UNAIDS, 2010). Some 1.8 million people died from HIV/AIDS in 2009 and in the same year about 2.6 million people contracted new infections worldwide. A recent global report, however, suggests that the growth rate of HIV/AIDS deaths is stabilising (UNAIDS, 2010:16) as a result of the use of antiretroviral drugs. In 2010, in South Africa, more than 5 million people were living with HIV/AIDS and about 188,000 people died of AIDS in that year whilst about 116,000 new infections occurred (Actuarial Society of South Africa, ASSA2008 model). Though the impact of HIV/AIDS is still significant, these statistics suggest improvement in HIV outcomes since 2007, in which year 255,000 people died of HIV/AIDS (Actuarial Society of South Africa, 2011). The decrease in mortality is probably a result of recent major undertakings on the part of the South African government, to enhance prevention and treatment.
One of the most notable features of HIV/AIDS has been its differentiated impact across regions, gender, age groups, and income groups, in terms of new infections, prevalence and deaths. During 2009, 95 per cent of new infections occurred in developing countries. During the same period, sub-Saharan Africa accounted for 67 per cent of all new infections and 75 per cent of all HIV/AIDS-related deaths (UNAIDS, 2010) with the highest prevalence rates (18 per cent to 26 per cent) being found in countries in southern Africa (Alistar & Brandeau, 2010:1). In South Africa, the epidemic impacts to a greater extent on females and younger individuals, and in some provinces more than others (Actuarial Society of South Africa, 2011).
South Africa has made considerable progress in responding to HIV/AIDS, with more undertakings in 2007, and new guidelines in 2010 and 2011. The usual scarcity of resources implies that these undertakings necessitate new methods of intervention to achieve more outcomes with the limited resources. In this regard, this study proposes allocating resources according to how efficient the HIV/AIDS interventions are in the contexts. For some time now, there have been proposals to consider contexts of intervention in responses to HIV/AIDS (Grassly et al., 2001:1121). The rationale for these proposals was that an HIV inter-vention can have different success rates depending on where it is implemented. In fact, the extent to which an intervention succeeds depends on its net effect, between the risk factors and its own effect on reducing the impact. Risk factors are diverse, and range from structural factors (Parker, Easton & Allen, 2000; Pronyk, Hargreaves, Kim, Morrisson, Phetla, Watts, Busza & Porter, 2006; Pronyk, Kim, Abramsky, Phetla, Hargreaves, Morrisson, Watts, Busza & Porter, 2008; Raogupta, Parkhurst, Ogden, Aggleton, & Mahal, 2008) to epidemiological, environmental and cultural factors (Airhihenbuwa, 2004; Raogupta et al., 2008). Risk factors have been found to influence health theoretically and empirically through their influence on health-seeking behaviour and on attitudes towards health interventions (Bandura, 1986, Becker, 1974, Geoffard & Phillipson, 1996), and their linkage with culture (Airhihenbuwa, 2004). They are consequently expected to be at centre stage of the differences in new infections, sickness and deaths, even in the presence of HIV/AIDS interventions.
Calls to respond in particular contexts appear more relevant for South Africa. Indeed, South Africa is characterised by a diverse society, with diversity in income levels, and in relation to this paper, diversity in HIV/AIDS prevalence levels. Though a generalised HIV epidemic in South African implies a response targeting the general population (Whiteside & Smith, 2009: 3), prevalence levels in the general population have been consistently different across the provinces. Despite the heterogeneous nature of HIV spreading in South Africa, major HIV interventions undertaken have failed to account for how these interventions would fare in areas with different characteristics. In the context of limited resources to meet HIV/AIDS services demand, the question revolves around whether HIV/AIDS interventions could be more optimal in some areas of specific prevalence levels than in others, a question to be answered by hard evidence on costs and health outcomes in these areas.
2 Methods
To compare the cost-effectiveness of intervening in an LPA and a HPA with a set of interventions requires a follow-up of cohort patients for a specific period of time. It then involves recording costs and health outcomes, in different health states of the progression of HIV/AIDS, in each type of area, and adding up costs and health outcomes. Such a follow-up could be costly and would serve a limited purpose by only reporting costs at the specific time of the follow-up. In fact, for a long-term disease such as HIV/AIDS, policy makers need to plan for the future, and so they need information about the costs and health benefits of programmes beyond what is currently observed. To serve this purpose, it is common to use a model depicting patients' distribution in different states of health (for example moderately sick, seriously sick and death) over time, making it possible to integrate evidence on costs and health outcomes (quality of life in a health state for example) from a diversity of sources and then to extrapolate the evidence into the future. To this end, the paper uses the Markov State Transition Model.
2.1 Markov model
The model represents patients in health states based on health states' levels of influence on costs and health outcomes, and in short and successive periods of the interventions' time horizon. The model determines the costs/health outcomes of a health state, by applying health state costs/health outcomes to the number of patients in that health state. The number of patients in each health state is obtained by means of the proportion of patients, called transition probabilities, who usually fall in that health state having moved from other states, when a cohort of patients is followed up. The costs and health outcomes of any one of the successive periods is obtained by summing costs/health outcomes of health states in that period. The costs/health outcomes of the model over the term of analysis are obtained by summing cost/health outcomes of successive periods.
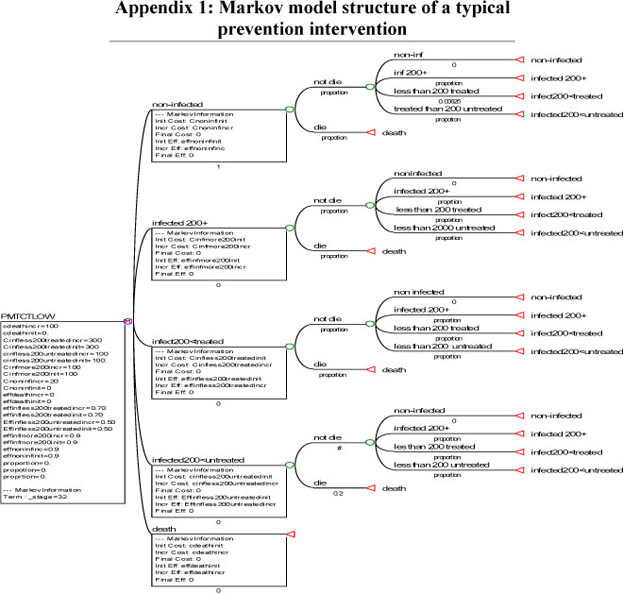
In tracking over time a cohort of patients in prevention interventions, the Markov model assumes that patients in specific health states transit to other states in every three-month period. Some patients remain uninfected (NON-INFECTED health state), some become infected but still without AIDS (INFECTEDCD4200+ health state), others move to AIDS (INFECTEDCD4200- health state),1 while others die (DEAD health state). While the main purpose of prevention interventions is to avoid new infections, avoiding costly and worse health outcomes in subsequent use of treatment interventions has also been acknowledged as benefits of prevention. To show these benefits, treatment-relevant health states are added to the Markov structure of prevention interventions. A typical Markov cycle tree structure for prevention intervention is illustrated in Appendix 1.
For the HAART intervention, the Markov model assumes a cohort of patients in need of treatment (INFECTED CD4 200-) in which some members, in a three-month period, remain in the same health state, others move to better health states (INFECTEDCD4200+), while others die (DEAD health state). Strata of CD4 counts are used to depict important stages of HIV progression, in line with evidence that the CD4 count, is a major predictor of HIV progression (Egger, May, Chene, & Phillips, 2002; Hogg, Yip, Chan, & Wood, 2001). A typical Markov cycle tree structure for treatment interventions is illustrated in Appendix 2.
A pair of Markov models is evaluated for each intervention, one model for a HPA and another for an LPA. There are different definitions related to the paper classification of, for example, an LPA (a low prevalence area), with a scale of HIV/AIDS prevalence from low prevalence, to concentrated and generalised. An area is an LPA in a given period if the prevalence rate has not consistently exceeded 5 per cent in any of its sub-population; the area is categorised as concentrated if the prevalence rate has been above 5 per cent in at least one of its subpopulation but less than 1 per cent among a sub-population of pregnant women in its urban part; the presence of HIV/AIDS in the area is generalised, if the prevalence rate among pregnant women is above 1 per cent (UNAIDS/WHO, 2002; Denning & DiNenno, 2008). Similar definitions relate to the paper classification of a HPA (a high prevalence area).
On the basis of these definitions, South Africa has a generalised epidemic and is a high level prevalence area. Over time, however, prevalence in some provinces has been consistently higher than in others. For this analysis, provinces which had a prevalence rate in the general population of less than 7 per cent in 2007 were classified as an LPA and provinces with prevalence above 7 per cent as a HPA. On these grounds, a HPA comprised the Eastern Cape, Free State and KZN, then Mpumalanga, Gauteng, and North West, while the other provinces comprised an LPA.
The model simulates lifetime costs (until 95 per cent of the cohort is dead), health outcomes, and cost-effectiveness of intervening in an LPA and a HPA with a set of the above-mentioned interventions. The simulation tracks these costs and health outcomes in successive three-month periods for a cohort of 10,000 patients in each area, from 2007. The starting time for the analysis is motivated by the fact that at this time HIV started receiving proper attention by the South African government. The simulation is expected to estimate the economic implications of such a commitment.
2.2 Data and analysis
The probability of patients changing from one health state to another is gathered from the literature, especially HIV cohort studies. Transition rates reported for periods other than three months are adjusted to take account of the three-month period used in the Markov model. The rates, i.e. the number of patients who move to a given HIV health state in a period of time, are converted into a three-month, transition probability using the formula p = 1 - e where p is the transition probability, and r is the rate or the number of patients who transit in a period of time t. The time is transformed in the number of three-month periods, either through multiplication or division, depending on whether t is greater or less than a three-month period.
The costs in different health states are also collected from the literature. The paper considers only costs that reflect full opportunity costs of each intervention. Since the South African government funds two third of the HIV/AIDS response (Stewart, 2010), the base-case value analysis is considered for the government perspective. However, a societal perspective is also analysed, as per cost-effectiveness expert recommendations (Gold, Siegel, Russel, & Weinstein 1996:166). A societal perspective takes account of full opportunity costs, i.e. intervention and patients' costs. The societal perspective includes transport, funeral and waiting time costs in addition to government perspective costs. Real costs are used in the analysis, with 2007 prices, and these are discounted at 3 per cent in line with the recommendation from cost-effectiveness analysis experts (Gold, Siegel, Russel, & Weinstein, 1996). Undiscounted results are also reported for the sake of comparison with other studies that have reported such results. All analyses are performed using TreeAgePro (DATA TM) software.
The effectiveness of HIV/AIDS interventions in health states is calculated based on the duration in a health state, and the quality of life in this health state. To this end, the quality of life data is collected from the South African literature (Jelsma, Maclean, Hughes, Tinise & Darder 2005; Louwague, Meyer, Booysen, Fairal & Heunis, 2007; O'Keefe & Wood, 1996). This data has been collected using instruments that contain descriptive questions, whose answers provide the measure of overall health. The community average health related quality of life (HRQoL) is taken as the average HRQoL from the representative sample.
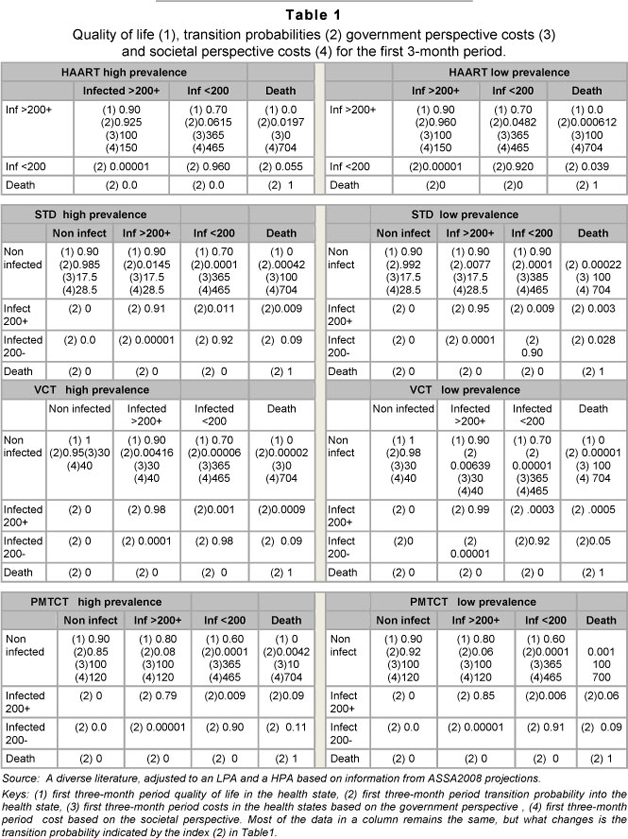
In cost-effectiveness analysis, however, individual responses need to reflect preferences. Individual responses can be transformed into preference measures or utility indices, using an algorithm that predicts a utility score for a set of responses from an individual. The prediction model was developed based on the responses in a sample of the UK population (Dolan, 1997; Dolan, Gudex, Kind & Williams, 1995). The same algorithm has been used to produce the value of the responses from the instrument used in South Africa. Using a Europol, an instrument that asks questions in a health state about mobility, pain/discomfort, in Cape Town, Jelsma et al. (2005) produced values of quality of life for patients receiving HAART over a one year period. Using the same instrument in the Free State, Louwague et al. (2007) analysed value of quality of life for HIV/AIDS patients, both receiving and not receiving treatment. The paper uses these values in different health states of the model. The base-case values used in the analysis are in Table 1.
2.3 Assumptions
Patients' costs/ health outcomes over time depend on patients' distribution in health states under a specific intervention, in a given area. To get this data, the information from the literature is combined with information from the ASSA2008 model projections, to formulate assumptions regarding parameter differential across a HPA and an LPA. ASSA2008 is an updated version of a series of AIDS Models of the Actuarial Society of South Africa (ASSA). ASSA2008 was an improvement on ASSA2003. The construction of ASSA2003 was founded on the assumption that the HIV epidemic spreads via heterosexual encounters. The modelling distinguished four risk groups (PRO, STD, RSK, and NOT) ranked in descending order of their risk. The PRO, STD, RSK, and NOT groups were: sex workers, frequent carriers of STDs, people at risk but not usually carriers of STDs, and people not at risk, respectively. The model also took account of the differences in the spread of HIV across age, and the gender composition of these risk groups. The model used data on sexual behaviour, on the probability of infection, data on the progression of HIV, on the effect of major interventions, census data (1970, 1996, and 2001), fertility rates, the 1998 and 2001 demographic and health surveys, international migration data, non-AIDS mortality data, and 2008 antenatal survey data in South Africa, to formulate such projections. Further to this, the ASSA2008 improved the projections of its predecessors, in that it took account of increased condom usage, treatment with HAART, increases in survival rates among untreated HIV/AIDS patients, and a lower incidence of mother to child transmission than had previously been modelled (Bradshaw, Laubscher, Dorrington, Bourne & Timaeus, 2004; Groenewald, Bradshaw, Dorrington, Bourne, Laubscher & Nannan, 2005).
In this study, assumptions about the progression of patients in health states are intervention-specific and are based on the growth rate over time in infections, AIDS cases and HIV/AIDS deaths reduction from ASSA2008 projections. Since the activities of interventions are the same, the costs in the same health states are assumed to be the same across a HPA and an LPA, and so is quality of life. The simulation includes, however, an assumption of economies of scales in health states, and unit costs moving in an inverse relationship with the number of patients in health states. Because of unavailability of evidence regarding the effect of 2010 and 2011 PMTCT and HAART guideline changes, the analysis is conducted under the assumption of 2007 guidelines. The possible effects of these changes are discussed outside of modelling. Uncertainty, expected to arise from any parameter, is handled by probabilistic sensitivity analysis, in which lognormal distributions and triangular distributions are used for cost and effectiveness values, respectively.
3 The results
3.1 The effectiveness
3.1.1 Survival
In an attempt to have the cost-effectiveness of intervening in a HPA and an LPA well understood, it is worth discussing separately results about the effectiveness and cost of intervening in these areas. Defining effectiveness in terms of survival, the analysis was conducted by comparing survival differences across the areas. The results of such comparisons are presented in Figure1 below.
As can be seen in Figure 1, the patterns of survival across an LPA and a HPA are quite different, with the greatest differences in patterns of survival apparent in health state NON-INFECTED and health state DEAD. The least differences are observed in health state (INFECTED CD4 200-). Moreover, the pattern of survival appears to be different across interventions. The results show that in general, survival is greater in an LPA as compared to a HPA.
While it might be speculative to point out the exact reasons for the differences, the results show that the same intervention results in different survival outcomes across an LPA and a HPA. The results answer partially the paper's initial question on whether the interaction of the intervention and the areas produce an effect on cost-effectiveness. What appears to be the case is that interaction of the interventions and an LPA results in more survival than the interaction of interventions with a HPA. The results suggest that policy makers in South Africa should take account of the prevalence level in areas, when implementing HIV/AIDS interventions.
Differences in intervention outcomes can be explained by a number of social theories of health behaviour, according to which differences in health status depend on people's perception of risk, which in turn depends on personal characteristics (Becker, 1974) or the character-ristics of the society in which individuals live (Bandura, 1986). Besides social theories, empirical research has on the other hand reached different conclusions about how interventions interact with cultural norms (Airhihenbuwa, 2004). Other research has concluded that risk behaviour reduction would be greater for people witnessing real threat from the epidemic, in this case a HPA (Geoffard & Phillipson, 1996; Sweat, Gregoric & Sangiwa, 2000:113). While some of these conclusions may be relevant to South Africa, what appears to be the fact is that the effectiveness of an intervention depends on the area of such intervention.
In comparing effectiveness of intervening in a HPA and an LPA using survival for prevention interventions, we cannot ignore that the latter's main purpose is to prevent new infections. However, we can also not ignore the evidence that beneficiaries of different prevention interventions fare differently in treatment interventions (Sweat, Gregoric & Sangiwa, 2000). To reflect the two facts, the proportion of non-infected patients over time was compared with the proportion of patients in treatment-relevant health states across a HPA and an LPA. Figure 2 below illustrates these results.
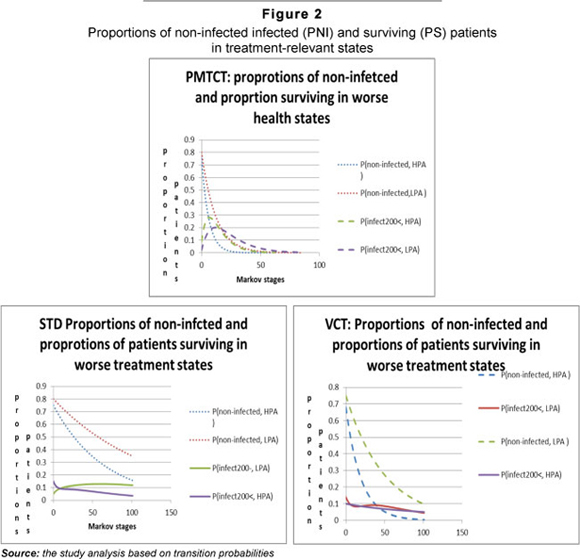
Figure 2 below shows that over time, an LPA results in greater proportions of patients in NON-INFECTED and INFECTEDCD4200-states than does HPA. Moreover, the figure depicts a fast-decreasing proportion of patients in INFECTEDCD4200- in a HPA than it does for an LPA. In summary, this suggests that intervening in an LPA with prevention interventions not only results in averting greater infections, but also in more future treatment benefits than in a HPA. Again, with intervention activities being the same, this difference in results can be attributed to difference in the interaction between the area type and the intervention.
3.1.2 Survival adjusted with quality of life
The paper also compares effectiveness across areas using survival years adjusted with quality of life. Comparisons using this measure were motivated by the fact that two interventions might achieve the same survival rate but a different quality of life. Multiplying survival years in a health state, by the percentage of perfect health in that health state (considered as quality of life), yielded the number of perfect years of life across areas called quality adjusted life years (QALYs). Using QALYs as a proxy for the effectiveness of intervening in an LPA and a HPA produced results as presented in Figure 3 below.
The results show that QALY output is greater in an LPA than in a HPA. The greatest differences across areas in total QALYs is observed for non-ARV interventions (STD and VCT), particularly in the health state NON-INFECTED. Once again the fact that QALYs from the same interventions and on the same patients is different across areas, is indicative of different effects on QALYs, and of the interaction between an intervention and the areas of intervention.
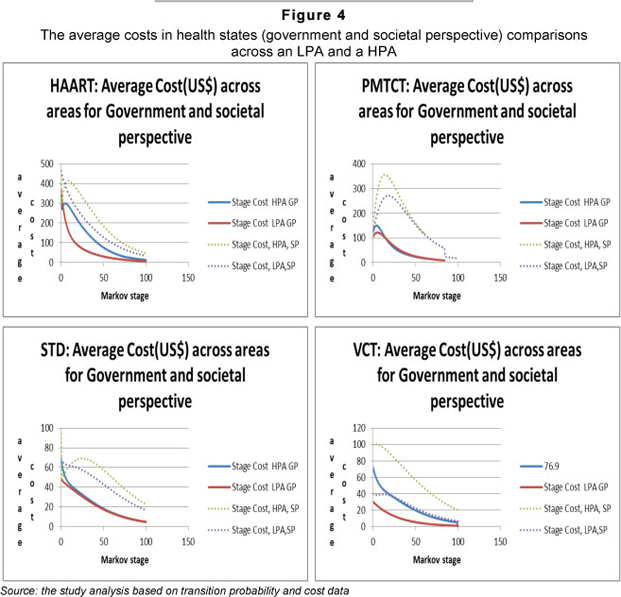
3.2 The Costs
While effectiveness analysis is one part of the cost-effectiveness analysis, the analysis is complete when both effectiveness and costs are considered. The cost of intervening in an LPA and a HPA was analysed. As in the case of effectiveness, the costs of intervening in these areas depended on the distribution of patients, and the unit cost in health states. Assuming an equal unit cost in the same health states across a HPA and an LPA, implies that the pattern of costs depends on the distribution of patients and the extent of the difference in unit costs across health states. The average costs results of this analysis are summarised in Figure 4 below.
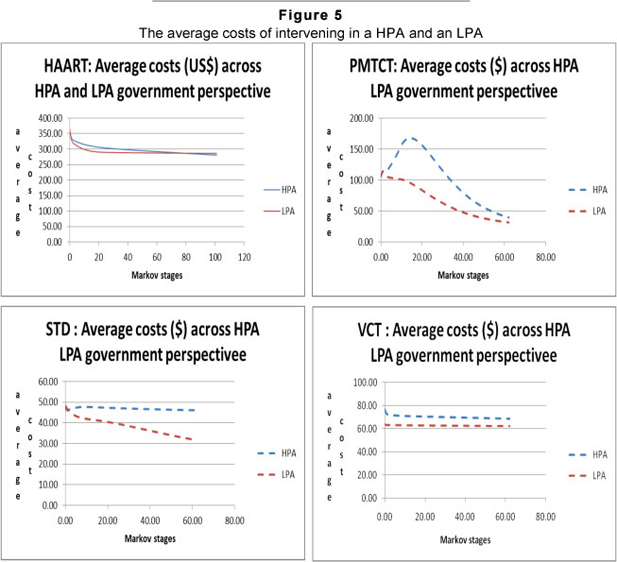
As expected, the average cost is greater in a HA than in an LPA. This is because over time, relatively more patients are in costly health states in a HPA, than there are in an LPA. However, the assumption of the same set-up of interventions across the areas implies similar fixed and variable resources in health states. An implication of this assumption is that different distributions of patients in these health states might result in different unit costs, because of economies of scales. The paper investigated this question, by assuming an inverse relationship between the growth of patients in health states, and the growth of unit costs in the health states. The Figure 5 below presents the patterns of average cost from the government perspective from which the patterns of a societal perspective are also understood.
The results suggest different patterns in average costs across an LPA with PMTCT and VCT exhibiting the greatest differences. In comparison with previous discussions in this paper, an assumption of economies of scale changes the cost levels, but not the patterns across a HPA and an LPA except for VCT. It is worth noting an average greater cost for prevention intervention than would be expected. This is because the paper includes subsequent benefits in treatment health states and consequently related costs for prevention interventions, assuming linkages of prevention to treatment.
3.3 Cost-effectiveness
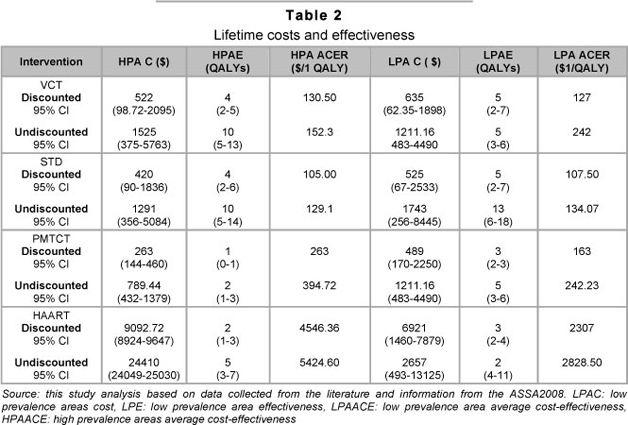
With some understanding of the patterns of cost and effectiveness in the discussion above, the relative cost-effectiveness of intervening in a HPA and an LPA can now be reviewed. The cost-effectiveness is analysed using, as per the literature, the ratio of cost to effectiveness called the cost-effectiveness ratio (CER). The results of Monte Carlo simulation for the government perspective are summarised in Table 2 below.
The results show that prevention interventions result in greater QALYs and smaller costs, than treatment interventions, regardless of the areas in which they are conducted. This is in line with other literature (See for example Marseille, Hofman & Kahn, 2002). The results also indicate that intervening in a HPA with ARV-based interventions, namely PMTCT and HAART, is less cost-effective than intervening in an LPA with the same interventions.
Notable in the results is the different extent of the relative cost-effectiveness ratio across an LPA and a HPA for PMTCT and HAART. If PMTCT and HAART interventions were equally cost-effective across an LPA and a HPA, their average cost-effectiveness ratios (ACERs) in an HPA expressed as percentage of their ACERs in an LPA would be 100 per cent. The ACER of PMTCT in a HPA expressed as a percentage of its ACER in an LPA is 161 per cent; and corresponding ACER of HAART is 197 per cent using discounted values in Table 2. These percentages suggest that the extent of cost-effectiveness of PMTCT and HAART is much greater in an LPA than it is in a HPA. This result implies that PMTCT and HAART are relatively more efficient in an LPA than they are in a HPA. In contrast, the ACERs of VCT and STD in a HPA expressed as percentages of their ACERs in an LPA are too close to 100 per cent. In fact, the ACERs of VCT and STD in a HPA are 102 per cent and 97 per cent of their ACER values in an LPA suggesting that VCT and STD are almost equally cost-effective across an LPA and a HPA. These results have profound implications in policy considerations.
Traditionally, cost-effectiveness analysis has been conducted to help allocate resources. Under budget constraints, the resources alloca- tion principle has been to allocate the next available resources to the most cost-effective intervention, provided it is affordable. Applying this principle fully to the context of this paper implies allocation of the next available resources for PMTCT and HAART to an LPA and the next available resources for VCT and STD equally in an LPA and a HPA. However, such allocation would be unethical and inequitable in the case of PMTCT and HAART.
A response policy based on efficiency principles that are compatible with the ethical and equity policy tenets is here proposed. Since non-ARV-based intervention (VCT and STD) are equally cost-effective in a HPA and in an LPA resources earmarked to these interventions should be distributed equally in these interventions. By contrast, since ARV- based interventions (PMTCT, HAART) are more cost-effective in an LPA than they are in a HPA, more of the resources reserved to these interventions should go in an LPA in order to increase efficiency.
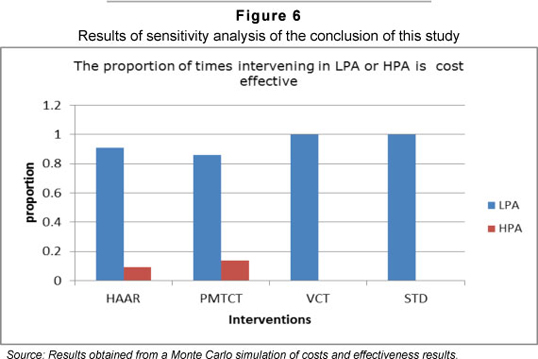
Given the uncertainty around the parameters used, this paper sought to ascertain the robustness in the conclusion of the study. To this end, the results were recalculated 1000 times, using each time random values drawn from the distributions of all model parameters on quality of life, transition probability and the costs. The proportions of time intervening in an LPA and a HPA were more cost-effective are illustrated in Figure 6. This result suggests robustness in the conclusion with intervening in an LPA remaining more cost-effective 90 per cent to 100 per cent of the times.
The analysis was conducted using PMTCT and HAART implementation guidelines in place until 2010. For the PMTCT, the guidelines consisted of using the single dose Nevirapine around the time of birth, combined with option to breastfeed or not. In 2010, a more expensive but more effective guideline relative to the 2007 guideline was adopted. It consisted of using a more expensive compound Zidovudine (AZT) from week 14 of gestation, for infected mothers. Some evidence indicate that the new guidelines are effective but the way in which their effectiveness affects cost-effectiveness of interventions across an LPA and a HPA depends on the relative increase in cost and effectiveness in these areas. While their effect on the cost-effectiveness ratio in an LPA and a HPA is incontestable, the pattern of cost- effectiveness across a HPA and an LPA does not change, given the unchanged dynamics about the interaction between intervention and areas. The same argument goes for the more expensive but more effective new guidelines adopted in 2011. These guide-lines suggest starting to provide ARVs to patients whose CD4 counts falls below 350.
4 Concluding remarks
Given the effect of interaction between an HIV/AIDS intervention and areas of implementation on cost-effectiveness and the lack of cost-effectiveness evidence of intervening in a HPA relative to an LPA, this study conducted a simulation to compare cost-effectiveness of intervening in these areas, using a set of HIV/AIDS interventions in South Africa. The simulation was based on the dynamics between the intervention and the areas' characteristics, and on a combination of information from the literature and an AIDS projection model of the Actuarial Society of South Africa (ASSA2008). The simulation results revealed that intervening in an LPA was more cost-effective. The evidence in the literature that interventions do better where there are more patients by taking advantage of economies of scale was not supported in this study.
To align efficiency with equity and ethical principles underlying HIV response, policy implication was that resources earmarked to non-ARV based interventions (VCT and treatment of STDs) should be equally shared across an LPA and a HPA while more of the resources reserved for ARV-based interventions (PMTCT and HAART) should go in an LPA in order to increase efficiency. These results were checked for robustness by means of Monte Carlo simulation which showed that these results could be reliable with a probability of between 90 and 100 per cent. Moreover, the analysis was based on the intervention guidelines in place in 2007, which did not include recent changes notably on PMTCT and on early provision of antiretrovirals. An analysis of possible implications of these changes suggested that the conclusion of the study would not change.
References
ACTUARIAL SOCIETY OF SOUTH AFRICA. 2011. AIDS and demographic model of the Actuarial Society of South Africa, ASSA2008 full model. Available at: http://www.actuarialsociety.org.za [accessed 2011-11-20] [ Links ].
AIRHIHENBUWA, C.O. 2004. Culture and African context of HIV/AIDS prevention, care and support. Journal of Social Aspects of HIV/AIDS Research Alliance, 1(1): 1-13. [ Links ]
ALISTAR, S.S. & BRANDEAU, M.R. 2010. Decision making for HIV prevention and treatment scale up: bridging the gap between theory and practice. Medical Decision Making, 32(1):105-117. [ Links ]
BANDURA, A. 1986. Social foundations of thought and action: a social cognitive theory. Englewood Cliffs, NJ: Prentice Hall. [ Links ]
BECKER, M.H. 1974. The health belief model and personal health behaviour. San Francisico: Society for Public Health Education. [ Links ]
BRADSHAW, D., LAUBSCHER, R., DORRINGTON, R., BOURNE, D.E. & TIMAEUS, I.M. 2004. Unabated rise in number of adult deaths in South Africa. South African Medical Journal, 94(4):278-279. [ Links ]
DOLAN, P. 1997. Modelling valuations for euroQol health states. Medical Care, 35:1095-1108. [ Links ]
DOLAN, P., GUDEX, C., KIND, P. & WILLIAMS, A. 1995. A social tariff for euroqol: result from UK general population survey. Discussion Paper 138. Department of Economics: University of Newcastle-Upon-Tyne. [ Links ]
DENNING, P. & DINENNO, E. 2008. Community in crisis: is there a generalised epidemic in empoverished urban areas of the United States. Available at: http://www.cdc.gov/hiv/topics/surveillance/resources/other/ pdf/poverty poste.pdf [acessed 2011-11-20] [ Links ].
EGGER, M., MAY, M., CHENE, G. & PHILLIPS, A.N. 2002. Prognosis of HIV-1 infected patients starting highly active antiretroviral therapy: a collaborative analysis of prospective studies. Lancet, 360(9327):119-129. [ Links ]
GEOFFARD, P.Y. & PHILLIPSON, T.1996. Rational epidemics and their public control. International Economic Review, 7(3):603-624. [ Links ]
GOLD, M.E., SIEGEL, J.E., RUSSEL, L.B. & WEINSTEIN, M.C. 1996. Cost-effectiveness in health and medicine: Oxford University Press. [ Links ]
GRASSLY, N.C., GARNETT, G.P., SCHWARTLANDER, B., GREGSON, S. & ANDERSON, R. 2001. The effectiveness of HIV prevention and the epidemiological context. Bulletin of the World Health Organisation, 79(12):1121-1132. [ Links ]
GROENEWALD, P., BRADSHAW, D., DORRINGTON, R., BOURNE, D., LAUBSCHER, R. & NANNAN, N. 2005. Identifying deaths from AIDS in South Africa: an update. AIDS, 19(7):744-745. [ Links ]
HOGG, R.S., YIP, B., CHAN, K.J. & WOOD, E. 2001. Rates of disease progression by baseline CD4 cell count and viral load after initiating triple-drug therapy. JAMA, 286(20):2568-2577. [ Links ]
JELSMA, J., MACLEAN, E., HUGHES, J., TINISE, X. & DARDER, M. 2005. An investigation into the health-related quality of life of individuals living with HIV who are receiving HAART. AIDScare, 17(5): 579-588. [ Links ]
LOUWAGIE, G.M., MEYER, B.M., BOOYSEN, F. LE. R., FAIRAL, L.R. & HEUNIS, C. 2007. Highly active antiretroviral treatment and health related quality of life in South Africa adults with human immunodeficiency virus infection. A cross sectional analytical study. BMC Public Health. Available at: http://www.biomedcentral.com/content/pdf/1471-2458-7-244.pdf [accessed 2011-11-15] [ Links ].
MARSEILLE, E. HOFMN,P.B. & KAHN, J.G. 2002. HIV prevention before HAART in Sub-Saharan Africa. The Lancet, 359:1851-1856. [ Links ]
O'KEEFE, E.A. & WOOD, R. 1996. The impact of human immunodeficiency virus (HIV) infection on quality of life in a multiracial South African population. Quality of Life Research, 5:275-280. [ Links ]
PARKER, R. & AGGLETON, P. 2002. HIV/AIDS-related stigma and discrimination: a conceptual framework and agenda for action. Geneva:UNAIDS. [ Links ]
PARKER, R.G., EASTON, D. & ALLEN, C. 2000. Structural barriers and facilitators in HIV prevention. AIDS, 14(Sppl 1):S22-S32. [ Links ]
PRONYK, P., HARGREAVES, J., KIM, J.C., MORRISSON, L.A., PHETLA, G., WATTS, C., BUSZA, J. & PORTER, J.D. 2006. Effects of structural intervention for the prevention of intimate partner violence and HIV in rural South Africa:a cluster randomised trials. Lancet, 368:1973-1983. [ Links ]
PRONYK, P.M., KIM, J.C., ABRAMSKY, T., PHETLA, G., HARGREAVES, J., MORRISSON, L.A., WATTS, C., BUSZA, J. & PORTER, J.D. 2008. Combined microfinance and training interventions can reduce HIV risk behaviour in young female particpants. AIDS, 22:1659-1666. [ Links ]
RAOGUPTA, G., PARKHURST, J.O., OGDEN, J.A., AGGLETON, P. & MAHAL, A. 2008. A structural approach to HIV prevention. Lancet, 372:764-765. [ Links ]
STEWART, S. 2010. South Africa launches massive HIV prevention and treatment campaign. UNAIDS press: 25 April. [ Links ]
SWEAT, M., GREGORIC, S. & SANGIWA, G. 2000. Cost-effectiveness of voluntary HIV-1 counselling and testing in reducing transmission of sexually transmission of HIV-1 in Kenya and Tanzania. Lancet, 356:113-121. [ Links ]
UNAIDS. 2010. Global report: UNAIDS report on the global AIDS epidemic 2010. November. Switzerland.Geneva. [ Links ]
UNAIDS/WHO. 2002: Introduction to second generation of HIV sureveillance. Working group on global HIV/AIDS Surveillance. Avialble at: http://data.unaids.org/publications/IRC-pub02/jc742-initiatingsgs_en.pdf [accessed 2011-10-15] [ Links ].
WALKER, D. 2003.Cost and cost-effectiveness of HIV/AIDS prevention strategies in developing countries: is there evidence base? Health Policy and Planning, 18(1):4-17. [ Links ]
WHITESIDE, A. & SMITH, J. 2009. Exceptional epidemics: AIDS still deserves a global response. Globalisation and Health 5: 15-doi:10.1186/1744-8603-5-15 [accessed 2011-09-13] [ Links ].
Accepted: January 2013
Endnote
~~1 The analysis focuses only on the before -2010 guidelines for HAART and PMTCT because data for the 2010 guidelines for these two interventions are not available. In this paper the analysis of 2010 guidelines is based on assumptions.


