


Services on Demand
Article
 English (pdf)
 Article in xml format
 Article references
Indicators

Related links
-
 Cited by Google
 -
 Similars in Google
Share

 Permalink
South African Journal of Economic and Management Sciences
On-line version ISSN 2222-3436
Print version ISSN 1015-8812
S. Afr. j. econ. manag. sci. vol.16 n.2 Pretoria Jan. 2013
ARTICLES
An estimate of the recreational value of the Agulhas Plain, South Africa, with special reference to the value of plant biodiversity
Beatrice Conradie; Maria Garcia
School of Economics and Centre for Social Science Research, University of Cape Town
ABSTRACT
The Agulhas Plain is a remarkable recreational site which combines the attraction of a pristine marine environment with exceptional plant biodiversity, rural tranquility and the novelty of being at the southernmost tip of Africa. The resource is a public good to which the market cannot assign a full value. This paper presents an estimated recreational value based on individual travel cost models and a sample of 370 visitors surveyed in 2010. Trip demands were estimated with zero truncated negative binomial models to account for over-dispersion. The study established a recreational value of R2.167 billion in 2010 prices for the site as a whole. By partitioning the sample into visitors who indicated having been attracted or not to the area by its nature and biodiversity, a net biodiversity value of R2 866 per trip was calculated. Allocated between marine and terrestrial resources based on the proportion of activities related to each type of resource, the value of plant biodiversity was estimated to be R2 268 per hectare in 2010to 2010 prices.
Key words: recreational value, biodiversity valuation, individual travel cost model, Agulhas Plain
JEL: Q260, 210
1 Introduction
Recreational sites are recognised as public goods which are undervalued by the market and therefore depend on public investment for their support. Over the last twenty years, individual travel cost models have emerged as the preferred way of measuring the use value of recreational sites (Creel & Loomis, 1990; Freeman, 1993; Eglin & Shonkwiler, 1995; Gurmu & Trivedi, 1996; Garrod & Willis, 1999; Ward & Beal, 2000; Shrestha, Seidl & Moraes, 2002; Martinez-Espineira & Amoaka-Tuffour, 2008).
The main objective of this paper was to estimate the recreational value of the Agulhas Plain as a single destination. The Agulhas Plain is the coastal lowland between Hermanus and the estuary of the Breede River, an area covering 335,335 hectares. The site offers a pristine coastline with many excellent opportunities for whale watching, shark-cage diving, recreational fishing and diving. Two thirds of the world's whale and dolphin diversity occurs along this coast. The Agulhas Plain is equally well known for exceptionally rich plant biodiversity. An area total of 1,751 plant species, including 99 endemics, 112 Red Data Book species and 46 vegetation types have been described (Thwaites & Cowling, 1988; Cowling & Holmes, 1992; Cowling & Mustart, 1994; Lombard, Cowling, Pressey & Mustart,1997; Privett, 2002; Raimondo, Von Staden, Foden, Victor, Helme, Turner, Kamundi & Manyama, 2009). Almost a third of the land surface area is formally protected in the Agulhas National Park, which also includes the southern tip of Africa and the Agulhas lighthouse, as well as De Hoop Nature Reserve, the Nuwejaars Wetland Private Protected Area and a handful of smaller wildflower reserves. It is estimated that about half a million people visit the area every year, causing the number of inhabitants in the many coastal settlements to increase tento twentyfold during the holiday seasons of Christmas and Easter.
The secondary objective of this paper was to extract a plant biodiversity value from the overall recreational value of the site. This need arose in the context of the Agulhas Biodiversity Initiative, which attempted to secure private farmland for conservation. The two main conservation-compatible enterprises identified for the area were wildflower harvesting and eco-tourism (Lochner, Weaver, Gelderblom, Paert, Sandwith & Fowkes, 2003). At an income of less than R220 per hectare in 2010 prices (Conradie, 2010), wildflower harvesting did not compete with wheat or canola. Private eco-tourism revenues could not secure conservation, as the Agulhas Plain gives open access to large tracts of coastline and untransformed vegetation. Conservation on private land therefore had to be incentivised. In order to raise the funding for this, conservation managers had to come up with a unit value for natural vegetation. Turpie, Heydenrych & Lamberth (2003) provided one such attempt in which the total valuation of the environmental resources in the Cape Floristic region was calculated in 2010 prices as R4 570 per hectare of untransformed land. This estimate referred to all natural resources, so it could be improved upon for the purposes of landscape conservation by extracting a biodiversity value for terrestrial resources only.
The standard travel cost methodology was followed in this paper. Data collection, the modelling implications of zero truncated count data, the trip demand specification and the welfare calculation are discussed in the section on methods. The results contain descriptive statistics, the econometric estimates for the trip demand functions and the value estimates. The paper ends with a discussion and conclusions.
2 Methods a Data collection
The visitor survey began on the Easter weekend of 2010 (2nd April) and the data collection period lasted for four weeks. All economically active adults were surveyed. In total, 196 surveys were completed, which represented a total of 411 adults and 106 children (defined as being under 16 years of age). Of the adults, the 370 who were defined as economically active were of interest for the study.
The questionnaire was located at four of the five Cape Agulhas tourism bureaux, Agulhas, Bredasdorp, Napier and Elim; it was also located at two of the Overberg tourism bureaux, Gansbaai and Stanford. We recognised that the emphasis on sampling at tourist bureaux could result in a non-random sample, which is why the help of members of the tourism association was enlisted in hosting the questionnaire. Owing to the expensive and extensive manpower requirements of admini-sterring a questionnaire randomly across such a large geographical area, the resources available for this study did not permit the use of a more complex sampling design, such as stratification or clustering, which should be considered in future studies of this nature.
b Modelling with zero truncated endogenously stratified count data
Sampling visitors at recreational sites is standard, but the nature of the data generated in this way requires special attention to be paid to functional form during estimation. Trips are a count data variable, which is usually Poisson distributed, meaning that a small number of people visit quite frequently while most visit rarely. However, since survey data almost never meet Poisson's stringent requirement of the mean being equal to the variance, a Poisson regression produces biased and inconsistent coefficients (Creel & Loomis, 1990; Grogger & Carson, 1991). The mean equals variance requirement of Poisson is relaxed in the negative binomial regression by including a parameter alpha to capture the degree of over dispersal in the sample (Martinez-Espineira & Amoaka-Tuffour, 2008). A likelihood ratio test of alpha=0 determines the choice between Poisson and a negative binomial regressions (Eglin & Shonkwiler, 1995).
A sample of visitors collected at site is, by definition, zero truncated. There are two ways in which to account for zero truncation in estimation. In the presence of limited overdispersion, one could simply be subtracted from the reported number of trips before estimating with an ordinary negative binomial regression (Fix & Loomis, 1997; Loomis, 2003; Martinez-Espineira et al., 2006). However, this simple fix does not account for endogenous stratification, which arises from frequent visitors having a greater chance of being sampled at the site than infrequent visitors have. The solution is to estimate a negative binomial regression which is corrected for zero truncation as well as endogenous stratification (Eglin & Shonkwiler, 1995). The zero truncated endogenously stratified negative binomial regression significantly increases the computational burden over that of the standard negative binomial regression (Martinez-Espineira & Amoaka-Tuffour, 2008), which is problematic when the sample size is limited. For this reason only, following Fix and Loomis (1997) and Loomis (2003), we did not correct for endogenous stratification but instead corrected for zero truncation by defining the dependent variable as trips other than the current one taken during the past twelve months.
c Trip demand specification
The demand for total visits per annum was modelled as a function of travel costs, income, tourist characteristics and location-specific factors. When constructing the dependent variable (number of previous visits to the region per year), we had to assume that a visitor's previous trips in that year shared the same characteristics as the visit during which he or she was surveyed, as it was unrealistic to expect a visitor to describe the characteristics of all previous trips (Kerkvliet & Nowell, 1999; Garrod & Willis, 1999; Markandya Harou, Bellù & Cistulli, 2002).
Self-reported trip expenditure was recorded in the survey, but, given the complex journeys many people undertook, it was decided, for the sake of consistency, to construct a total travel cost variable for each visitor. Where transport was shared, costs were divided equally between economically active adults. When it came to self-drive holidays, the distance travelled from home to the Agulhas Plain and back was multiplied by a standard car-running cost, including fuel, maintenance and tyre factors (Automobile Association, 2010). The Arrive Alive Campaign's route planner (2011) was used to establish distances travelled. For those who flew into Cape Town and then rented a car or went by bus to the Agulhas Plain, the proportion of total-trip travel cost included was dependent upon whether the visitor had planned to come to the Agulhas
Plain before leaving home. If the Agulhas Plain extension had been decided on after arrival in South Africa, only the distance from the last point outside the area and back was included in the travel cost estimate. For spur of the moment visitors, the decision had usually been made in Cape Town or along the Garden Route. For visitors who had planned to come to the Agulhas Plain all along, a share of airfares was counted based on the proportion of days spent in the area (Kerkvliet & Nowell, 1999). We followed Bellu and Cistulli (1997) in leaving out the value of tourists' time in order to avoid the problems described by Cesario and Knetsch (1970, 1976), Freeman (1993) and Common, Bull & Stoekl (1997). A missing expenses dummy variable was constructed to indicate observations for which travel costs were omitted.
As a fundamental determinant of demand, the price of substitute sites that a visitor could have considered ought to have been included in the demand model. In practice, the price of substitute sites was not universally included in the literature. Some studies omitted it for good reason; for example, once a license for hunting at a specific site had been purchased, the site no longer had relevant substitutes (Creel & Loomis, 1990). Other studies omitted the price of substitute sites for convenience (Rosenthal, 1987; Common et al., 1997; Garrod & Willis, 1999; Liston-Heyes & Heyes, 1999). Du Preez & Hosking (2011) did not include a price but used a round-trip travel time between a respondent's home and his or her best alternative destination as a proxy. While omitting the price of substitutes might have led to an upward bias in the value estimate (Liston-Heyes & Heyes, 1999), this omission was considered small enough, as only 38 per cent of our respondents indicated that they would have gone on an alternative trip had they not come to the Agulhas Plain.
The income question on the survey presented respondents with a list of eight monthly income brackets as follows: incl (less than R4 999), inc2 (R5 000-9 999), inc3 (R10 000-14 999), inc4 (R15 000-19 999), inc5 (R20 000-24 999), inc6 (R25 00029 999), inc7 (R30 000-39 999) and inc8 (R40 000 or over). The responses to this categorical variable were converted into a continuous variable by taking the midpoints of each income bracket. Although the theoretical relationship between recreational trips and income is positive, empirical results often fail to confirm this (Du Preez & Hosking, 2011).
Tourist characteristics were modelled with two indicator variables plus party size. The dummy variables recorded whether or not someone was on a more extensive trip within South or southern Africa (1 = yes) and whether he or she enjoyed travelling (1 = yes). Since more comprehensive journeys are characteristic of foreign visitors, who tend to visit the Agulhas Plain less frequently than locals do, the expected sign of the larger trip dummy variable was negative, while the expected sign on the "enjoy travelling" dummy variable was negative. It was constructed from the responses to a five-point Likert scale, of which the categories "enjoy a lot" and "enjoy somewhat" were combined into "yes" responses. Party size was defined as the total number of adults and children travelling together and could include multiple households. We had no prior expectation regarding the sign of the party size coefficient; on the one hand a positive sign on party size could point to the family-friendly nature of the Agulhas Plain destination, but, on the other hand, people on extended journeys tend to travel in larger groups.
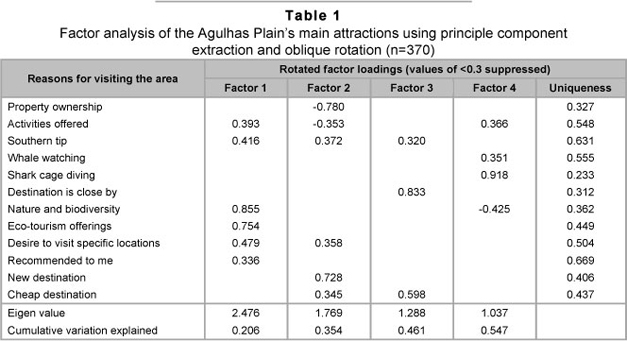
The questionnaire presented visitors with a list of twelve possible reasons for visiting the Agulhas Plain. The categories were constructed from a question which read: "How influential or not were the factors below on your decision to come to the Agulhas Plain on this visit or previous visits?" Options included "I/we own property in the region"; "whale watching"; "nature and biodiversity unique to the Agulhas Plain"; and so on. Each potential reason for visiting had to be rated on a four-point Likert scale labelled "extremely", "quite", "hardly" and "not at all". The categories "extremely important" and "quite important" were combined to form the "yes" responses in a series of attraction dummy variables. A factor analysis using a principle component extraction method yielded four factors with Eigen values of greater than one. These four factors together explained almost 55 per cent of the cumulative variance. An oblique rotation was used to identify the factor loadings presented in Table 1 below. Nature and biodiversity and eco-tourism offerings both loaded strongly onto factor 1, with rotated factor loadings of 0.855 and 0.754 respectively. Novelty loaded strongly onto factor 2 (0.728) and proximity loaded strongly onto factor 3 (0.833). For factor 4, the strongest loading (0.918) came from shark-cage diving. Novelty, proximity and shark-cage diving were included as dummy variables in the trip demand model.
Property ownership and attitudes to nature were used to partition the sample for the purpose of estimating profile-specific trip demand functions. Model 1 referred to all visitors who answered "no" to the question "Was nature and biodiversity unique to the Agulhas Plain influential on your decision to come to the Agulhas Plain on this visit or previous visits?" (n=79), while models 2 and 3 referred to visitors who answered "yes" to this question (n=231). For model 2, some people answered "no" to the question: "Was the fact that you/your family own property in the region influential in your decision to come to the Agulhas Plain on this visit or previous visits?" (n=170), while those who answered "yes" were allocated to model 3 (n=61). A fourth model was estimated for the un-partitioned sample (n=310).
a The welfare calculation
There is a strong tradition in cost benefit analysis of simply using consumer surplus as an indication of value. In travel-cost modelling, consumer surplus was defined as the integral of the trip demand function between an individual's travel-cost expenditure and a choke price, where the number of visits per annum demanded is "choked" to zero by excessive distance to the site (Eglin & Shonkwiler, 1995; Bellu & Cistulli, 1997; Markandya et al., 2002). For count data models, consumer surplus per visit was calculated as 1/βTC (Creel & Loorms, 1990). A further concern has been raised in the literature, that the Marshallian consumer surplus is strictly inappropriate where the empirical income effect is positive (Ziemer, Musser & Hill, 1980; Carr & Mendelsohn, 2003), but in practice this is of little concern, as measurement errors in the demand function are likely to be far larger than the difference between the Marshallian and Hicksian consumer surplus values (Eglin & Shonkwiler, 1995; Campbell & Brown, 2003).
Total site value was calculated by multiplying the average consumer surplus per trip by the total number of trips to the site per year. Since the Agulhas Plain is not gated, finding reliable visitor numbers proved challenging. The most reliable figures were for recorded visits at the Cape Agulhas lighthouse, De
Hoop Nature Reserve and the shark boats at Gansbaai. This estimate represented a serious undercount, because we knew that local people were unlikely to be counted in any of these activities. Recorded visits were adjusted upwards with a factor of 4.02, based on information from the survey, which revealed that people who were attracted by property in the area visited 4.02 times more frequently than people who did not indicate that property to have attracted them to the site.
Estimates of visits per type of visitor relied on the assumption that the composition of visits (not observations) in the sample was representative of visits made by the population as a whole.
b Procedure for calculating a per-hectare value of plant biodiversity
Separate demand functions were recorded for the three-visitor types defined above. The value of the group who did not care about nature and biodiversity could logically be attributed to nature and biodiversity. The average value per trip for this group was subtracted from the average value generated by the two groups of visitors who indicated being influenced by nature and biodiversity. For the group attracted by nature and biodiversity as well as property ownership, the value of property also had to be subtracted from the net willingness to pay for nature and biodiversity.
Partitioning the value of nature and biodiversity between marine and terrestrial resources proved to be another challenge. Both subjective ratings of the importance of nature (Turpie et al., 2003) and the amount of time spent at a particular natural feature (Turpie & Joubert, 2001) had been used to apportion tourism values to particular features. In this study, reported activities served as the basis for allocation. To obtain a per-hectare value of terrestrial biodiversity, the share of recreational value apportioned to terrestrial resources was divided by the size of the protected area on the Agulhas Plain. Protected areas away from the coast offered the cleanest match with the single activity of viewing untransformed fynbos landscapes, but since these areas are quite small, the resulting value per hectare was over-inflated. Moreover, Geelkop Nature Reserve near Elim (450ha), Platbos near Gansbaai (30ha) and Fernkloof Nature Reserve in Hermanus (1 800 hectares) are not the only places where visitors can enjoy natural landscapes. Including De Hoop Nature Reserve (34 000 ha), Agulhas National Park (28 000 ha) and the Nuwejaars Wetland Farmers Association's private protected area (42 000ha) increased the total protected area on the Agulhas Plain to be included in the per-hectare calculation to 106 700 hectares.
3 Results a Descriptive statistics
Table 2 reports descriptive statistics for variables used to model per-capita trips demanded. In addition, it shows the results for a number of demographic variables which did not significantly explain the variation in the number of visits demanded per annum. The respondents' ages varied from 18 to 78 years, giving an average of 43 years. Women comprised 53 per cent of the sample. Almost half of the visitors reported holding a university degree while a further 28 per cent held a non-university tertiary qualification. The majority of visitors lived in the Western Cape (61 per cent), or abroad (19 per cent). The sample included 36 per cent first-time visitors. The 64 per cent of the sample who had been to the area before stated that they had made 934 separate visits to Agulhas in the previous twelve months. Almost four in five visitors said they were likely to return within the next twelve months. On average, people were away from home for fourteen days in total and on the Agulhas Plain for five days.
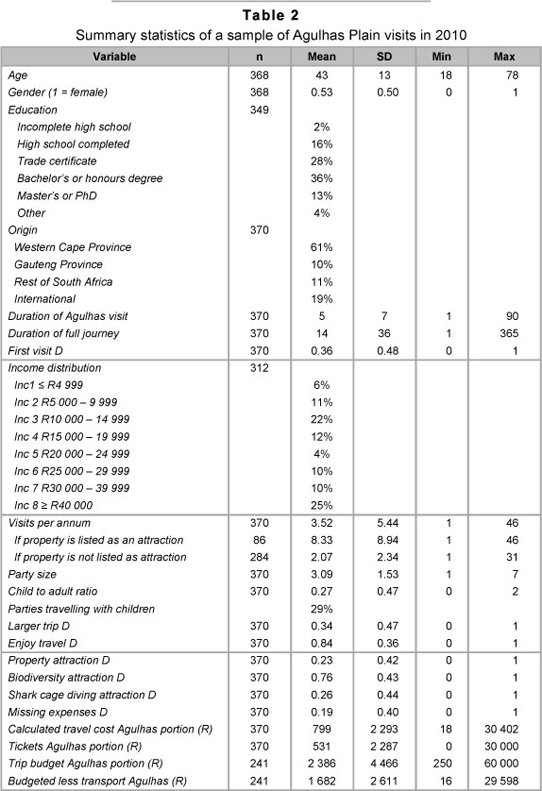
The non-response to the income question was 16 per cent, which was considered a good response rate for a question of this type (Rea & Parker, 2005; Nardi, 2006). The most frequently recorded category was an after-tax income of over R40 000 per month (25 per cent), followed by an after-tax income of R10 00014 999 per month (22 per cent). The median reported that after-tax income was about R300 000 per annum. The average number of visits demanded was 3.52 per annum. One in five visitors indicated having been attracted by local property ownership. Those who listed property in the region as a main attraction visited on average 8.33 times per annum, while people who did not mention property reported visiting 2.07 times on average per annum. Party size, including children, varied from one to seven with an average of 3.09 persons per party. Despite the strong representation of all age groups, it was worth noting how few parties travelled with children. Only 24 per cent of parties included children, with an average child-to-adult ratio of 0.24 and an average of 1.86 children per party travelling with children. Of the 34 per cent of respondents who were on a more extensive trip through South Africa or southern Africa, 48 per cent had not planned to visit the Agulhas Plain when they set off from home.
The average calculated transport cost was recorded at R799 per trip and the average expenditure on airfare attributable to the Agulhas Plain was estimated to be R531 per trip. The average stated budget for the Agulhas Plain portion of a given trip was R2 386 per person. This implies an average budget, excluding transport cost, of R1 682 per person per trip. These figures include respondents' expenditure on behalf of non-economically active partners and minor children in the party.
b Estimated trip demand functions
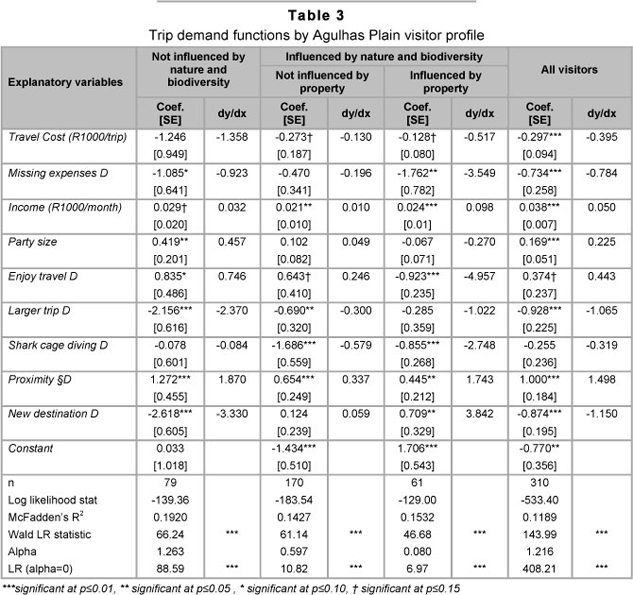
The estimation results by type of visitor appear in Table 3. A negative binomial regression was used in each case, which was appropriate, given the results of the likelihood ratio tests of alpha=0 printed at the bottom of Table 3. Model 1, estimated over 79 observations, and produced a McFadden's R2=0.1920 and a log likelihood statistic = -139.36. Model 2, estimated over 170 observations, and produced a McFadden's R2=0.1427 and log likelihood statistics =-183.54. Model 3, which had a sample size of only 61 observations, produced a McFadden's R2=0.1532 and a log likelihood statistics =-129.00. Model 4, estimated over the full sample of 310 observations, produced a McFadden's R2=0.1189 but a log likelihood statistic =-533.40, which indicated that the portioned sample had improved the fit. All four models passed their Wald likelihood ratio specification tests.
In Model 1 the travel cost coefficient marginally missed being significant at p<0.15, but all the other variables, except for the shark-cage dummy variable, were significant at this level. All the signs confirmed our prior expectations. Visitors who did not report travel expenses visited 0.923 times fewer in a year than visitors who reported travel expenses. Each additional R1 000 of income per month increased the expected number of visits per year by 0.032, while each additional party member (including additional children, increased expected trips by 0.457 trips per year. Those who indicated that they enjoyed travelling visited 0.746 times a year more that those who indicated that they did not. The expected number of trips per year by those who indicated being on a larger trip through southern Africa was 2.370 trips fewer than those who indicated that they were not on a larger trip. Visitors who indicated proximity to their homes as one of the main reasons for visiting the Agulhas Plain reported coming on 1.87 more trips to the Agulhas Plain than those for whom proximity to home did not matter. The effect of the new destination dummy was also quite large; those who stated the site's novelty as a major reason for visiting came on 3.33 trips fewer than visitors who did not indicate that the novelty of the Agulhas Plain was a major attraction.
The missing expenses dummy variable, party size and the new destination dummy variable were not significant in Model 2. The other coefficients carried the expected signs, including a negative sign on the travel cost variable and a positive sign on income. Each additional R1 000 of travel expenditure translated into 0.273 fewer trips per annum, while a similar income increment resulted in 0.01 fewer trips per annum. According to Model 2, visitors who enjoyed travelling would take 0.246 more trips per annum than people who did not enjoying travelling. Those who said they were on a larger trip recorded 0.30 trips fewer per annum than visitors who were not on a larger trip. The impact of shark-cage diving as a major attraction was -0.579 trips per annum, while the proximity impact was 0.337 trips per annum.
In Model 3, everything except party size and the larger trip dummy variable was significant. Income and missing expenses both had much larger marginal effects than before. The missing expenses dummy variable had a marginal effect of -3.549, twenty times larger than the corresponding coefficient in Model 2. Income had a marginal effect of 0.098, which was ten times larger than the corresponding coefficient in Model 2. The impact of the enjoy travel dummy variable was to reduce annual visits to the Agulhas Plain by 4.957 trips per annum. Where the enjoy travel dummy variable carried positive signs in the other models, it was not surprising that it had a negative sign in Model 3, since people who enjoy travelling are likely to spend more time abroad and therefore less time at their beach houses on the Agulhas Plain. The marginal effect of the shark-cage and the proximity dummy variable were -2.748 and +1.743 trips per annum respectively, while the novelty dummy variable had a marginal effect of 3.842 trips per annum.
The combined model produced significant coefficient estimates for all the variables except for the shark-cage dummy variable. Each additional R1000 of travel cost had a marginal impact of -0.395 trips per annum, while each additional R1000 of monthly income had a marginal effect of 0.050 trips per annum. Compared with visitors who did not report travel expenses, those who did report them visited 0.784 fewer times per annum. The marginal effect of party size was 0.225 visits per annum. The outcome of enjoying travelling was to visit 0.443 times more a year, while the result of taking larger trips was to visit 1.065 times fewer per annum. The marginal effect of the shark cage dummy variable was -0.318, while those who indicated proximity to home as a main reason for visiting would visit 1.498 times more per annum than those who did not list proximity as a reason for coming. Visitors who indicated the Agulhas Plain's novelty as a main reason for visiting did so 1.15 times fewer per annum than people who did not list novelty as an attraction.
c Welfare estimation
The Cape Agulhas lighthouse attracted an average of 25 251 visitors per annum between 2005 and 2009. Over the same period, the average number of visitors to the De Hoop Nature Reserve was 14 890 per annum, while the shark boat operators indicated that they received more than 60 000 visitors per annum. This put the total recorded visits at 100 141 per annum. Recorded visits were inflated by a factor of 4.02 to produce an estimate of unrecorded visits per annum. When totalled, these two figures produced an estimated 503 124 total visits to the site per annum.
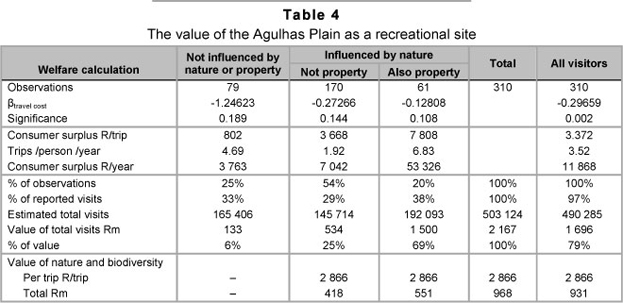
The value of the Agulhas Plain as a recreational site is summarised in Table 4 by type of visitor in columns 1, 2 and 3. These three separate estimates were added up in column 4, while the valuations for the un-partitioned sample appear in column 5. Line 1 contains the sample size, line 2 the estimated travel cost coefficient and line 3 the significance level of the estimate. Line 4 inverted line 2 to calculate the travel cost per trip. The answers ranged from R802 per trip for people who indicated that they did not care about nature and biodiversity to R7 808 per trip for regulars who indicated being attracted to the site by nature and biodiversity as well as property. The undifferentiated estimate of value was R3 372 per trip. These estimates encompassed the total recreation value for the site. The reported number of trips per person per year appears in line 5, which was multiplied by trips per year to calculate the consumer surplus per person per annum in line 6.
Lines 7 and 8 expressed each sub-sample as a proportion of the total in column 4, first for observations and then for visits. In line 9, the estimated total number of visits per annum of 503 124 was apportioned to each of the subsamples based on its share of visits (not observations). In line 10, these visits were multiplied by the consumer surplus per trip from line 4 to produce estimates of the total recreational value derived from each sub-sample. In line 11, the shares of the site's recreational value were calculated as follows: 6 per cent to visitors who do not care about nature and biodiversity, 25 per cent to visitors who care about nature but not about property and 69 per cent to people who are attracted by nature as well as their property in the area. The total recreational value of the Agulhas Plain across these three groups was R2.167 billion per annum. If the sample was not partitioned, the total valuation would be 21 per cent lower at R1.696 billion per annum. Lines 12 and 13 extracted nature and biodiversity's share of the total valuation, first as a share of the consumer surplus per trip, and then, by multiplying with total visits, as a total biodiversity value. The first sub-group by definition derived no value from nature and biodiversity. By subtracting R802 from R3 668, the net value of nature and biodiversity was established as R2 866 per trip for the second group. This same biodiversity value was assigned to group 3, which implied a beach house to account for R4 796 of recreation value per annum. It seemed reasonable, as the investment in a beach house was probably made in the first place because people value the area. The final estimate of the value of nature and biodiversity on the Agulhas Plain was R968 million per annum in 2010 prices.
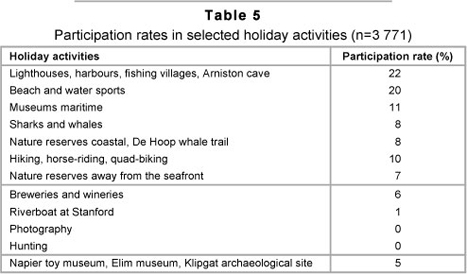
The data in Table 5 was used to divide the total terrestrial resources, including agriculture, for value of nature and biodiversity into the value 25 per cent of all reported holiday activities of marine and terrestrial resources. Marine- Visits to cultural attractions accounted for the based activities accounted for 69 per cent and remaining 5 per cent of total visits. Marine and terrestrial resources were therefore estimated respectively to be worth R668 million and R242 million per annum. The terrestrial value, interpreted here as the value of plant biodiversity, was R2 268 per hectare of protected, untransformed vegetation.
4 Discussion
The consumer surplus travel cost valuation is exceptionally sensitive to the specification of the demand curve and the number of visits per annum, by which it is scaled up from the sample to the population of visitors. Despite modest sample sizes, we are quite confident of having produced tight estimates of the demand curves for each visitor type. Unfortunately, we are less confident of our estimate of the number of annual visitors. For resource managers in the region to have more confidence in the valuation, better visitor statistics must be kept. For example, a survey of car traffic into the area at peak holiday times or even subjective measures of beach congestion could address this issue in a cost-effective way. The per trip consumer surplus estimates could then simply be multiplied by the revised visitor numbers to update the valuation. Nonetheless, the most directly comparable estimate of the recreational value for the Agulhas Plain appeared in the work by Turpie et al. (2003), who reported the Cape Floristic Region's share of annual tourism expenditure to amount to R2 556 per untransformed hectare in 2000 prices. Updated to 2010 prices, this valuation increased to R4 570 per untransformed hectare, which is double the value estimated in this study.
For local tourism product owners, the great loyalty expressed towards the region by all the visitors ought to be very reassuring. Regardless of specification, the demand for visits per annum was highly inelastic in transport expenditure; people who are going to visit the Agulhas Plain will continue to come, even if travel costs increase dramatically. However, an inelastic demand for visits is not quite the same as an inelastic demand for accommodation or entertainment. Even in the presence of inelastic travel demand, it is still possible for local product owners to price themselves out of the accommodation or restaurant food market, or for the municipality to raise rates and taxes to the extent that beach house owners relocate to cheaper destinations. Furthermore, one should keep in mind that the recreational values we discuss here arise from a public good and thus cannot be captured by private landholders. If society wants to change land use, landowners must be incentivised to do so. These results suggest that society could spend up to R2 866 per hectare per annum; without the incentive, private landholders will continue to raise wheat at R1 981 per hectare per annum. Finally, this study presented clear evidence that plant biodiversity might be substantially less valuable than is popularly believed; in the eyes of visitors, terrestrial resources are not as important as marine resources by any stretch of the imagination. This means that the maintenance and development of marine resources ought to be prioritised over the maintenance and development of terrestrial resources whenever resource managers face a budget constraint. Unfortunately this is not encouraging for conservation managers, who have been very hopeful in making a business case for fynbos conservation.
5 Conclusion
This paper set out to produce an estimate of recreational value for the Agulhas Plain as a single destination, and to derive from this total an estimate of the value of plant biodiversity per hectare of untransformed land. The recreation value of the Agulhas Plain was estimated to be R2.139 billion per annum and natural vegetation was estimated to be worth R2 866 per hectare. While the certainty of the estimate might be improved by keeping better visitor statistics and the total area by which biodiversity value should be spread might be debatable, we are quite confident that terrestrial biodiversity does not account for more than a quarter of the overall recreation values.
Acknowledgements
The research was funded by Cape Agulhas Tourism under the auspices of the Agulhas Biodiversity Initiative. We would like to thank CAT staff and product owners for assistance with the survey. Comments by Tony Leiman, Brain Child and two anonymous reviewers offered valuable input. Any remaining errors are our own.
References
ARRIVE ALIVE CAMPAIGN. 2011. Route Planner. Available at: http://www.arrivealive.co.za/routeplanner.aspx [accessed 2011-08-31] [ Links ].
AUTOMOBILE ASSOCIATION OF SOUTH AFRICA. 2010. Calculating the operating cost of a vehicle. Archived reports June 2010. Available at: http://www.aa.co.za/content/1247/june-2010/ [accessed 2011-08-31] [ Links ].
BELLU, L. & CISTULLI, V. 1997. Economic valuation of forest recreation services in the Liguria region (Italy). CSERGE Technical Paper 97-08, University of East Anglia, Norwich, and University College: London. [ Links ]
CAMPBELL, H. & BROWN, R. 2003. Benefit-cost analysis: Financial and economic appraisal using spreadsheets. Cambridge University Press:146-176. [ Links ]
CARR, L. & MENDELSOHN, R. 2003. Valuing coral reefs: A travel cost analysis of the Great Barrier Reef. Royal Swedish Academy of Sciences, 32:353-357. [ Links ]
CESARIO, F.J. & KNETSCH, J.L. 1970. Time bias in recreation benefit estimates. Water Resources, 6:700-704. [ Links ]
CESARIO, F.J. & KNETSCH, J.L. 1976. A recreation site demand and benefit estimation model. Regional Studies, 10:97-104. [ Links ]
CONRADIE, B. 2010. Farmers' views of landscape initiatives: The case of the Agulhas Plain, CFR. CSSR working paper 278. Available at: www.uct.ac.za/CSSR/ [accessed 2013-05-27] [ Links ].
COMMON, M., BULL, T. & STOECKL, N. 1997. The travel cost method: An empirical investigation of Randall's difficulty. CRES, Working Papers in Ecological Economics, Number 9705, ANU. [ Links ]
COWLING, R.M. & HOLMES, P.M. 1992. Flora and vegetation. In: Cowling, R.M. (ed.) The ecology of fynbos. Nutrients, fire and diversity. Oxford University Press: Cape Town:23-61. [ Links ]
COWLING, R.M. & MUSTART, P.J. 1994. Vegetation and conservation. Volume 2 Appendix 5. MLH Architects and Planners, Cape Town. [ Links ]
CREEL, M.D. & LOOMIS, J.B. 1990. Theoretical and empirical advantages of truncated count data estimators for analysis of deer hunting in California. American Journal of Agricultural Economics, 72:434-441. [ Links ]
DU PREEZ, M. & HOSKING, S.G. 2011. The value of the trout fishery at Rhodes, North Eastern Cape, South Africa: A travel cost analysis using count data models. Journal of Environmental Planning and Management, 54(2):267-282. [ Links ]
EGLIN, J. & SHONKWILER, J.S. 1995. Estimating social welfare using count data models: An application to long-run recreation demand under conditions of endogenous stratification and truncation. The Review of Economics and Statistics, 77:104-112. [ Links ]
FIX, P. & LOOMIS, J. 1997. The economic benefits of mountain biking at one of its meccas: An application of the travel cost method to mountain biking in Moab, Utah. Journal of Leisure Research, 29:342-352. [ Links ]
FREEMAN, A.M. 1993. The measurement of environmental and resource values: Theory and methods. Resources for the future, Washington D.C. [ Links ]
GARROD, G. & WILLIS, K.G. 1999. Economic valuation of the environment: Methods and case studies. Edward Elgar: UK. [ Links ]
GROGGER, J.T. & CARSON, R.T. 1991. Models for truncated counts. Journal of Applied Econometrics, 6:225-238. [ Links ]
GURMU, S. & TRIVEDI, P. 1996. Excess zeros in count models for recreational trips. Journal of Business and Economic Statistics, 14:469-477. [ Links ]
KERKVLIET, J. & NOWELL, C. 1999. Heterogeneous visitors and the spatial limits of the travel cost model. Journal of Leisure Research, 31:404-419. [ Links ]
LISTON-HEYES, C. & HEYES, A. 1999. Recreational benefits from the Dartmoor National Park. Journal of Environmental Management, 55:69-80. [ Links ]
LOCHNER, P., WEAVER, A., GELDERBLOM, C., PAERT, R., SANDWITH, T. & FOWKES, S. 2003. Aligning the diverse: The development of a biodiversity conservation strategy for the Cape Floristic Region. Biological Conservation, 112:29-43. [ Links ]
LOMBARD, A.T., COWLING, R.M., PRESSEY, R.L. & MUSTART, P.J. 1997. Reserve selection in a species-rich and fragmented landscape on the Agulhas Plain. South Africa Conservation Biology, 11: 1101-1116. [ Links ]
LOOMIS, J. 2003. Travel cost demand model based river recreation benefit estimates with onsite and household surveys: Comparative results and a correction procedure. Water Resources Research, 39: 1105-1109. [ Links ]
MARKANDYA, A., HAROU, P., BELLÜ, L. & CISTULLI, V. 2002. Environmental economics for sustainable growth: A handbook for practitioners. Edward Elgar: UK. [ Links ]
MARTÍNEZ-ESPIÑEIRA, R. & AMOAKA-TUFFOUR, J. 2008. Recreation demand analysis under truncation, overdispersion, and endogenous stratification: An application to Gros Morne National Park. Journal of Environmental Management, 88:1320-1332. [ Links ]
MARTÍNEZ-ESPIÑEIRA, R., AMOAKA-TUFFOUR, J. & HILBE, J.M. 2006. Travel cost demand model based river recreation benefits estimate with on-site and household surveys: Comparative results a correction procedure: Re-evaluation. Water Resources Research, 42: w10418 (1-4). [ Links ]
NARDI, P.M. 2006. Doing survey research: A guide to quantitative methods. Pearson: Boston. [ Links ]
PRIVETT, S.D.J. 2002. Agulhas Biodiversity initiative: sustainable harvesting component. Agulhas Biodiversity Initiative: Bredasdorp. [ Links ]
RAIMONDO, D., VON STADEN, L., FODEN, W., VICTOR, J.E., HELME, N.E., TURNER, R.C., KAMUNDI, D.A. & MANYAMA, P.A. 2009. Red list of South African plants 2009. Strelitzia 25, South African National Biodiversity Institute: Pretoria. [ Links ]
REA, L.M., PARKER, R.A. 2005. Designing and conducting survey research: A comprehensive guide. Jossey-Bass: San Francisco. [ Links ]
ROSENTHAL, D.H. 1987. The necessity for substitute prices in recreation demand analyses. American Journal of Agricultural Economics, 69:828-837. [ Links ]
SHRESTHA, K.R., SEIDL, A.F. & MORAES, A.S. 2002. Value of recreational shing in the Brazilian Pantanal: A travel cost analysis using count data models. Ecological Economics, 42:289-299. [ Links ]
THWAITES, R.N. & COWLING, R.M. 1988. Soil-vegetation relationships on the Agulhas Plain, South Africa. Catena, 15:333-345. [ Links ]
TURPIE, J.K., HEYDENRYCH, B.J. & LAMBERTH, S.J. 2003. Economic value of terrestrial and marine biodiversity in the Cape Floristic Region: Implications for defining effective and socially optimal conservation strategies. Biological Conservation, 112:233-251. [ Links ]
TURPIE, J.K. & JOUBERT, A. 2001. Estimating potential impacts of a change in river quality on the tourism value of Kruger National Park: An application of travel cost, contingent and conjoint valuation methods. WaterSA, 27:387-398. [ Links ]
WARD, F.A. & BEAL, D. 2000. Valuing nature with travel cost models: A manual. Edward Elgar, UK. [ Links ]
ZIEMER, R.F., MUSSER, W.N. & HILL, R.C. 1980.Recreation demand equations: Functional form and consumer surplus. American Journal of Agricultural Economics, 62:136-141. [ Links ]
Accepted: November 2012

