


Serviços Personalizados
Artigo
 Inglês (pdf)
 Artigo em XML
 Referências do artigo
Indicadores

Links relacionados
-
 Citado por Google
 -
 Similares em Google
Compartilhar

 Permalink
South African Journal of Economic and Management Sciences
versão On-line ISSN 2222-3436
versão impressa ISSN 1015-8812
S. Afr. j. econ. manag. sci. vol.16 no.2 Pretoria Jan. 2013
ARTICLE
An international comparison of inflation credibility surveys
Jannie RossouwI; Fanie JoubertI; Vishnu PadayacheeII
IDepartment of Economics, University of South Africa
IIInstitute for Social and Economic Research, Rhodes University
ABSTRACT
This paper analyses the methodology used in assessing inflation credibility (i.e. perceptions of the accuracy of historical inflation rates) in countries targeting inflation, and compares the approaches used in New Zealand, South Africa and Sweden. The results indicate an implied inverse (or negative) relationship in all but one instance, between the direction of actual inflation and the perception of inflation among the respondents. The analysis also shows a lack of knowledge about inflation and price increases among South African respondents, which is absent from similar surveys in New Zealand and Sweden. Important research questions identified include possible links between inflation credibility and the adoption date of inflation targeting, as well as the type and range of targets used.
Key words: inflation, inflation credibility, inflation expectations, inflation perceptions, inflation surveys
JEL: E31, 52, 58,63
1 Introduction
This paper compares inflation credibility surveys (i.e. perceptions of the accuracy of historical inflation rates) undertaken by means of sampling in three countries targeting inflation: New Zealand, South Africa and Sweden. Inflation credibility as used in this paper focuses on the acceptance of past inflation figures as an accurate indication of price increases. New Zealand, South Africa and Sweden are the only inflation-targeting countries where inflation credibility is measured. Inflation credibility is referred to in some literature as inflation perceptions (see, for instance, Allen, Baumgartner & Rajan, 2006; Blinder & Wyplosz, 2005; or Döhrmg & Mordon, 2007). It is measured among individual respondents, and reported as views in households on historic inflation. Inflation credibility as used in this paper does not describe the credibility of the monetary policy actions by central banks (see, for instance, Mishkin, 2004).
The measurement of inflation expectations, which are the expected future rates of change in the price level, is also reported in the literature (see, for instance, Brachinger, 2005; or Rossouw, Padayachee & Bosch, 2009a, for an analysis of inflation expectations). All countries targeting inflation consider inflation expectations, but only three of these countries consider the credibility of inflation figures.
In New Zealand and Sweden, inflation credibility surveys are undertaken regularly, while only three representative surveys were previously undertaken (2006, 2008, 2010) in South Africa. Rossouw, Padayachee & Joubert (2009b) provided early indications that accelerating inflation could result in deteriorating inflation credibility and pointed out that similar studies conducted during periods of decelerating and subdued inflation were required. This leads to the pre-emptive question as to whether we can hypothesise that inflation trends and inflation credibility have an inverse relationship.
This paper expands on earlier research by comparing the methodology used by New Zealand, Sweden and South Africa in measuring inflation credibility. However, it should be borne in mind that these countries are not all at the same level of development and that there are other important differences pertaining to inflation-related indicators, which is explained below. The contribution of this paper is that it highlights the challenges involved in making such comparisons, despite inter-country differences. This paper also adds to the limited available literature on inflation credibility surveys.
This paper is organised as follows: Section 2 reviews literature on inflation expectation and credibility surveys. Section 3 describes methodologies used in assessing inflation credibility. Section 4 analyses and compares the survey results. Section 5 aims to further clarify some of the results obtained by providing a comparison of economic and historical inflation-targeting characteristics of inflation credibility surveying countries, while conclusions are set out in section 6.
2 Literature review
Vega and Winkelried (2005:165) used a definition by the International Monetary Fund (IMF) (2005:161 and 162) to identify 23 inflation countries which had targeted inflation by 2005. Allen et al. (2006:5) used the same definition and identified the same countries as inflation-targeters by 2006. Ghana (2007), Serbia (2009) and Turkey (2006) subsequently adopted inflation-targeting (see, for instance, Addison, 2008:1; Amoah & Mumuni, 2008:16 or Rossouw et al., 2009a:476).
Subsequently, Poland adopted the Euro as a currency and entered the Eurozone. The Eurozone is not recognised as an inflation-targeter, owing to its focus on money supply. This currently leaves 25 countries as inflation-targeters. This concurs with the findings of Odhiambo (2011:11), who states that 25 countries were targeting inflation by 2011.
The literature review shows that all the countries identified in this paper use inflation expectations in their policy decisions. Inflation expectations inform policy decisions owing to their forward-looking nature, as economic agents often act in accordance with their expectations. Expectations of higher future inflation could therefore influence current decisions about investment, spending and saving. However, little attention has been focused on the methodology used to assess inflation expectations (see, for instance, Bank for International Settlements, 2008; Blinder & Wyplosz, 2005; or Ehrmann & Fratzscher, 2005), although these samples are used by central banks to evaluate the success of their inflation-fighting policies (see, for instance, Kershoff &Laubscher, 1999:6).
Rossouw et al. (2009a:476) considered the methodology used by inflation-targeting countries to assess inflation expectations. By means of summary, Rossouw et al. (2009a) reported that the central bank of one country (Slovakia) uses only interest rate differentials on different classes of traded financial assets as an indicator of inflation expectations. Central banks in eight other countries (Canada, Chile, Colombia, Iceland, Israel, Mexico, Sweden and Thailand) consider both interest rate differentials and surveys of inflation expectations. Central banks in 13 countries (Australia, Brazil, the Czech Republic, Ghana, Hungary, Indonesia, New Zealand, Norway, Peru, the Philippines, Poland, Romania and South Korea) consider only inflation expectation surveys. Lastly, central banks in two countries (South Africa and the United Kingdom) consider inflation expectation surveys, interest rate differentials on traded financial assets and inflation forecasts reported as inflation expectations. The difference between inflation forecasts and inflation expectations might be somewhat superfluous. While both are indications of future expectations, the former purports to be somewhat more systematic and scientific than the latter.
It is not only within the realm of inflationtargeting countries that people's awareness of officially-published statistics plays an important role in research. Curtin (2010:2) brings the academic question down to the man on the street, when he notes that "(t)he worldwide financial crisis has provoked an intense public interest in the performance of the economy". He asks: "Who could not have heard news about changes in GDP, unemployment, or the inflation rate?" Despite this preemptive hypothesis, research conducted by the University of Michigan is of particular interest to this paper.
This research used a representative sample of all households in the United States, finding the median absolute percentage point error in reports of the current official CPI inflation rates to have risen to 3.08 in 2009, from 0.78 in 2007. Curtin argues that "the general lack of knowledge of the official CPI does not necessarily mean that people do not know about inflation, only that they possibly do not know the official rate most recently published by a government agency" (Curtin, 2010:18). Also highlighted is the fact that, unlike in 2007, the rate of change in the headline CPI inflation rate in the United States at the time of the survey in 2009 was negative, although the core inflation rate was still positive. This adds another research dilemma in the form of whether negative numbers place a higher cognitive burden on people's ability to recall official figures or to form accurate perceptions (Curtin, 2010:8)
3 Methodology for assessing inflation credibility
This paper analyses the surveys carried out in New Zealand and Sweden and compares the results with those obtained in South Africa, where the sampling is undertaken independently from the central bank.
Inflation credibility surveys place a decidedly retrospective focus on historical price increases inasmuch as they assess possible perceptions that the actual cost of living increases exceeded price increases reflected by historic inflation figures, as explained above. Such perceptions require attention, as they cast doubt on the accuracy and credibility of historical inflation figures (see, for instance, Brachinger, 2005:1; Del Giovane & Sabbatini, 2005:4; Dohring & Mordon, 2007:1; or Issing, 2006:211, on this matter).
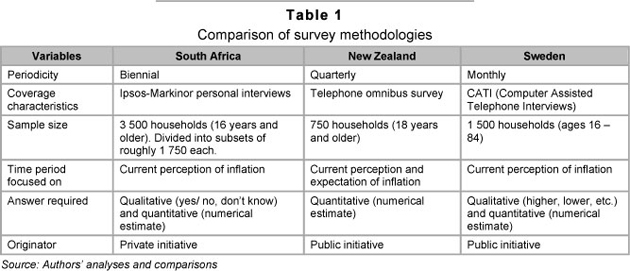
Little effort has been made to date to compare the results of inflation credibility surveys in inflation-targeting countries. As a result no generally accepted measure to compare these surveys over time or between countries has been developed. Given this constraint in the literature, the rest of this section briefly highlights differences in methodologies used in three inflation-targeting countries (New Zealand, Sweden and South Africa). A summary of the survey techniques and methodologies used is provided in Table 1 below.
New Zealand
The Reserve Bank of New Zealand obtains quarterly survey data results about inflation credibility and the accuracy of historical inflation figures from their household inflation survey. These surveys date back to 1995. Respondents are asked three questions, but only the first of them ("Based on your own opinions and what you've seen and heard, what do you think the inflation figure is now?") is within the scope of this paper. The second and third questions cover inflation expectations. The responses to the first question are used to obtain views on median and mean current inflation, as explained in more detail in the next section.
The central bank uses UMR Research's nationwide omnibus telephone survey of 750 people aged 18 years and older to sample the perceptions of the population. Interviews are carried out with one person per household. The central bank receives a confidential report based on the aggregated responses and publishes key survey results on its website (Reserve Bank of New Zealand, [S.a.]).
Sweden
The measurement of inflation perceptions in Sweden forms part of the monthly Consumer Tendency Survey of GfK Sverige AB, conducted on behalf of the National Institute of Economic Research (NIER, [S.a.]) and the Commission of the European Communities. The surveys date back to 1973, although the methodology and the institutions used for surveying purposes have changed from time to time over this period. The survey comprises 16 sections, but this paper focuses only on section five (which in itself consists of six variable sub-sections). In this section, respondents are requested to indicate whether they perceive prices to be the same, higher or lower than they were 12 months before. Depending on the answer provided, respondents are then requested (as the follow-up question) to provide a numerical estimate (in percentage terms) of their perceived rate of inflation (GfK Sverige AB, [S.a.]).
The methodology behind GfK's Master Sample is complex and very advanced and is based on a priori stratification of municipalities according to a set of variables, seen as relevant for marketing surveys. (For a more detailed discussion of this survey methodology, see, for instance, Rossouw et al., 2009b.)
South Africa
Bi-ennial inflation credibility surveys have been undertaken since 2006 in South Africa as a private initiative. Ipsos-Markinor, a market research company, has been used for this purpose since 2006, with subsequent follow-up bi-ennial surveys undertaken in 2008 and 2010. The M-bus questionnaire of Ipsos-Markinor is used for this purpose. This approach was selected for use in South Africa to ensure responses from a representative sample of the population. Other approaches (e. g. telephone sampling) cannot be used in South Africa, where a representative response is required (see, for instance, the National Gambling Board, 2005:5 in this regard, owing to a low percentage of people with fixed-line telephones).
In the survey procedure used by Ipsos- Markinor, every person in South Africa who is 16 years and older has a random chance of selection as a respondent. Personal interviews are conducted with 3 500 respondents, with a minimum of 20 per cent of each interviewer's work being back-checked. The survey results can be classified, inter alia, in terms of gender, income and employment status.
In 2006 and 2008, respondents were provided with the inflation rate at the time of the survey, and then asked if they perceived this to be a true reflection of average price increases. Possible responses were limited to "Yes", "No", and "Don't know". Owing to a large percentage (over 50 per cent) of respondents opting for the "Don't know" response in both 2006 and 2008, the approach was reviewed in 2010 in an attempt to improve the usability of the results. The large sample (3 500 respondents) allowed it to be broken into two sub-samples, and different statements and questions were put to these two groups of respondents. However, it should be noted that this approach increased by about three times the cost of sampling. Given the results explained below and in view of the increased cost of the survey, the approach used will be reconsidered in an attempt to contain costs when the next biennial survey is undertaken.
In respect of respondents in one of the sub-samples, the same approach as before was used. This group of respondents was again asked to respond "Yes, "No" or "Don't know" to a question about their perception as to whether the most recent rate of inflation accurately reflects average price increases. In addition to the earlier two samples (2006 and 2008), respondents who answered "No" were asked to provide a numerical value of their perception of historical price increases.
In respect of the second sub-sample, respondents were asked to respond to "South Africa's prices increased by 3,5 per cent over the past year between August 2009 and August 2010. By how much do you personally think prices have changed in per cent?" The respondents had to provide a numerical value. This approach did not resolve the problem explained above, as 76 per cent of respondents still indicated that they "Don't know" by how much prices have changed. The survey results are discussed in the next section.
4 Comparing survey results
The results are analysed using the distinction between qualitative and quantitative data. A further distinction is drawn between the 20062008 and 2008-2010 periods. Findings from the two methods are compared at the end of the section.
Results for qualitative data
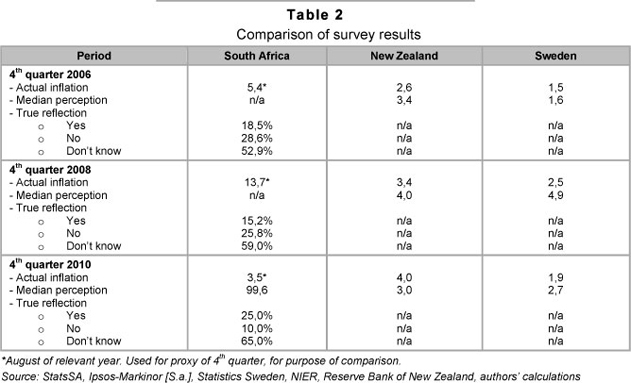
When it comes to the qualitative data for South Africa, the results show that actual inflation accelerated between the 2006 to 2008 samples (i.e. 5,4 per cent to 13,7 per cent), which in turn led to a deterioration in inflation credibility ('Yes' answers decreased from 18,5 per cent to 15,2 per cent).
For the period 2008 to 2010, the results show that actual inflation decelerated between the samples (i.e. 13,7 per cent to 3,5 per cent), which in turn led to an improvement in inflation credibility ('Yes' answers increased from 15,2 per cent to 25,0 per cent).
Results for quantitative data: 2006 - 2008
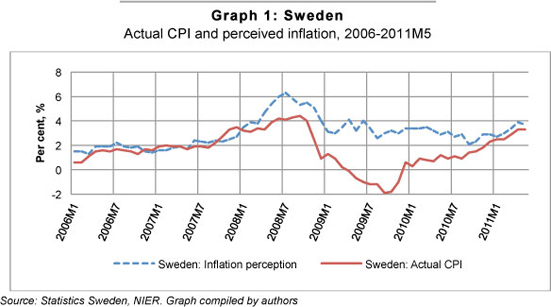
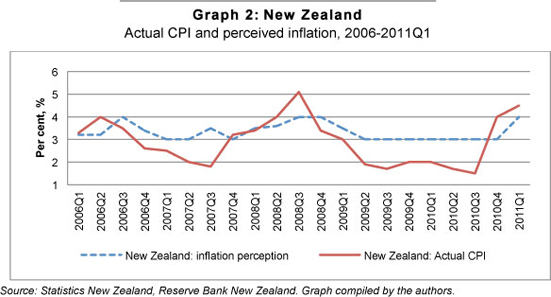
Table 2 shows that acceleration in actual inflation between 2006 and 2008 in New Zealand and Sweden translated into deterioration in respondents' perceptions of inflation. This is indicated by an increase in the median inflation perceptions of respondents in both countries, during the relevant time period. Also noteworthy is the difference in magnitude of these deteriorations, which measured a rise of 0,6 percentage points (i.e. 3,4 per cent to 4,0 per cent) for New Zealand, compared to 3,3 percentage points (i.e. 1,6 per cent to 4,9 per cent) for Sweden.
Results for quantitative data: 2008 - 2010
Between 2008 and 2010, actual inflation decelerated in both South Africa and Sweden, but accelerated in New Zealand. In Sweden, the deceleration in actual inflation led to an improvement (decrease) in the median inflation perception.
For New Zealand the acceleration in actual inflation leads (contrary to expectations) to an improvement (decrease) in the median inflation perception. However, one should note the sudden rise in New Zealand's inflation between 2010Q3-Q4 in graph 2 below, which was probably not yet evident to consumers (or their pockets) at the time of the survey and possibly explains the unexpected finding.
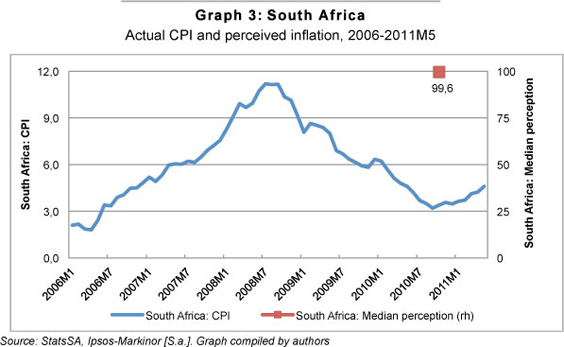
For South Africa, there is only one median inflation perception data point (2010), so there is not enough information to indicate directional change. However, what becomes clear immediately is the substantial difference between actual inflation (3,5 per cent) and the median inflation perception (99,6 per cent!) (see also Graph 3). Section 5 highlights a few economic and historical inflation-targeting characteristics of the countries surveying inflation credibility, which could provide some insight into inter-country discrepancies.
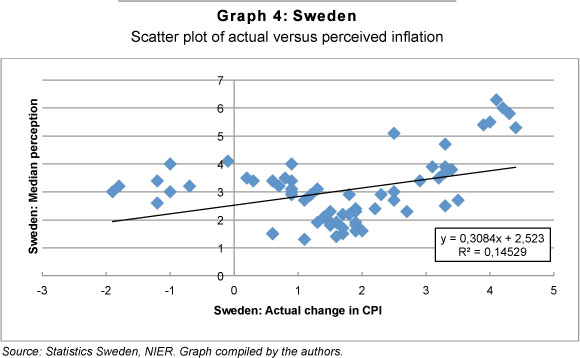
Scatter plots of the data can be used to provide some measure of the correlation between changes in actual inflation and inflation perceptions. In addition, by fitting a linear regression line, the relationship between the data can be analysed in more detail. The advantage of this analysis is the use of time-series data over a range of intervals. As time series data is not yet available for South Africa, this type of analysis could be performed only for Sweden and New Zealand.
Using the median perception of inflation in Sweden as our dependent variable and the actual rate of change in CPI as the explanatory variable, the fitted linear regression line provides a positive slope coefficient (+0.3084). This confirms our earlier expectations of a negative relationship between actual inflation and the perception of inflation for the Swedish sample. It should be borne in mind that an increase in the median perception is seen as a deterioration in inflation perceptions.
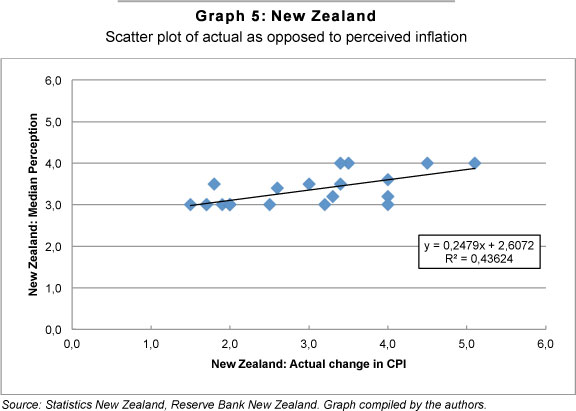
Using the median perception of inflation in New Zealand as our dependent variable and actual rate of change in CPI as the explanatory variable, the fitted linear regression line again provides a positive slope coefficient (+0.2479). This again confirms our original expectations of a negative relationship between actual inflation and the perception of inflation, remembering that an increase in the median perception is seen as a deterioration in inflation perceptions. It is also important that this contradicts the finding for New Zealand when using only the two reference points of 2008 Q4-2010 Q4 in Table 2.
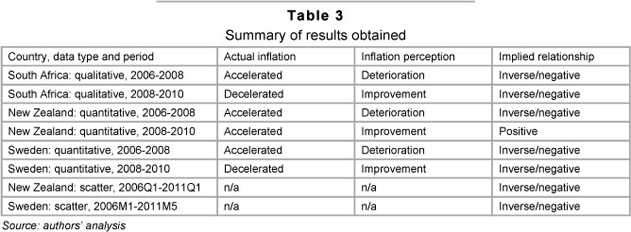
In all but one of the results set out in Table 3. there seems to be an implied negative relationship between actual inflation figures and the perception of inflation. This was true of all three countries tested as well as for both types of data used. In trying to explain the one contradictory finding for New Zealand during 2008-2010, it is worth noting (as also stated above) the sudden acceleration in actual New Zealand inflation between 2010Q3 and Q4. It is also important to note that, using the results of the regression (and thus more data points), the finding revealed the same inverse/negative relationship as that obtained from all the other samples.
5 Comparison of inflation credibility surveying countries
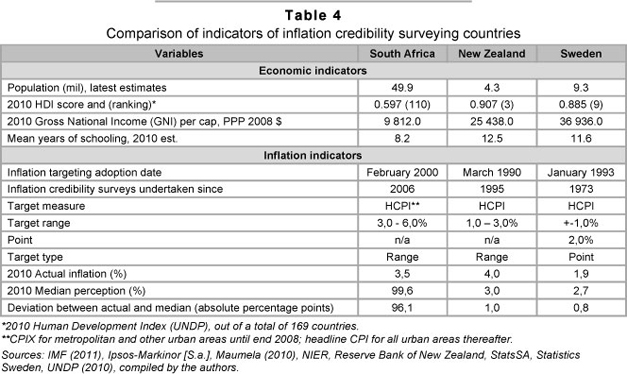
This section considers a few economic and historical inflation-targeting characteristics to provide possible answers to the huge discrepancy found in the deviation between actual inflation and the median perception between South Africa, New Zealand and Sweden. However, the aim of this paper is to compare results between the three countries, while possible future country-specific analysis (especially for South Africa) should provide meaningful further insights. In absolute terms, the percentage point deviation between actual inflation and the median perception during the last quarter of 2010 was 96,1 for South Africa, 1,0 for New Zealand and 0,8 for Sweden.
Economic indicators
A comparison of key economic and population characteristics shows that there are some meaningful differences between South Africa, New Zealand and Sweden. According to the 2010 Human Development Index (HDI) of the United Nations Development Program (UNDP), New Zealand and Sweden both scored in the top ten HDI countries and are classified as 'very high human development'. South Africa was ranked 110th and falls under the category of 'medium human development' (UNDP 2010:144-45). In terms of population size, South Africa is roughly ten times larger than New Zealand and five times larger than Sweden. This difference in population size contributes to South Africa's per capita Gross National Income (GNI) measuring only around a third to a quarter of New Zealand's and Sweden's GNI. A summary of these figures is provided in Table 4.
Another significant difference between the countries is found in the mean years of schooling of the average person. According to the UNDP, the average years of school attendance is 8,2 for South Africa, compared to 12,5 years for New Zealand and 11,6 years for Sweden (UNDP, 2010:144-45). Using the South African schooling system as a measure, this implies that the average person in New Zealand and Sweden has obtained at least a secondary school qualification, while the average South African barely progresses beyond primary school. This should have serious implications as far as the average person's literacy and numerical skills are concerned. The concept of inflation and its measuring instruments, including indices, the calculation of percentage changes and annual changes, are all fairly advanced numerical concepts. The meaningful difference in schooling could provide some insight into the huge discrepancy found in the deviation between actual inflation and the median perception between South Africa, New Zealand and Sweden.
Inflation indicators
The historical adoption date of inflation targeting as a monetary policy framework differs by up to a decade between South Africa and New Zealand and around seven years between South Africa and Sweden. As far as the argument about the role of education is concerned, it seems evident that educating the public about concepts such as inflation, inflationtargeting and personal inflation takes time. This means that countries where inflationtargeting has been practiced for a longer period have had more time to educate the public about these concepts, which could support the suggestion that people were more inclined to accept the actual inflation figures as correct.
Inflation credibility surveys 'force' people to think about inflation, which, over time, could encourage them to be more aware of inflation developments. However, it should be noted that looking at historical survey data for both New Zealand and Sweden, the deviations between actual inflation and inflation perceptions never reached the proportions observed in the first quantitative sample in South Africa.
A related question is that of whether people would more easily understand a single point or a range as an inflation target. For our three sampled countries, the smallest deviation between actual inflation and the median perception was obtained by Sweden (i.e. a deviation of only 0,8 percentage points), which uses a point target of around 2,0 percent.
Lastly we could ask whether the target measure used could have any influence on people's perception of inflation. Especially relevant for South Africa is the change in the target at the end of 2008 from CPIX for metropolitan and other urban areas to the headline CPI for all urban areas. However, for this to be true, it would first be necessary to prove the theoretic link (if any) between the target measure and how people perceive the impact of inflation on their own pockets.
This analysis shows clearly that an improvement in the general level of understanding of the rate of inflation (and price changes) is the result of communication over many years. A particular challenge facing communication aimed at enhancing the understanding of the rate of inflation is the fewer number of years of formal school education.
6 Conclusion
This paper compared inflation credibility surveys undertaken by means of sampling in three countries targeting inflation: New Zealand, South Africa and Sweden. Conclusions that can be drawn from the results are highlighted below.
The results indicate an implied inverse (or negative) relationship, in all but one instance, between the direction of actual inflation and the perception of inflation amongst the respondents. This implied inverse (or negative) relationship was obtained by using both qualitative and quantitative data and were seen in all three of the sampled countries.
A much larger discrepancy was found in the deviation between actual inflation and the median perception in South Africa, as compared to relatively small deviations in New Zealand and Sweden. This shows a possible lack of knowledge of inflation among South African respondents, which is not reflected in similar surveys in New Zealand and Sweden.
Possible economic and population character-ristics contributing to the larger discrepancy found in the deviation between actual inflation and the median perception in South Africa include a meaningfully larger population size, but a smaller GNI per capita in comparison with that in New Zealand and Sweden. The significantly shorter mean years of schooling of the average South African could also provide insight into the huge discrepancy found in the deviation between actual inflation and the median perception between South Africa, New Zealand and Sweden
The results indicate a smaller discrepancy between actual inflation and the perception of inflation in countries in which inflationtargeting as policy has been adopted for a longer period. Similarly, there was also a smaller discrepancy in countries in which inflation credibility surveys have been undertaken over a longer period.
The smallest discrepancy between actual inflation and the perception of inflation was recorded for Sweden, which has a point target. This leads to the question of whether using a point target supports inflation perceptions relative to having a range target.
The greatest discrepancy between actual inflation and the perception of inflation was obtained in South Africa, which has the least restrictive (highest numerical value) inflation target of the three countries sampled.
The aim of this paper is to compare the results for the three countries while possible country specific analysis (especially for South Africa) should provide meaningful further insights.
Lastly, in terms of questionnaire design, adding questions to the 2010 South African survey, which provided quantitative-type data, definitely broadened the scope for the comparison of South African results with other countries. The inclusion of this type of question should be retained in future inflation credibility surveys.
References
ADDISON, E. 2008. Monetary policy and price stability in the West African Economic and Monetary Union (WAEMU) zone: Constraints and challenges. 16-17 June. Dakar, Senegal. [ Links ]
ALLEN, M., BAUMGARTNER, U. & RAJAN, R. 2006. Inflation targeting and the IMF. Washington: International Monetary Fund. [ Links ]
AMOAH, B. & MUMUNI, Z. 2008. Choice of monetary policy regime in Ghana. Bank of Ghana Working Paper, WP/BOG - 2008/07. July. [ Links ]
BANK FOR INTERNATIONAL SETTLEMENTS. 2008. Monetary policy decisions: Preparing the inputs and communicating the outcomes. BIS papers No. 37. Bank for International Settlements. [ Links ]
BLINDER, A.S. & WYPLOSZ, C. 2005. Central bank talk: Committee structure and communication policy. Paper presented at Central bank communication, ASSA meetings, Philadelphia. 9 January. [ Links ]
BRACHINGER, H.W. 2005. Measuring perceived inflation: A prospect theory approach. International Statistical Institute, Voorburg, The Netherlands. 55th session in Sydney. 5 to 12 April. [ Links ]
CURTIN, R. 2010. The impact of the economic crisis on consumers' knowledge about economic statistics. University of Michigan. 30th CIRET conference, New York, October. [ Links ]
DEL GIOVANE, P. & SABBATINI, R. 2005. The introduction of the euro and divergence between officially measured and perceived inflation: The case of Italy. Paper read at the OECD seminar on Inflation measures: Too high - too low - internationally comparable? Paris. 21 and 22 June. [ Links ]
DÖHRING, B. & MORDON, A. 2007. What drives inflation perceptions?: A dynamic panel data analysis. Economic Papers No 284. Directorate-General for Economic and Financial Affairs of the European Commission. July. [ Links ]
EHRMANN, M. & FRATZSCHER, M. 2005. How should central banks communicate? European Central Bank Working Paper Series, No. 557. [ Links ]
GfK SVERIGE AB. [S.a.]. Consumer Tendency Survey. Available at: http://www.gfksverige.se [accessed on various dates] [ Links ].
INTERNATIONAL MONETARY FUND (IMF). 2005. World Economic Outlook. September. [ Links ]
INTERNATIONAL MONETARY FUND (IMF). 2011. World Economic Outlook Database, April 2011. Available at: www.imf.org [accessed on various dates] [ Links ].
IPSOS-MARKINOR. [S.a.]. Ipsos-Markinor surveys of 2006, 2008 and 2010. Ipsos-Markinor: Johannesburg. [ Links ]
ISSING, O. 2006. Einführung in die Geldtheorie. 14., Auflage. Verlag Franz Vahlen: München. Translation assistance by Mr H. H. van Gass, SA Reserve Bank. [ Links ]
KERSHOFF, G.J. & LAUBSCHER, P. 1999. Measuring inflation expectations - the international experience. Publication of the Bureau for Economic Research: University of Stellenbosch. 24 December. [ Links ]
MAUMELA, P.K. 2010. Is inflation targeting an appropriate framework for monetary policy? Experience from the inflation-targeting countries. Master's degree dissertation. University of South Africa. August 2010. [ Links ]
MISHKIN, F.S. 2004. The economics of money, banking andfinancial markets. 7th edition, Addison-Wesley Publishing Company, Inc: United States of America. [ Links ]
NATIONAL GAMBLING BOARD. 2005. Socio-economic impact of legalised gambling in South Africa. National Gambling Board: Pretoria. [ Links ]
NIER (NATIONAL INSTITUTE OF ECONOMIC RESEARCH). [S.a.]. Tendency Surveys. Kungsgatan 1214, Stockholm: Sweden. Available at: http://www.konj.se [accessed on various dates] [ Links ].
ODHIAMBO, N. 2011. Twenty years of inflation targeting. What can African countries learn from this policy? Africagrowth Agenda. January to March. [ Links ]
RESERVE BANK OF NEW ZEALAND. [S.a.]. J5 Marketscope Survey - Expectations of inflation. Available at: http//.www.rbnz.govt.nz [accessed on various dates] [ Links ].
ROSSOUW, J., PADAYACHEE, V. & FOURIE, J. 2008. Central Bank employees and inflation credibility. Central Banking, Vol XIX:2. November. [ Links ]
ROSSOUW, J., PADAYACHEE, V. & BOSCH, A. 2009a. Links or disconnect: A first consideration of inflation expectations and inflation credibility, with specific reference to South Africa. South African Journal of Economics and Management Science, 12(4):475-492. [ Links ]
ROSSOUW, J., PADAYACHEE, V. & JOUBERT, S.J. 2009b. Surveying inflation credibility. Central Banking. London: May 2010, 20(4):91-96. [ Links ]
STATISTICS SWEDEN. Consumer Price Index (CPI). Available at: http://www.scb.se/Pages/TableAndChart_115818.aspx [accessed on various dates] [ Links ].
STATISTICS NEW ZEALAND. Consumer Price Index (CPI). Available at: http://www.stats.govt.nz [accessed on various dates] [ Links ].
STATSSA. [S.a.]. Available at: www.statssa.gov.za [accessed on various dates] [ Links ].
UNITED NATIONS DEVELOPMENT PROGRAMME (UNDP) 2010. Human Development Report 2010. Available at: http://www.beta.undp.org [accessed on various dates] [ Links ].
VEGA, M. & WINKELRIED, D. 2005. Inflation targeting and inflation behavior: A successful story? International Journal of Central Banking, 1(3): 153-175 [ Links ]
Accepted: November 2012

