


Servicios Personalizados
Articulo
 Inglés (pdf)
 Articulo en XML
 Referencias del artículo
Indicadores

Links relacionados
-
 Citado por Google
 -
 Similares en Google
Compartir

 Permalink
South African Journal of Economic and Management Sciences
versión On-line ISSN 2222-3436
versión impresa ISSN 1015-8812
S. Afr. j. econ. manag. sci. vol.16 no.1 Pretoria ene. 2013
ARTICLES
Prevalence of sustainability reporting practices of a sample of listed companies on established and emerging stock exchanges
Brendan K Turk; Charlie M Shackleton; Kevin Whittington-Jones
Department of Environmental Science, Rhodes University
ABSTRACT
The business sector has a substantial role in addressing current environmental issues and concerns. Consequently, there is a growing adoption of corporate sustainability principles and practices across all market sectors. This study examined four developed and four emerging stock markets and the sustainability reporting practices of the top 20 and bottom 20 companies in each. The results illustrate that the developed market sector was more advanced in its corporate sustainability reporting, both in the proportion of companies issuing a sustainability report (approximately 60 per cent) and the proportion of company webpages dedicated to sustainability reporting. This difference was largely due to the effect of the top 20 companies. There was little difference between developed and developing markets when only the bottom 20 companies were considered, of which less than one-third provided sustainability reports. These results show that sustainability reporting is prevalent in both developed and developing markets, especially among market leading companies, but that overall, most developing markets have some catching up to do.
Key words: corporate social responsibility, corporate sustainability, global stock markets, listed companies, sustainable development, sustainability reporting
1 Introduction
Business operations create environmental and social costs that are rarely included in the market value of the product or service, with consequent losses in human welfare (Ekins, 1997). For example, "in 2008, the world's 3,000 largest public companies by market capitalization were estimated to be causing US$2.15 trillion of environmental damage, equivalent to 7 percent of their combined revenues and 50 percent of their combined earnings" (KPMG, 2012a). However, companies are increasingly aware that implementing environmentally and socially responsible practices can have favourable results for their public profile and long-term financial success (Eweje, 2011; SIRAN, Social Investment Forum and KLD, 2008). Transparency, through corporate sustainability (CS) principles, such as sustainability reporting (SR), allows companies to appeal to a broader market base, attract more investors, improve operating efficiencies and assume leadership positions in the market place (SIRAN, Social Investment Forum and KLD, 2008). In 2009, over 11 per cent of professionally managed assets in the USA and 17 per cent in Europe were directly linked to socially responsible investment (Siddy, 2009). From the first in the late 1990s, there are now approximately fifty sustainability indices across the leading fifty or so stock exchanges internationally (Siddy, 2009).
1.1 Corporate sustainability
Corporate sustainability (CS) is an evolving approach or ethos in which businesses take responsibility for their impacts on stakeholders and the environment, and attempt to avoid or mitigate such impacts (Azapagic, 2003; Wilson, 2003). Sustainability reporting is an emerging trend in CS as a result of public pressures (Eweje, 2011; Krajnc & Glavic, 2005), and more recently government regulations (Berns et al., 2009; KPMG, 2012b) and peer pressure in the form of stock exchange reporting standards and indices (Panwar & Blinch, 2012). CS considers the importance of corporate growth and profitability, while being cognisant of societal needs for social justice and equity and environmental protection (Wilson, 2003). The four pillars of CS are (i) sustainable development, (ii) corporate social responsibility (CSR), (iii) stakeholder theory (when companies cater to the interest and concerns of their stakeholders and capitalise on these over appropriate time-scales), and (iv) corporate accountability (Wilson, 2003). To be successful, any CS strategy must emerge from and be embedded within the company's vision and strategy (Azapagic, 2003).
Over the past decade or so, investors, suppliers and consumers have begun to demonstrate increased awareness of and interest in social and environmental dimensions of companies in which they invest or with whom they do business (Eweje, 2011; French, 2000; Madsen, Sinding & Ulhoi, 1997; Sharma, 2006). Therefore, investment in sustainability programmes, environmental markets and green products has shown exponential growth (Azapagic, 2003; Fields, 2002; KPMG, 2012b). Adopting a proactive environmental approach provides companies with a competitive edge and frequently has a favourable impact on the company's value in the market place (Fields, 2002; French, 2000). Despite this, some companies fail to recognise the long-term, substantial benefits of sustainability (Davidson, 2004; KPMG, 2012b). The Global Reporting Initiative (GRI) was launched in 1997, and, in conjunction with the United Nations Environment Programme (UNEP), produces guidelines for sustainability reporting (French, 2000).
Rikhardsson, Andersen and Bang (2002) estimated that there were at least 10,000 companies worldwide that produced a sustainability report of one kind or another. Just over half (53 per cent) reported on both social and environmental issues, 79 per cent reported solely on social dimensions, and 63 per cent solely on environmental issues. Davidson (2004) noted that 45 per cent of the Global Fortune 250 companies presented some form of SR. However, one can hypothesise that, due to the greater and more established controls in developed markets, and the greater degree of public participation and investment, that SR reporting would be more prevalent and established in developed markets relative to emerging ones. Nonetheless, SIRAN, Social Investment Forum and KLD (2008) found that in 2006 over 2,300 companies in emerging markets released some form of sustainability report.
As the demand for SR increases both among businesses and by the public or prospective investors, companies need to make their profiles widely accessible. The most cost-effective and far-reaching method of achieving this is through the use of the Internet. As a communication medium its primary strengths are: easy and cheap access, low communication costs, high design flexibility, ability to cater for a variety of needs and stakeholders, potential for interaction, ease of making archival material available, and most importantly, it reaches a wide number of users and is growing (Rikhardsson, Andersen & Bang, 2002).
1.2 South African companies
The Johannesburg Securities Exchange (JSE) was the first stock exchange in an emerging market to develop a sustainability index (Sonnenberg & Hamann, 2006). Following on the trail of similar indices on the FTSE and Dow Jones, the JSE Socially Responsible Index (SRI) was launched in May 2004 after 18 months of development (Sonnenberg & Hamann, 2006). The JSE adapted international experience, especially the FTSE4Good index, to the South African context. The JSE SRI has three objectives, namely (i) to highlight listed companies with acceptable sustainability practices, (ii) to provide the foundation for financial SRI products, and (iii) to provide an objective and accepted method of measuring the sustainability performance of listed companies (SIRAN, Social Investment Forum and KLD, 2008; Sonnenberg & Hamann, 2006). The SRI index uses a set of 70 indicators and focuses on the triple bottom-line (Sonnenberg & Hamann, 2006). Currently, most South African companies do not provide quantitative and comparable data on SR, and frequently fail to commit themselves to objective targets. Sonnenberg and Hamann (2006) reported that the JSE companies that lead in SR are usually those with high environmental impacts, such as mining companies, as well as those with high international exposure, mirroring results from top companies on the London Stock Exchange (Aras & Crowther, 2009). Since its launch in 2004, the SRI index has significantly exposed South African companies to CS (SIRAN, Social Investment Forum and KLD, 2008).
1.3 Measuring corporate sustainability
Measuring CS requires the use of indicators (Atkinson, Hett & Newcombe, 2000). An ideal indicator should be easy to measure and understand, should have a target or benchmark for comparison, and should be able to be statistically validated (Barnett, 1998). The use of composite indices reduces the uncertainty around measuring sustainability (Mayer, Thurston & Pawlowski, 2004). Given the need to cover the social, environmental and financial dimensions of sustainable development and company performance, an interdisciplinary approach is needed for concrete guidance on SR (Lamberton, 2005; Toman, 1994). Consequently, integrated sustainability accounting is seen as the preferred measure of a company's performance towards sustainability (Hacking & Guthrie, 2008; Lamberton, 2005).
Businesses frequently report on indicators that they deem to best profile their achievements (Azapagic, 2003; Lamberton, 2005; Mayer, Thurston & Pawlowski, 2004) and only as far as necessary to meet regulatory requirements (Berns et al., 2009). Therefore, it has been proposed that indicators that tend to be neglected in the business sector should be accorded higher weighting (Hacking & Guthrie, 2008), and that third party verification is desirable (Eweje, 2011; KPMG, 2012b). The most widely used approach currently is triple bottom-line reporting (Moneva, Archel & Correa, 2006).
Within the context of the above, this paper reports on the extent of SR by listed companies within developing or emerging markets as benchmarked against those in developed markets. We hypothesised that SR would be most prevalent and advanced in developed markets and among the top listed companies. We considered three key questions, namely (i) What proportion of companies perform SR? (ii) How do emerging and developed markets compare with respect to compliance to SR and the format of SR? and (iii) How do the top 20 and bottom 20 companies differ with respect to both compliance and SR format?
2 Study domains
The domains covered were the emerging and developed stock exchanges of the world. In Africa, there are three major stock exchanges, in Asia 25, in Europe 34, the Middle East five, North America 20 and in South America there are 15 major ones (Stock Exchanges Worldwide Links, 2008). From the list of major stock exchanges, we randomly selected three from the emerging sector (along with the one in South Africa, which was of particular interest to us) and four from the developed market sector. The four emerging market exchanges were the Johannesburg Securities Exchange (JSE), the Zimbabwean Stock Exchange (ZSE), as well as the Istanbul and Bombay (BSX) stock exchanges. Within the developed market sector, we examined the Nordic (OSX), Paris (PSX), Australian (ASX) and Swiss stock exchanges. In each of these, the top 20 and bottom 20 listed companies were examined.
3 Methods
For each company, we examined their website to determine firstly whether or not they had any form of SR. For those companies that did have SR on their website, we recorded a number of attributes. First was the number of hyperlink clicks required to obtain the SR information that we used as a measure of the ease and accessibility of the information. Secondly, we noted whether the SR was in PDF or HTML format. Thirdly, we used a qualitative measure of the extent of the SR through a scoring system, where a score of four was assigned for SR that was substantial in length and made use of tables, figures and paragraphs of text; a score three was assigned where the SR was largely just a tabular presentation; a score of two for a small amount of text (several sentences), and a score of one for three or fewer sentences.
Data were summarised in graphical form. Count data were transformed into percentages and frequencies. Where necessary, these were arcsine transformed to achieve normality. Differences between emerging and developed markets, and between the top 20 and bottom 20 companies within each market type, were examined by means of T-tests for count data and Chi-squared tests for percentage data.
4 Results
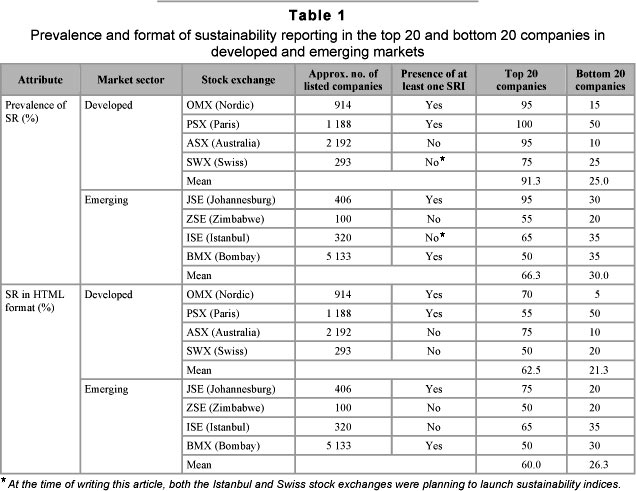
Overall, the incidence of SR reporting was similar (χ2 = 2.0, p >0.05) between the developed (58.1 per cent) and the emerging (48.1 per cent) markets. However, the top 20 companies (78.8 per cent) typically displayed a greater incidence (χ2 = 52.3, p <0.0001) of SR reporting than the bottom 20 (27.5 per cent), irrespective of market sector. In considering only the top 20 companies in each market sector, the developed markets had 91.3 per cent compliance, whereas the emerging markets' top 20 had 66.3 per cent compliance, which was significantly lower (χ2 = 18.5, p <0.001). The PSX had 100 per cent (Table 1). The highest in the emerging sector was the JSE (95 per cent). In comparison, the bottom 20 companies were characterised by a markedly lower prevalence of SR. In the developed sector, the mean was 25.0 per cent of companies with SR, which was not significantly (χ2 = 0.6, p >0.05) different to the 30.0 per cent recorded for the emerging sector. Within both emerging and developed markets, the difference in prevalence between the top 20 companies and the bottom 20 was significant at the 0.01 per cent level. The presence of an SR index in the respective stock markets had little influence on the prevalence of SR among the top- or bottom 20 companies.
Just over forty percent of companies providing SR information did so in HTML format rather than PDF (41.9 per cent for developed markets; 43.2 per cent for emerging markets), with no significant difference between emerging and developed markets. However, the top 20 companies had a significantly higher proportion (61.7 per cent) using HTML than did the bottom 20 companies (23.8 per cent) (χ2 = 31.2, p <0.001) (Table 1). In the developed markets, 62.5 per cent of the top 20 companies used HTML, compared to 21.3 per cent of the bottom 20 companies (χ2 = 36.1, p<0.001). A similar trend was observed within the emerging market sector, with 60.0 per cent and 26.3 per cent of the top and bottom 20 companies, respectively, using HTML format (χ2 = 23.5, p<0.001).
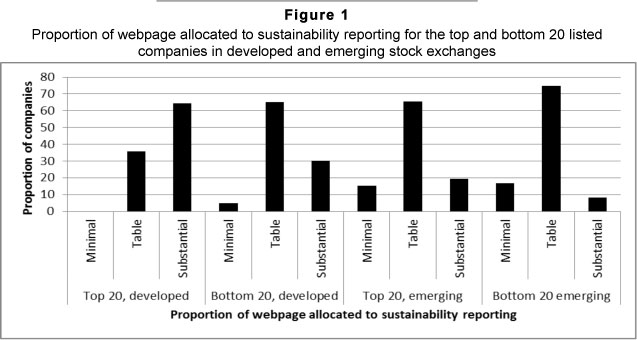
Figure 1 indicates a frequency profile of the proportion of the webpage allocated to SR across and within the different markets. Overall, the developed markets tended to allocate a greater proportion of their webpages to SR when compared to the emerging markets. This difference was significant for the top 20 companies (χ2 = 21.5; p<0.05), but not the bottom 20 companies.
Information on SR was more accessible in the developed market sector as it required marginally, but significantly, fewer hyperclicks to locate (t=2.1; p<0.05), with 1.7 + 0.08 and 1.9 + 0.09, respectively. There was no difference (t=0.98, p>0.05) in the number of hyperclicks required between the top 20 and bottom 20 companies across all markets combined.
5 Discussion
5.1 Background to SR
In most countries, sustainability reporting is voluntary and is generally performed by companies who attempt to legitimise their actions or alter the views and opinions of their stakeholders (Krajnc & Glavic, 2005; Sonnenberg & Hamann, 2006). Two further theories exist as to why companies involve themselves in sustainability reporting, namely the decision-usefulness theory, whereby environ- mental and social reports provide information to specific stakeholders that is not available in other company documents, and the corporate marketing theory, in which sustainability reporting is used to create a corporate image, which is a useful business asset, and to enhance, promote and preserve corporate reputations (Rikhardsson, Andersen & Bang, 2002).
Globally, there are no definitive estimates on the number of countries performing sustain-ability reporting (Rikhardsson, Andersen & Bang, 2002). It was estimated in 1997 that, from 1992 to 1996, there were approximately 1,000 companies performing SR either voluntarily or under regulatory influence (Rikhardsson, Andersen & Bang, 2002). Estimates in the mid-2000s placed just over 10,000 companies producing some form of reporting that disclosed their environmental and social accountabilities (Rikhardsson, Andersen & Bang, 2002). GRI (2007) states that close to 500 companies worldwide are providing sustainability reporting based on the GRI sustainability guidelines.
These numbers are expected to increase as pressures from legislation, stakeholders and changing markets influence CSR (Panwar & Blinch, 2012; Wilson, 2003).
Rikhardsson, Andersen and Bang (2002) surveyed the GF500 companies and found that 63 per cent reported on some form of environmental information and 79 per cent reported on some form of social information. A study in 2000 on the GF100 companies showed that 65 companies presented SR on the Internet (Rikhardsson, Andersen & Bang, 2002). In a study done by SustainAbility in 2000 on 150 companies and their Internet-based SR, Rikhardsson, Andersen and Bang (2002) found that of the 83 companies that produce environmental Internet-based SR, 36 made these available in HTML format, 26 in PDF format and 21 in both. Of those providing social reports, four companies provided them in HTML format, seven in PDF format and two in both (Rikhardsson, Andersen & Bang, 2002). The results of our paper, in combination with those of Rikhardsson, Andersen and Bang (2002), illustrate that companies predominantly provide SR information in HTML format, whether in the top 20 or bottom 20 companies and regardless of which sector the market is in. Despite this, it is seen that companies from the developed market sector had higher percentages of PDF format, especially among the top 20 companies of each stock market.
Rikhardsson, Andersen and Bang (2002) found that of the GF500 companies surveyed, the average number of hyperlink clicks required to obtain environmental reporting was 2.4 and that for social reporting was 2.8. In this study, it was found that in the top 20 companies in both market sectors, one click and two clicks had the highest frequency of occurrence. This indicates that fewer than two hyperlink clicks were needed to obtain any form of SR data. The results illustrate that the one hyperlink click category was highest in the developed market sector, which is due to the increased awareness of CSR and the more stringent regulations experienced in these countries. Among the bottom 20 companies in both market sectors, among those providing SR data, one and two hyperlink clicks were highest for the developed sector, while two hyperlink clicks were significantly highest in the emerging sector. This indicates that, when surveying the emerging market sector, it requires slightly more hyperlink clicks to access SR data on the Internet. These results show that it is relatively easy to access SR data on the websites surveyed.
SIRAN, Social Investment Forum and KLD (2008) surveyed companies from the emerging market sector and found that of the sample studied, 87 per cent compiled some form of SR, and just over half the sample size published separate SR reports. Of the countries involved in the survey, it was found that South Africa leads in sustainability disclosure, while China has the lowest sustainability disclosure practices (SIRAN, Social Investment Forum and KLD, 2008). This study found that, of those markets in the emerging sector, the JSE was predominantly the highest in providing SR reporting and, among the top 20 companies of this stock market, it performed at a level comparable to those stock markets in the developed market sector. This is predominantly a result of the SRI index that was launched in the JSE in 2004 and was based on principles adapted from the FTSE4Good Index (Sonnenberg & Hamann, 2006). The Bombay exchange recently introduced such an index and the Istanbul exchange is reportedly planning to introduce one in the near future (Panwar & Blinch, 2012).
5.2 Future of SR
Currently, SR has been dominated by anecdotal, infrequent reporting with a leaning towards a positive philanthropic content and a brief but general reporting trend on matters that are mandatory or regulatory (Aras & Crowther, 2009; Jenkins & Yakovleva, 2006; Sonnenberg & Hamann, 2006). SR reporting has been brief and has divulged very little information about a company's actual performance or operations (Sonnenberg & Hamann 2006). SR is currently performed in a manner that is not compatible for comparison, which makes it difficult to assess its effectiveness (Aras & Crowther, 2009; Sonnenberg & Hamann, 2006). However, with direction and support, SR can become more meaningful for all role-players. For example, the companies leading in SR on the JSE have embraced the shift toward the systematic reporting of quantifiable, comparable data that can be used to determine the progress of a company and its level of SR (Sonnenberg & Hamann, 2006). As time progresses and paradigms shift toward sustainable development, companies will begin to realise that an annual, solely Internet-based report is insufficient to disseminate information and communicate sustainability information with all stakeholders (Eweje, 2011; French, 2000; Sonnenberg & Hamann, 2006). The current progression of views on SR means that there is an increase in companies that are motivated to report on voluntary or obligatory sustainability information (KPMG, 2012b; Rikhardsson, Andersen & Bang, 2002). As sustainable development pushes to the fore in the current and future business strategies, investors and company executives are becoming more aware that adopting social, environmental and governance issues into the company's mission and vision is integral to secure the long-term interest of their investments and companies (Eweje, 2012; Sharma, 2006). Not doing so is currently being viewed as a financially risky and detrimental stance (KPMG, 2012a; Sharma, 2006). Presently, investors are focused largely on disclosure, but in order to improve the quality of the social and environmental situations occurring on the ground, investments must be made into cleaner technologies and sustainable growth (KPMG, 2012a; Sharma, 2006).
6 Conclusion
The results indicate that the differences in SR reporting are larger between the top and bottom companies listed within developed or emerging markets, respectively, than between the two sectors. Most noteworthy was the significant differences found between the top 20 and bottom 20 companies with respect to compliance of SR and provision of SR in HTML format in both the developed and emerging sector. Overall, this study indicates that SR is prevalent, especially among market-leading companies, and that emerging markets are not lagging too far in this respect. For sustainability to become a guiding ethos of the 21st century, rather than just a catchphrase, it is essential that businesses become more sustainable, and that this can be verified by external stakeholders via access to sustainability reports.
References
ARAS, G. & CROWTHER, D. 2009. Corporate sustainability reporting: a study in disingenuity? Journal of Business Ethics, 87:279-288. [ Links ]
ATKINSON, G., HETT, T. AND NEWCOMBE, J. 2000. Measuring corporate sustainability. Journal of Environmental Planning and Management, 43(2):235-252. [ Links ]
AZAPAGIC, A. 2003. Systems approach to corporate sustainability: a general management framework, Process Safety and Environmental Protection, 81(5):303-316. [ Links ]
BARNETT, V. 1998. Discussion at the meeting on "Alternatives to economic statistics as indicators of national well-being. Journal of the Royal Statistical Society. Series A (Statistics in Society), 161(3):303-311. [ Links ]
BERNS, M., TOWNEND, A., KHAYAT, Z., BALAGOPAL, B., REEVES, M, HOPKINS, M.S. & KRUSCHWITZ, N. 2009. The business of sustainability: what it means to managers now. MIT Sloan Management Review, Research Report, Fall, Boston, MA. [ Links ]
DAVIDSON, S. 2004. Sustainability reporting is up, but behind international rates. ECOS Magazine, 121:7. [ Links ]
EKINS, P. 1997. Clean business: policy, practice and economics implications. Philosophical Transactions: Mathematical, Physical and Engineering Sciences, 355(1728):1449-1465. [ Links ]
EWEJE, G. 2011. A shift in corporate practice? Facilitating sustainability strategy in companies. Corporate Social Responsibility and Environmental Management, 18:125-136. [ Links ]
FIELDS, S. 2002. Sustainable business makes dollars and sense. Environmental Health Perspectives, 110(3):142-145. [ Links ]
FRENCH, H. 2000. The greening of Wall Street. The Humanist, 60:9-10. [ Links ]
GRI. 2007. Global reporting initiative. Available at: http://www.globalreporting.org [accessed 2008-10-27] [ Links ].
HACKING, T. & GUTHRIE, P. 2008. A framework for clarifying the meaning of Triple Bottom-Line, integrated and sustainability assessment. Environmental Impact Assessment Review, 28:73-89. [ Links ]
JENKINS, H. & YAKOVLEVA, N. 2006. Corporate social responsibility in the mining industry: exploring trends in social and environmental disclosure. Journal of Cleaner Production, 14(3):271-284. [ Links ]
KPMG2012a. Expect the unexpected: building business value in a changing world. Available at: www.kpmg.com [accessed 2012-07-12] [ Links ].
KPMG 2012b. Corporate sustainability: a progress report. Available at: www.kpmg.com [accessed 2012-07-12] [ Links ].
KRAJNC, D. & GLAVIC, P. 2005. A model for integrated assessment of sustainable development. Resources, Conservation and Recycling, 43(2):189-208. [ Links ]
LAMBERTON, G. 2005. Sustainability accounting - a brief history and conceptual framework. Accounting Forum, 29(1):7-26. [ Links ]
MADSEN, H., SENDING, K. & ULHOI, J.P. 1997. Sustainability and corporate environmental focus: an analysis of Danish small and medium sized companies. Managerial and Decision Economics, 18(6):443-453. [ Links ]
MAYER, A.L., THURSTON, H.W. & PAWLOWSKI, C.W. 2004. The multidisciplinary influence of common sustainability indices. Frontiers in Ecology and Environment, 2(8):419-426. [ Links ]
MONEVA, J.M., ARCHEL, P. & CORREA, C. 2006. GRI and the camouflaging of corporate unsustainability. Accounting Forum, 30(2):121-137. [ Links ]
PANWAR, J.S. & BLINCH, J. 2012. Sustainable stock exchanges: a report in progress. Available at: www.SSEinitiative.org [accessed 2012-07-27] [ Links ].
RIKHARDSSON, P., ANDERSEN, A.J.R. & BANG, H. 2002. Sustainability reporting on the internet: a study of the Global Fortune 500. Greener Management International, 40:57-75. [ Links ]
SHARMA, D.C. 2006. A risky environment for investment. Environmental Health Perspectives, 114(8): 478-481. [ Links ]
SIDDY, D. 2009. Exchanges and sustainable investment. World Federation of Exchanges. Available at: www.world-exchange.org [accessed 2012-07-27] [ Links ].
SIRAN, Social Investment Forum and KLD. 2008. Sustainability reporting in emerging markets: An analysis of the sustainability reporting in selected sectors of seven emerging markets. Available at: http://www.siran.org [accessed 2008-02-24] [ Links ].
SONNENBERG, D. & HAMANN, R. 2006. The JSE socially responsible index and the state of sustainability reporting in South Africa. Development Southern Africa, 23(2):305-320. [ Links ]
STOCK EXCHANGES OF THE WORLD: WORLDWIDE LINKS. 2008. Stock exchanges of the world. Available at: http://www.tdd.lt [accessed 2008-06-04] [ Links ].
TOMAN, M. A. 1994. Economics and "sustainability": balancing trade-offs and imperatives. Land Economics, 70(4):399-413. [ Links ]
WILSON, M. 2003. Corporate sustainability: what is it and where does it come from? Ivey Business Journal, 67(6):1-5. [ Links ]
Accepted: October 2012

