


Servicios Personalizados
Articulo
 Inglés (pdf)
 Articulo en XML
 Referencias del artículo
Indicadores

Links relacionados
-
 Citado por Google
 -
 Similares en Google
Compartir

 Permalink
South African Journal of Economic and Management Sciences
versión On-line ISSN 2222-3436
versión impresa ISSN 1015-8812
S. Afr. j. econ. manag. sci. vol.16 no.1 Pretoria ene. 2013
ARTICLES
Month of the year and pre-holiday effects in African Stock Markets
Paul Alagidede
Department of Economics, Rhodes University
ABSTRACT
This paper investigates the existence of two anomalies in African stock returns: the month of the year and the pre-holiday effects, and their implications for stock market efficiency. We extend the traditional approach to modelling anomalies and examine the mean and variance of returns. We document high and significant returns in days preceding a holiday in South Africa. Our results indicate that the month of the year effect is prevalent in African stock returns. However, we argue that, owing to illiquidity and round trip transactions costs, the anomalies uncovered do not necessarily violate the no-arbitrage condition.
Key words: calendar effects, African stock markets, month of the year and pre-holiday effects
1 Introduction
The Efficient Market Hypothesis (EMH) postulates that asset prices fully reflect all available information (Fama, 1970). This implies that past prices should have no predictive power over future prices; hence, successive price changes should be random. However, a number of studies have established not only that stock prices are predicable on the basis of previous information, but also that indicators such as dividend yields and gross domestic product contain information that is useful in predicting stock prices. Moreover, earnings/ price and book-to-market ratios, among other seasonal patterns which have no basis in extant theoretical models seem to predict stock prices. This latter evidence, commonly called calendar anomalies (effects), is the subject of this paper. Broadly speaking, calendar anomalies refer to the tendency of financial asset returns to display systematic patterns at certain times of the day, week, month or year. This paper focuses on the month of the year and the pre-holiday effect on African stock markets.
The area of academic and practitioner research in financial economics that has generated the most excitement and attracted the most attention in financial economics concerns persistent cross sectional and time series patterns that have been documented world-wide.
A number of variables, such as firm size, ratio of book-to-market, and price/earnings ratios, seem to have significant predictive ability. For example, Basu (1977) and Banz (1981) both found that the ratio of price to earnings and market capitalisation of common equity respectively provided considerably more explanatory power than beta of common stocks. Also, stock returns are found to be systematically higher or lower depending on the time of the day, the day of the week, and the month of the year. The month of the year and the turn of the month effect hold that returns are estimated to be higher in the month of January, particularly in the first few trading days of the month (see Rozeff & Kinney, 1976; Keim, 1983; Gultekin & Gultekin, 1983) than in other months of the year. Over the years, evidence has shown that returns observed on days preceding a public holiday are, on average, higher than returns on other trading days (Ariel ,1990; Vergin & McGinnis, 1999). The latter writers produced seminal papers which served as springboards for much subsequent research that confirmed the ability of variables other than beta to explain cross-sectional differences in returns.
These regularities in stock returns, otherwise known as calendar anomalies (effects), have occupied empirical research on asset pricing models for nearly half a century, and present a paradox in empirical finance. Their existence casts doubt on the validity of asset pricing models and hence challenges the belief in stock market efficiency. For instance, investors could buy stocks on days (months) with abnormally low returns and sell on days (months) with abnormally high returns. Further, if the pre-holiday effect holds, it is possible to devise strategies that would yield returns over and above buy and hold. These would be inconsistent with the efficient markets hypothesis (EMH). However, since their discovery, seasonal patterns in stock returns have failed to yield consistent returns over and above buy and hold strategies. It could be argued that any 'trading rules' derived from the expectations of anomalies would be more than offset by the 'round trip' transaction costs and illiquidity (French, 1980; Draper & Pauydyal, 1997; Brooks & Persand, 2001; Mills & Coutts, 1995). Thus, small calendar-specific anomalies need not violate no-arbitrage conditions. Further, it has been argued that even if there are no calendar-specific effects, an extensive search (mining) over a large number of possible seasonalities is likely to yield something that appears to be an 'anomaly' by pure chance (see Lo & MacKinlay, 1990; Sullivan, Timmerman & White, 2001 Burton, 2003). For evidence on African markets, see Coutts and Sheikh (2002), who investigated the All Gold Index of South Africa and found no evidence of seasonality. Claessens, Dasgupta and Glen (1995) find significant returns in March and June for Nigeria, but no seasonality in Zimbabwe, while Alagidede (2008) investigates the day of the week effects in six African stock markets.
African markets have a variety of institutional features that differentiate them from one another and from the markets in industrial and other emerging economies. The search for seasonality or other anomalies in the returns of African markets could provide important information on the role of institutional features in return behaviour. This information may help stock traders and regulatory authorities in improving the microstructure of security trading and stock market performance.
The results indicate that the month of the year effect is more pronounced in mean than in conditional variance for Nigeria and Zimbabwe. In Egypt, only January returns are significant. With the exception of South Africa, where pre-holiday effects are estimated to be 0.3 per cent, there are no pre-holiday effects in the markets.
The rest of the paper is organised as follows: section 2 briefly outlines the literature on anomalies. We specify the general OLS approach of investigating anomalies and adjust for conditional heteroscedasticity in section 3. Evidence of month of the year and pre-holiday effects are presented in section 4. We conclude and offer promising ideas for future research in section 5.
2 Calendar effects: World-wide evidence
Much of the research on the cross-sectional predictability of stock returns has focused on the relationship between returns and the market value of common equity, commonly referred to as the size effect. Banz (1981) published one of the earliest articles on the 'small-firm effect'.
Banz (1981) estimated a model of the form, R. = a0 + a1bi + a2Si + ei where Si is a measure of the relative market capitalisation (size) for firm i for the New York Stock Exchange between 1926 and 1975. Banz documented that excess returns accrued to holders of small stocks over the period 1936-1975. In the UK, Dimson and Marsh (1984) report evidence of a size effect on the portfolios constructed from a sample of stocks from the London Share Price Data (LSDP). Over the period 1977 to 1983, the portfolio of smallest stocks earned a compound annual return of 41 per cent, while the portfolio of largest stocks realised a compound annual return of 18 per cent. However, in a follow-up article, Dimson and Marsh (1999) indicate that there was a reversal in the size effect in the London Stock Exchange. More recently, Mills and Jordanov (2003) have shown that there is significant autocorrelation in small stocks using the FTSE-Actuaries All Share Index 19821995.
The implication of these findings is that market structure may be an important influence on the measured size effect. If so, then analysis of the international evidence, where we observe very different market organisations and structures, should reveal significant differences in the magnitude of the size premium across markets. Hawawini and Keim's (1999) review of the size effect from equity markets in Australia, New Zealand, Canada, Mexico, Japan, Korea, Singapore, Taiwan and eight European countries, for varying periods of time, showed that the size premium was positive for all the countries in their sample except Korea. In terms of monthly size premium, Mexico recorded 4.18 per cent between 1982-87; Australia and Japan recorded 1.2 per cent and 1.2 per cent between 1958-81 and 1965-87 respectively, although there are differences across countries.
There has been extensive research into the possible explanations of anomalous returns behaviour between small and large firms. One research avenue is the way returns are measured using asset pricing models. The argument is that the betas for small firms are too low, so estimates of expected return using the CAPM would be positive, even if it was zero when the expected return was correctly estimated.
A substantial number of studies has found that part of the size effect occurs in the month of January. The January effect refers to the anomaly whereby firms experience abnormal returns in the first few days of trading in January. The persistence of these returns stands in opposition to the efficient market hypothesis and has been a target for investigation. Rozeff and Kinney (1976) examined the January effect using New York Stock Exchange stocks for the period 1904-1974, and concluded that average return for the month of January was 3.48 per cent compared to only 0.42 per cent for other months. Keim (1983) employed the same data set for the period 1963-79 and established that nearly 50 per cent of the average magnitude of risk-adjusted premium of small firms relative to large firms was owing to the January abnormal returns. Further, more than 50 per cent of the January premium was attributable to large abnormal returns during the first week of trading in the year. Fama (1991) reports the results of the S&P 500 for the period 1941-1981, during which small stocks averaged a return of 8.06 per cent in January, with large stocks managing a return of only 1.342 per cent. For Japan, see Kato and Shallheim (1985); for the UK see Mills and Coutts (1995); for international evidence see Gultekin and Gultekin (1983) and Al-Khazali, Koumanakos and Pyun (2008); for the bond market see Keim and Stambaugh (1984).
However, there is little agreement on the causes of the monthly seasonality. Competing reasons, including, but not limited to the tax loss selling hypothesis, microstructure issues, spurious causes such as outliers, concentration of listings and de-listing at year-end, and insider trading, have been adduced. These can be broadly classified under two headings: one that is consistent with stock market efficiency and equilibrium asset pricing models, and one that is at variance with the hypothesis (Seyhun, 1993).
The tax-loss selling hypothesis posits that investors sell their losing stocks before year end in order to obtain the tax savings from deducting those losses from capital gains realised during the year (Rozeff, 1986). The selling pressure in late December is then followed by buying pressure in January as investors return to desired portfolio compositions. Fortune (1991) finds this to be inconsistent with the efficient market hypothesis because, in efficient markets, investors with no capital gains taxes should identify any tendency towards abnormally low prices in December and should become buyers of stocks oversold in late December. In effect, the tax-loss selling should affect the ownership of shares but not their price.
Chan, Chen and Hsieh (1985) posit omitted risk factors as a reason for the monthly anomaly. This explanation holds that it is riskier to hold stocks in January than in any other month of the year because of certain risk factors omitted in that month. For this reason, investors get, on average, a higher return in January to compensate for these omitted risks.
There has also been an explanation linking the January effect with the small firm effect. Keim (1989) attributed this to microstructure biases. According to this explanation, the last trade in December for most stocks is at the bid price, which causes returns to appear high in the first few days of January. Keim (1989) found that the tendency for stocks to be at the bid price for the last trade in December was very pronounced for small stocks. In addition, small stocks have higher bid-ask-spread and a lower price. The return would therefore be bigger for small stocks, which partly explains the differences between large and small stocks in the January effect.
3 Calendar effects: A methodological note
Previous studies of stock market anomalies may, in general, be divided into four groups based on the methodology employed. The first group of studies calculate returns, means and variances for each day (month) of the week (year) and estimate a simple OLS regression with dummies, using standard t and F tests or ANOVA to check the significance and equality of mean returns, without paying attention to the time series properties of the sample data (see French, 1980; Gibbons & Hess, 1981, for evidence). Whereas this may give an indication of the presence or otherwise of some specific anomalies, the data generation process and misspecification effects could cast doubt on the reliability of the results reported in such studies. The second group of studies also report mean daily (monthly) returns based on OLS regressions. However, hypothesis tests are carried out using t-statistics and χ2 calculated using heteroscedasticity-consistent standard errors. This group does not, however, examine the distributional properties of the data used. In the third group, normality of returns is tested for by means of the Kolmogorov-Smirnov D statistic. If the returns are found to be normally distributed, then t and F-tests or ANOVA are employed. Otherwise nonparametric tests are used to tests the existence of anomalies. The last group of studies starts by reporting descriptive statistics of the distributional properties of the return series. If these statistics indicate that the series are highly leptokurtic relative to normal distribution, the outcome provides a justification for the use of a GARCH model to investigate the presence of anomalies.
This paper extends the work of the fourth group by explicitly testing for iid in the empirical residuals.
3.1 January and the month of the year effect
Monthly continuously compounded log returns are calculated as

The standard methodology employed in investigating seasonality in monthly returns entails estimating an OLS regression with dummies to capture month of the year effects as

Rt is the continuously compounded index return on month t as shown in (1) and pt denotes the asset price at time t. The Mit are dummy variables so that M1t=1 if month t is January and zero otherwise; M2t=1 if the month t is February and zero otherwise and so forth. The OLS coefficients α1 to α12 are the mean returns for January through December respectively and εt is the stochastic term. The presence of monthly seasonality implies
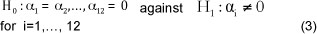
If the null hypothesis is rejected, then stock returns must exhibit some form of monthly seasonality.
Previous evidence examined the month of the year effect in various markets in the context of equation (2), using the standard t and F-test without paying attention to the time series properties of the data. For instance the error in the model may be autocorrelated, resulting in misleading inferences. Also the error variances may not be constant over time, resulting in inefficient estimates if there is time-varying variance. The first drawback is resolved by including autoregressive terms in (2). However, since we are dealing with monthly data, the issue of non-synchronous trading is not so prominent in our data. The second drawback that is of interest to us is resolved by making the variance time varying.
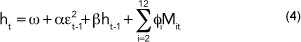
where Mit represents monthly dummies, ht is the conditional variance and α and β represent the lagged squared error term and conditional variance respectively. Equation (2) represents our mean equation for the month of the year and equation (4) accounts for conditional heteroscedasticity in the month of the year effect. Thus we jointly estimate (2) and (4).
3.2 Pre-holiday effect
The pre-holiday effect postulates that returns observed on days preceding a public holiday day are, on average, many times greater than returns on other trading days (see Ariel, 1990). The pre-holiday effect is tested via the following regression:

where ξ and ξ2 are the mean returns for days prior to holidays and all other days respectively. Hlt is a dummy that takes the value of unity at all times other than days immediately preceding a public holiday, when it takes a value of zero. On the other hand, H2t takes the value of one before a public holiday and zero at all other times. The null hypothesis that means pre-holiday returns are equal to the mean for other days is

4 Evidence of month of the year and January seasonality
4.1 Data employed
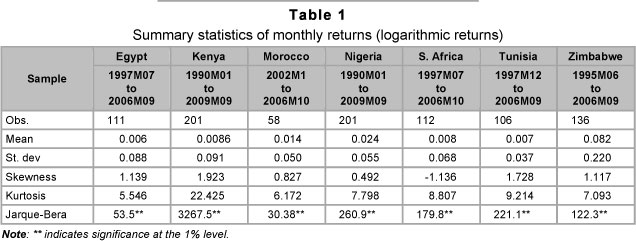
The data consists of monthly stock prices for the following countries: NSE All Share Index for Nigeria, NSE20 index for Kenya, Tunnindex for Tunisia, MASI index for Morocco and FTSE/JSE All Share index, CASE30 Share Index and ZSE Industrial index for South Africa, Egypt and Zimbabwe respectively. These are the biggest markets in Africa and together they account for over 90 per cent of stock market capitalisation and domestic company listing on the continent. The data was obtained from DataStream for various sample sizes, as shown in Table 1. The most consistent data we have for the original All Share Indices for the sample of countries under consideration ends in 2006. Since then, the index compositions and calculations have changed and, to maintain consistency, we limit the sample to 2006. Table 1 indicates that, over the sample period, monthly stock returns have averaged 0.006 to 0.082 for Egypt and Zimbabwe respectively.
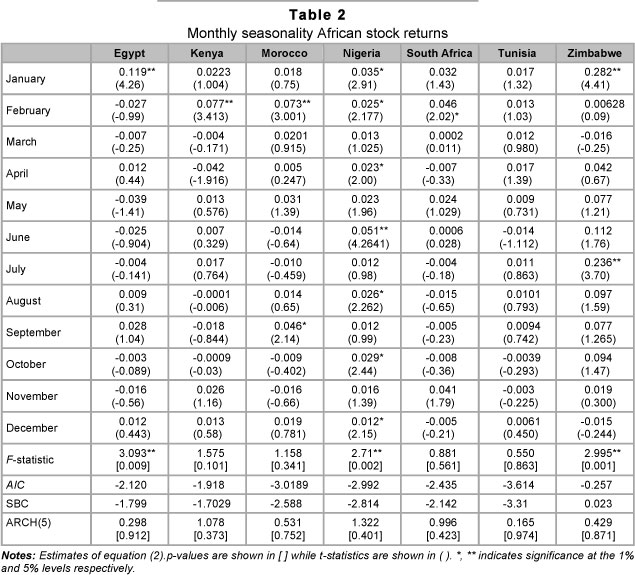
The distributional properties of monthly stock returns are far from being normal: for instance, we observe negative skewness in South Africa while, in general, all countries show excess kurtosis. These basic features of the monthly returns provide the rationale for adjusting for conditional heteroscedasticity. Evidence of (2) is shown in Table 2.
The January seasonality is evident in Egypt, Nigeria and Zimbabwe. It can be seen from Table 2 that, apart from January, there are no significant monthly returns for Egypt. The above findings have to do with the micro-structure of African markets.
We are inclined to rule out the tax loss selling hypothesis for the reasons indicated beneath Table 3. What is plausible, however, is the issue of omitted risk factors in the month of January. A glance through the institutional reforms instigated in the three markets that reported significant January return indicates a strong link between the market microstructure and returns in January. Most reforms, such as demutualization, and the introduction of new tax rules, are likely to occur at the end of the year in December and this may be responsible for depressed stock performance in other months and subsequent recovery in January as investors adjust to the new rules. Investors thus get on average a higher return in January to compensate for the uncertainties surrounding new rules and reforms, which may impact on the risk-return relationship.
A second explanation may be liquidity, which remains the most critical risk factor in price discovery, as it is required to drive the market. Although African markets suffer low liquidity in general, we surmise that the tendency for liquidity to be lower is pronounced at the close of year and is back up only when investors return to the desired portfolio levels at the beginning of the year. This helps explain in part the high January return. This explanation is consistent with the notion of market efficiency.
Although monthly returns in July are significant for Zimbabwe, overall they are no greater than the January return. Thus for these two markets (Egypt and Zimbabwe), we can confirm the hypothesis that mean monthly returns in January exceed those in other months of the year. Our results contrast with those of Claessens et al. (1995), who find no evidence of a month of the year effect for Zimbabwe. Table 2 also indicates seasonality in other months of the year. There is a February effect for Morocco, Kenya, Nigeria and South Africa. The hypothesis that returns for all months are equal can be rejected for Egypt, Nigeria and Zimbabwe. For four markets (Morocco, Kenya, Tunisia and South Africa) there is insignificant variation between monthly returns, and none of them exhibit any January seasonality.
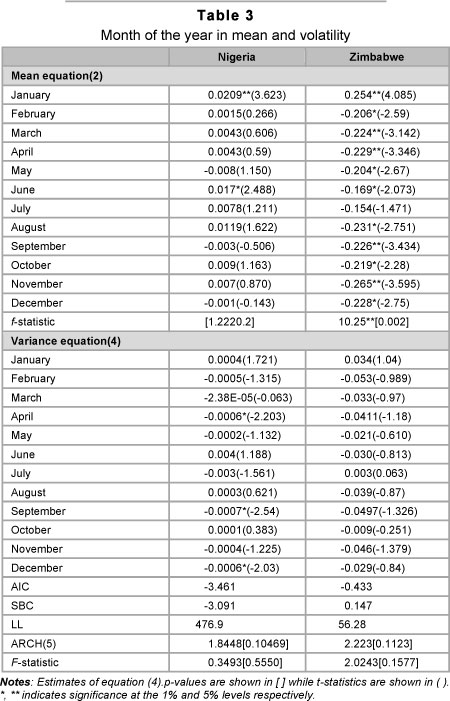
Overall, the estimates show that monthly seasonality is pronounced for Nigeria; seven months record statistically significant returns, with the highest falling in the month of June. Except for Nigeria and Zimbabwe, we do not find evidence of conditional heteroscedasticity in the other countries. We therefore implemented a GARCH model to further investigate the month of the year effect in these two countries (Table 3).
After accounting for conditional heteroscedasticity we find that the January seasonality is significant in both mean and variance.
Throughout the sample, Nigeria records 0.02 returns in January, while Zimbabwe records 0.25. We also find significant positive June returns for Nigeria, while for Zimbabwe there are more significant but negative returns in almost all months. The monthly seasonality is not very prominent in volatility. Only December, September and April have significant negative returns in Nigeria.
From these results, it appears that the turn-of-the-tax-year effects found for many industrial economies do not extend to African markets. One could attribute this to the peculiar characteristics of the trading systems and market microstructure of the countries. However, it could also be possible that the tax codes of these economies do not give rise to selling stocks at the end of the tax year to generate a loss for tax purposes, the hypothesis often cited as an explanation for the turn-of-the-tax-year effect in developed economies. In addition to tax codes that are designed differently in emerging economies (compared with those for industrial economies), lax legislation and poorly-developed legal infrastructure, especially regarding the security markets in Africa, could well explain the lack of evidence for the tax-loss-selling hypothesis.
Overall, the estimates show that monthly seasonality is pronounced for Nigeria; seven months of the year record statistically significant returns, with the highest in the month of June. This evidence confirms results for Claessens et al. (1995), who find June and March returns to be significant for Nigeria.
Although we find significant January effects for Egypt, Nigeria and Zimbabwe, the evidence is not convincing as to whether the tax loss selling hypothesis could be working for those countries. For instance, we do not find evidence of any other monthly effect for Egypt, whereas for Zimbabwe and Nigeria, the January average return is not necessarily greater than in other months. Further evidence is thus required to confirm these results. The results also raise further questions warranting further investigation. Is the January effect related to the size effect? This requires richer data on individual stocks than those available to us here, which opens the door for future research. Finally, is it profitable to apply trading rules to exploit these anomalies? Here, data on transactions costs/or mutual fund spread would be required to judge the profitability of applying a trading rule on the patterns identified. Our own conclusion is that, given the current state of illiquidity in African markets, such rules may prove unprofitable.
4.2 The pre-holiday effect
The definition of holidays varies among researchers (Brockman & Michayluk, 1998). One definition looks at days, other than Saturday or Sunday, on which the market is closed (Lakonishok & Smidt, 1988). However, this excludes exceptional events, such as the end of apartheid in South Africa, the recent widespread political crises in Kenya that caused the market to close to traders, and natural disasters like hurricanes, which can cause abrupt closure of markets. Furthermore, some holidays (e.g. Easter and most religious holidays that follow the lunar calendar) change over time. To this end, we define the holiday effect as the return from the pre-holiday close to the post-holiday close. In other words, the holiday returns are the daily returns for the trading weekday that follows a non-trading weekday. We summarise these for all the countries in Table 4.
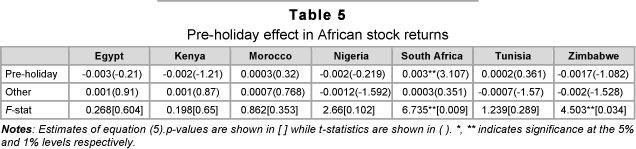
Table 5, for the entire estimation period, shows that the average pre-holiday returns (apart from South Africa) and those for all other days are insignificant.
The results reported in Table 5 represent significant departures from the empirical literature on other markets. For the six markets with no pre-holiday effect, we can surmise that negative information does not arise in the days immediately before a holiday. This, however, is an unlikely explanation, since the general consensus is that information (negative or positive) arises randomly. The results could also be specific to African markets microstructure, and further evidence is required to explain this.
For South Africa, the market is more developed and tends to have features similar to those of developed economies. Several factors, including economic and behavioural, could contribute to the observed positive pre-holiday returns in South Africa. One possible explanation is that the significant pre-holiday returns are a manifestation of the well-documented closing effect in which high returns for securities are observed at market closings. On the behavioural side, explanations range from short-sellers closing their risky positions prior to holidays, to psychological reasons such as investors' good mood around holidays indicating greater optimism about future prospects.
5 Concluding remarks
Calendar anomalies are now accepted stylized facts in stock markets world-wide. With a variety of trading arrangements and institutional features, the search for seasonal patterns in stock returns of African markets could provide important information on the role of institutional features in return behaviour, and exemplify the role of policy in microstructure design and reform. This paper investigated two anomalies in security returns: the month of the year and the pre-holiday effect, and accounted for conditional volatility in the month of the year effect. The existence and persistence of anomalies tend to negate the notion of market efficiency, since traders can earn abnormal returns just by examining patterns and setting trading strategies accordingly, resulting in returns that are not commensurate with risk.
We showed that the pre-holiday effect is present in South Africa. However, this finding is not applicable to the other stock markets in our sample. For South Africa this might be attributed to the closing effect in which high returns for securities are observed at market closings, and investors' good mood around holidays, indicating greater optimism about future prospects.
We also found that January returns are positive and significant for Egypt, Nigeria and Zimbabwe. February returns are higher for Kenya, Morocco and South Africa. Tunisia has no monthly seasonality. While ruling out the tax loss selling hypothesis as the reason for the significant January effect, we posit that liquidity constraints and omitted risk factors may help explain the January effect for Egypt, Nigeria and Zimbabwe.
The discovery of statistically significant anomalies could imply the ability of trading rules to yield superior outcomes if they are also economically significant. However, our evidence indicates that the anomalies uncovered are too marginal economically to justify the deployment of trading rules, and hence do not present any challenge to the no-arbitrage condition. Moreover, investors must incur transactions costs to exploit them, and, given the illiquidity of African markets, the use of trading rules might not yield profits over and above a simple buy and hold strategy.
At the same time, however, the evidence presented in this paper opens the door for further research on stock return predictability in general, and calendar anomalies in particular. First, is the January effect manifested by the size effect? Second, do the seasonal patterns uncovered in our study yield returns over and above buy and hold? These are interesting questions to which future research may do well to provide answers.
Acknowledgement
Sincere thanks to the editor and two anonymous referees for very helpful comments. The usual caveat applies.
References
ALAGIDEDE, P. 2008. Day of the week seasonality in African stock markets. Applied Financial Economics Letters, 4(2): 115-120. [ Links ]
AL-KHAZALI, O., KOUMANAKOS, K.P. & PYUN, C.S. 2008. Calendar anomaly in the Greek stock market: Stochastic dominance analysis. International Review of Financial Analysis, 17:461-474. [ Links ]
ARIEL, R. 1990. High stock returns before holidays: Existence and evidence of possible causes. Journal of Finance, 45(5):1611-1626. [ Links ]
BANZ, R. 1981.The relationship between return and market value of common stocks. Journal of Financial Economics, 9:3-18. [ Links ]
BASU, S. 1977. Investment performance of common stocks in relation to their price-earnings ratios: A test of the efficient market hypothesis. Journal of Finance, 32:663-682. [ Links ]
BROCKMAN, P. & MICHAYLUK, D. 1998. The persistent holiday effect: Additional evidence. Applied Economics Letters, 5:205-209. [ Links ]
BROOKS, C. & PERSAND, G. 2001. Seasonality in Southeast Asian stock markets: Some new evidence on the day-of-the-week effects. Applied Economics Letters, 8:155, 158. [ Links ]
BURTON, M.G. 2003. The efficient market hypothesis and its critics. Journal of Economic Perspectives, 17(1):59-82. [ Links ]
CHAN, K.C., CHEN, N. & HSIEH, D.A. 1985. An exploratory investigation of the firm size effect. Journal of Financial Economics, 14:451-471. [ Links ]
CLAESSENS, S., DASGUPTA, S. & GLEN, J. 1995. Return behaviour in emerging stock markets. World Bank Economic Review, 9(1): 131-151. [ Links ]
COUTTS, J.A. & SHEIKH, M.A. 2002. The anomalies that aren't there: The weekend, January and pre-holiday effects on the all Gold Index on the Johannesburg Stock Exchange 1987-1997. Applied Financial Economics, 12:863-871. [ Links ]
DIMSON, E. & MARSH, P. 1999. Murphy's law and market anomalies. Journal of Portfolio Management, 19(1):41-51. [ Links ]
DIMSON, E. & MARSH, P. 1984. The impact of small firm effect on event studies and the performance of published UK stock recommendation. Journal of Financial Economics, 17:113-142. [ Links ]
DRAPER, P. & PAUDYAL, K. 1997. Microstructure and seasonality in the UK equity market. Journal of Business Finance and Accounting, 24:1177-11204. [ Links ]
FAMA, E.F. 1991. Efficient capital markets: II. Journal of Finance, XLVI (5):1575-1617. [ Links ]
FAMA, E.F. 1970. Efficient capital markets. A review of theory and empirical work. Journal of Finance, 25(2):607-636. [ Links ]
FRENCH, K.R. 1980. Stock returns and the weekend effect. Journal of Financial Economics, 8:55-69. [ Links ]
FORTUNE, P. 1991. Stock market efficiency: An autopsy. New England Economic Review:17-40. [ Links ]
GIBBONS, M.R. & HESS, P.J. 1981. Day of the week effect and asset returns. Journal of Business, 54:579-596. [ Links ]
GULTEKIN, M.N. & GULTEKIN, N.B. 1983. Stock market seasonality: International evidence. Journal of Financial Economics, 12:469-481. [ Links ]
HAWAWINI, G. & KEIM, D.B. 1999. The cross section of common stock returns: A review of the evidence and some new findings", in Keim D.B and Ziemba, W.T (2000), Security Markets Imperfections in Worldwide Equity Markets, Cambridge University. [ Links ]
KATO, K. & SHALLHEIM, J. 1985. Seasonal and size anomalies in the Japanese stock market. Journal of Financial and Quantitative Analysis, 20(2):243-260. [ Links ]
KEIM, D.B. 1983. Size related anomalies and stock return seasonality: Further empirical evidence. Journal of Financial Economics, 12:13-32. [ Links ]
KEIM, D.B. & Stambaugh, R.F. 1984. A further investigation of the weekend effect in stock returns. Journal of Finance, 39(3):819-840. [ Links ]
KEIM, D.B. 1989. Trading patterns, bid-ask-spreads, and estimated security returns: The case of common stocks at calendar turning points. Journal of Financial Economics, 25:75-97. [ Links ]
LAKONISHOK, J. & SMIDT, S. 1988. Are seasonal anomalies real? A ninety-year perspective. Review of Financial Studies, 1(4):403-425. [ Links ]
LO, A.W. & MACKINLAY, A.C. 1990. Data-snooping biases in tests of financial asset pricing models. Review of Financial Studies, 3(3):431-461. [ Links ]
MILLS, T.C. & COUTTS, J.A. 1995. Calendar effects in the London Stock Exchange FTSE indices. European Journal of Finance, 1: 79-93. [ Links ]
MILLS, T.C. & JORDANOV, J.V. 2003. The size effect and the random walk hypothesis: Evidence from the London Stock Exchange using Markov chains. Applied Financial Economics, 13:807-815. [ Links ]
ROZEFF, M.S. & KINNEY, W.R.1976. Capital market seasonality: The case of stock returns. Journal of Financial Economics, 3:379-402. [ Links ]
ROZEFF, M.S. 1986. Tax loss selling: Evidence from December stock returns and share shifts. Proceedings of the Seminar on the Analysis of Security Prices. Center for Research in Security Prices:9-45. [ Links ]
SEYHUN N. 1993. Can omitted risk factors explain the January effect? A stochastic dominance approach. Journal of Financial and Quantitative Analysis, 28:195-212. [ Links ]
SULLIVAN, R., TIMMERMAN, A. & WHITE, H. 2001. Dangers of data mining: The case of calendar effects in stock returns. Journal of Econometrics, 105(1):249-286. [ Links ]
VERGIN, R.C. & MCGINNIS, J. 1999. Revisiting the holiday effect: Is it on holiday? Applied Financial Economics, 9(5):477-482. [ Links ]
Accepted: November 2012

