


Servicios Personalizados
Articulo
 Inglés (pdf)
 Articulo en XML
 Referencias del artículo
Indicadores

Links relacionados
-
 Citado por Google
 -
 Similares en Google
Compartir

 Permalink
South African Journal of Economic and Management Sciences
versión On-line ISSN 2222-3436
versión impresa ISSN 1015-8812
S. Afr. j. econ. manag. sci. vol.16 no.1 Pretoria ene. 2013
ARTICLES
Vodacom and MTN's brand positioning based on the brand Associations of Principal Estate Agents in Gauteng
Hennie MentzI; Johan W Strydom and Sharon Rudansky-KloppersII
IMarketing Research, Telkom SA
IIDepartment of Business Management, University of South Africa
ABSTRACT
This article investigates Vodacom and MTN's brand positioning based on the perceptions of a group of LSM seven to ten respondents who are principal estate agents in Gauteng. An empirical study was conducted. The profile of the sample in terms of access to telecommunication-related services confirmed that of individuals in the LSM seven to ten groups with a skew towards LSM ten. As a minimum requirement for the target market brands in the category should be strongly associated with the statements market leader, local brand, technologically sophisticated brand, trusted brand, South African brand and prestigious/upmarket brand. At an overall level, Vodacom has established a more favourable brand positioning compared to MTN. However, both Vodacom and MTN have failed to establish a personal brand relationship with the target market.
Key words: branding, brand positioning, brand associations, LSM seven to ten, points of parity brand associations, point-of-difference associations, category points of parity, cellular market, principal estate agents
1 Introduction
South Africa's three major cellphone network operators, that is, Vodacom, MTN and Cell C derived revenues to the value of approximately R90.5 billion from their South African operations during the 2009 financial year. The market is dominated by the Vodacom and MTN brands. At the end of the 2009 financial year Vodacom's market share was estimated at 54.50 per cent and that of MTN at 31.83 per cent (Mentz, 2011:2-7).
Brand development is a strategic priority within the South African cellular market. The significant investment in brand development is reflected by the fact that Vodacom and MTN rank amongst the top ten South African brands in terms of advertising spend (Affinity Advertising and Publishing, 2011:67).
Branding at the corporate or company level is a clear feature of the branding strategy used by Vodacom and MTN. The corporate name is used by both cellular network service providers in the development of a distinguished brand identity. Care is taken to ensure the development and maintenance of a positive corporate image and to transfer this to the brand (Mentz, 2011:115). In a sub-branding strategy a strong affiliation is developed between the corporate brand and sub-brands (Venter & Jansen van Rensburg, 2009:237). Sub-branding is used by Vodacom and MTN to differentiate the brand positioning of product offerings targeted at different user groups. Vodacom's prepaid sub-brand, which includes the tariff plans Yebo4Less and 4U prepaid targeted at the low end of the market, is a typical example (Mentz, 2011:116).
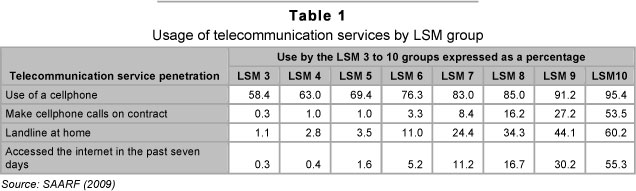
The living standard measure (LSM) scale, a segmentation tool, developed by the South African Advertising Research Foundation (SAARF), divides the South African population into ten LSM groups (Lamb, Hair, McDaniel, Boshoff, & Terblanche, 2008:47). The LSM scale is constructed from 29 individual variables that are associated with social class or living standard, and is a stronger differentiator than any single demographic aspect or variable. The LSM one group has the lowest standard of living and the LSM ten group the highest (SAARF, 2010:6). As individuals fall into higher LSM groups, the sophistication of telecommunication services used increases. Table 1 presents the incidence of telecommunication services used by individuals in the LSM three to LSM ten groups.
As indicated in Table 1 the use of a cellphone, making cellphone calls on contract, the use of a landline service at home, and the incidence of internet access within the past seven days increases as individuals fall into higher LSM groups. The incidence of use as a percentage of total potential users is referred to as the penetration rate. Cellphone penetration increases from 83.0 per cent in LSM seven to 95.4 per cent in LSM 10.
The LSM scale is used as a segmentation tool by Vodacom and MTN to differentiate its brand positioning at the low and high ends of the market. Broadly, the lower end of the market is defined as individuals falling into the LSM three to six groups and the higher end as individuals falling into the LSM seven to ten groups (James, 2006:2).
2 Formulation of the research problem
Limited or no empirical research is available that evaluate Vodacom's and MTN's use of brand associations to position its brand in the high end of the market. It is difficult to get access to users in the LSM seven to ten groups and as a result conducting empirical research amongst these users is costly. The research conducted on this topic is primarily funded by Vodacom and MTN and thus is not available for objective scientific review due to the strategic use thereof by Vodacom and MTN. The research problem addressed in this article has been formulated as follows: firstly, there is a need to identify the brand associations that should be considered for use to position the Vodacom and MTN brands in the high end of the market; secondly there is a need to assess the brand positioning of Vodacom and MTN on these brand associations.
3 The importance of this research
The LSM seven to ten groups are an important market segment for Vodacom and MTN. It is of strategic importance that South Africa's two dominant cellphone network service providers establish and maintain a unique brand positioning within this market. Principal estate agents in Gauteng have been identified as a user group that are likely to fall within the LSM seven to ten groups (Mentz, 2011:16-17). They have been selected as the population (defined target market) for this research because of the following reasons: a sample frame for the user group existed; sampling techniques that do not rely on personal judgement to select respondents could be used and the respondents could be accessed by means of telephonic interviews and online via the internet. As a result cost effective empirical research could be conducted within the defined target market.
4 Literature overview
Secondary data includes information that had been previously collected, assembled and interpreted at least once, for any purpose other than the current problem (Lamb et al., 2008:133). Extensive secondary research was conducted in the execution of this study. Firstly, the marketing environment of the major South African cellphone network service providers was analysed to identify brand associations that should be considered by Vodacom and MTN in the positioning of their brands within the defined target market.
4.1 The marketing environment of Vodacom and MTN
Licenced in 1993, Vodacom was the first entrant into the South African cellular market. Vodacom used its first mover advantage to establish its position as market share leader in South Africa. A shareholder's agreement between Vodacom and Vodafone restricted Vodacom's entry into markets located north of the equator in Africa (Business Monitor International, 2009:45). MTN, licensed in 1994, followed a pre-emptive-move strategy to aggressively enter markets in Africa and the Middle East. This enabled MTN to establish itself in 21 countries in Africa and the Middle East (MTN Group Limited, 2009:2).
Vodacom and MTN dominate the South African market in terms of network infrastructure roll-out and technology. The Vodacom and MTN networks cover more than 95 per cent of the South African population and both invest heavily to upgrade their networks by using the latest technology available (Vodacom Group Limited, 2010:20; MTN Group Limited, 2009:38).
From inception in 1993 until 2005 the developing cellular market in South Africa was heavily regulated. Only since 2005 has the Independent Communications Authority of South Africa (ICASA) introduced a number of initiatives to spur competition in order to lower costs for users. These initiatives include the introduction of mobile number portability, investigations into handset subsidisation and a reduction in mobile interconnection tariffs (Mentz, 2011:60-63).
The earnings before interest, taxes, depreciation and amortisation (EBITDA) margins of Vodacom and MTN reflect their dominant position in the South African market. In the financial year that ended in 2009 Vodacom reported an EBITDA margin of 34.2 per cent, MTN a margin of 31.4 per cent and Cell C a margin of 16.1 per cent (Mentz, 2011:65).
Analysis of the marketing environment of Vodacom and MTN identified the following as important brand associations to be considered in the positioning of these brands within the defined target market: market leadership; popular or most used brand; value for money; orientation in terms of global brand, African brand and South African brand; technological sophistication; and ability to innovate. These brand associations will be discussed in paragraph 4.3.
The role of brand associations in brand positioning is subsequently discussed.
4.2 The role of brand associations in brand positioning
Brand positioning describes the position of a brand relative to competing brands in the mind of the consumer (Venter & Jansen van Rensburg, 2009:218). Brand associations play an important role in brand positioning. Brand associations can be defined as perceptions and images that are linked to a brand in the consumer's memory. The associations attached to a brand therefore become key enduring business assets (Gerber-Nel, 2006:137). The use of brand associations in brand positioning is based on the assertion that memories evoke related memories, thus colouring the interpretation of the meaning that consumers attach to a brand. Consumers are faced with a myriad of brand and product related choices daily. To simplify consumer decision-making and to develop brand preference, marketers have to ensure that the brand is recalled by consumers when purchase decision-making pertaining to the category is made. This requires the development of brand associations in the mind of the consumer. The development of a brand positioning that supports brand preference should be the key focus of brand development (Venter & Jansen van Rensburg, 2009:218). Brand identity is a particularly important concept in the development of a strong brand. The brand identity consists of the unique set of brand associations that represent what the brand stands for and promises to customers (Keller, 2008:279).
The development of brand association statements to evaluate Vodacom and MTN's brand positioning within the defined target market is subsequently discussed.
4.3 Development of brand association statements
A review of the relevant literature identified four key brand association dimensions that should be considered in the evaluation of brand positioning, that is, market leadership measures, the brand as a product/perceived value, the brand as a personality and organisational associations attached to the brand (Mentz, 2011:214-218). These dimensions were used as a frame of reference in the analysis of Vodacom's and MTN's marketing communication as presented in annual reports, online media (websites and portals) and printed marketing material. Based on the literature review, brand association statements were developed. The development of the brand association statements related to market leadership measures is subsequently discussed.
4.3.1 Market leadersh ip measures
Aaker (Gerber-Nel, 2006:191) as well as Young and Rubicam (Miller & Muir, 2004:213) recommend the use of perceived quality and leadership/popularity measures as one dimension to measure brand equity. Combining perceived quality and market leadership into one dimension creates a construct (esteem) that means more than just quality (Mentz, 2011:187-188). Perceived quality can be defined as the consumer's assessment of the expected quality that a brand will deliver (Mentz, 2011:185). Market leadership can be defined as the consumer's perception of the brand as a leader in terms of market share and popularity. The importance of market share is also reflected by its inclusion as a dimension in Interbrand's brand valuation methodology, measured in terms of the relative size of the sales base (Mentz, 2011:187).
Since inception, Vodacom and MTN have constantly striven to obtain the number one position in terms of market share leadership in the South African cellular market (Mentz, 2011:29, 42). Market leadership has been identified as important brand associations to assess the brand positioning of Vodacom and MTN. The following brand association statements were developed to measure this dimension: market leader and popular/most used brand (refer to paragraph 4.1). The development of brand association statements to measure perceived quality will be discussed in the development of the brand association statements related to brand as a product/ perceived value brand association dimension.
4.3.2 The brand as product/perceived value
A strong brand has to provide a compelling value proposition. If a brand does not generate value it will most probably be vulnerable to competitors. Strong brand positioning often relies on performance advantages of some kind (Keller, 2008:64-65). Perceived value can be defined as the functional benefits and practical utility derived from using the brand. To measure brand equity, use value measures that provide a summary indication of the brand's success in creating the value proposition, rather than a detailed functional performance assessment (Mentz, 2011:216).
The brand association statement affordable was developed to give an indication of the consumers' perception of value provided. The brand association statement brand that understands customer needs was developed to reflect the brand's ability to create a value proposition that resonate with customers (Keller, 2008:64). The brand association statements, overall performance and customer service were developed to give an indication of perceived quality (refer to paragraph 4.3.1) as well as customer satisfaction. Customer satisfaction is an important requirement to create loyalty (Boshoff & du Plessis, 2009:320).
Loyalty, defined as an emotional bond between the brand and the customer which increases repeat purchases, is a core dimension of brand equity (Miller & Muir, 2004:213). Aaker recommends the use of price premium and satisfaction measures as indicators of loyalty (Mentz, 2011:182-185). Price premium as an indicator of loyalty refers to the amount a customer is willing to pay for the brand, compared to the amount he or she is willing to pay for another brand offering similar benefits (Farris, Bendle, Pfeifer & Reibstein, 2006: 116). The brand association statement value for money was developed to replace price premium as a loyalty measure (refer to paragraph 4.3.1). This was necessary due to the lack of price competition as a result of the regulated market environment at the time of this study and the presence of multiple sub-brands offering different benefits (Mentz, 2011:216).
4.3.3 Brand as a personality
Both Vodacom and MTN strive to create a strong brand personality. Prior to Vodacom's rebranding after Vodafone acquired the majority shareholding in 2010, Vodacom's brand essence was captured by the phrase 'South Africa's leading Cellular Network' (Affinity Advertising and Publishing, 2008: 128). MTN's brand personality is defined by its brand essence defined as 'original' and five core values i.e. 'can do', 'innovation', 'leadership', 'integrity' and 'relationships' (Mentz, 2011:103). Brand personality can be measured by using brand personality scales (Keller, 2008:370). Aaker (Mentz, 2011:189190) recommends the use of a measure that reflects the existence of a strong brand personality. The brand association statement, this brand has a personality was used for this purpose in this study.
4.3.4 Organisational associations
Organisational associations play an important role in the development of brand identity when branding at the corporate or company level is involved, as it provides the opportunity to link a wider range of brand associations to the corporate brand (Keller, 2008:449). Branding at the corporate level is a key feature of the branding strategy followed by Vodacom and MTN (Mentz, 2011:116). Six sub-dimensions of organisational associations were identified as important to assess the brand positioning of Vodacom and MTN. The sub-dimensions are referred to as: brand likeability, trust/care, social responsibility, market access, local versus global, technological sophistication, innovative and uniqueness.
Brand likeability
Brand likeability refers to the extent that the brand is liked by consumers (Aaker, 2002:133; Keller, 2008:459). The following brand association statements were developed to measure the brand likeability sub-dimension: likeable, fun to use, trendy and exciting, sincere/down to earth and adds value to my lifestyle. Sport sponsorships are used by Vodacom (Affinity Advertising and Publishing, 2009:114) and MTN (Affinity Advertising and Publishing, 2009:230) to develop brand likeability and in many instances reflect the aforementioned brand associations.
Trust/care
The corporate brand should be endowed with corporate image associations that present the organisation as trustworthy, responsive and caring about its customers (Keller, 2008:457459). The following brand association statements were developed to measure the trust/ care sub-dimension: trusted brand, friendly and helpful, keeps its promises, warm and caring. The aforementioned brand associations are prominent focus points of Vodacom's and MTN's customer relationship management programmes (Mentz, 2011:114-117,130-133).
Social responsibility
Corporate image associations are often created through the values and marketing programmes of a company and do not always relate directly to its products and services only (Keller, 2008:458). Vodacom (Vodacom Group Limited, 2010:55) and MTN (Affinity Advertising and Publishing, 2009:230) manage a number of corporate social investment programmes to contribute to the communities in which they operate. The brand association statement socially responsible was developed to measure this brand association. Vodacom (Vodacom Group Limited, 2010:48) and MTN (Affinity Advertising and Publishing, 2009:231) also actively manage a number of programmes and initiatives to protect and improve the environment and to make more effective use of scarce natural resources. As a result, the brand association statement cares for the environment was included as a related measure in the social responsibility sub-dimension.
Market access
Extensive distribution networks are used by Vodacom (Vodacom Group Limited, 2010:28) and MTN (MTN Group Limited, 2009:39) in the South African cellular market. The premier service delivery vehicle for both operators consists of company-owned and company operated service centres across the nine provinces of South Africa. The company owned distribution channels are supplemented by independent dealers, franchises, national chains and informal distribution channels. In addition to market access through distribution outlets, market access is also enabled through the use of online electronic media provided by means of websites and web-portals (Mentz, 2011:132). The following brand association statements were developed to measure the market access sub-dimension: distribution -access to outlets and easily accessible.
Local versus global
In the development of a corporate brand identity, a balance has to be struck between being a global brand with the accompanying prestige and credibility or a local brand that connects to the local market (Aaker, 2002:128, Venter & Jansen van Rensburg, 2009:237). Vodafone's shareholding in Vodacom has been used by Vodacom to evoke associations of a global brand (Vodacom Group Limited, 2009:24-25). The company has used sport sponsorships to connect to the local market striving to create the perception that it is the greatest supporter of South African supporters (Mentz, 2011:110). MTN has used its sport sponsorships to create the perception that it is the leading provider of telecommunication services in emerging markets with a prominent position in Africa and the Middle East (Affinity Advertising and Publishing, 2009: 230). The following brand association statements were developed to measure the local versus global sub-dimension: South African brand, Global brand, African brand, prestigious/upmarket brand (refer paragraph 4.3.1).
Technologically sophisticated
Both Vodacom (Vodacom Group Limited, 2010:20) and MTN (MTN Group Limited, 2009:38) are continuously upgrading their networks with the latest technology available. The brand association statement technologically sophisticated was developed to measure this sub-dimension (refer paragraph 4.3.1).
Innovative
A corporate identity that is perceived as innovative can enhance corporate credibility and strategically benefit the organisation by increasing acceptance of brand extensions (Keller, 2008:456). The brand association statement innovative was developed to measure this sub-dimension (refer paragraph 4.3.1).
Unique
Establishing a unique brand positioning is the ultimate objective to create a sustainable competitive advantage (Keller, 2008:58). The brand association statement unique was developed to measure this sub-dimension.
5 Research methodology
The hypotheses tested and supporting descriptive statics used in this study are subsequently discussed.
5.1 Hypotheses and descriptive statistics
The null hypotheses (H0) tested stated that there was no difference between principal estate agents using Vodacom and principal estate agents using MTN with regard to the 28 brand association statements that have been developed in the literature review. The alternative hypotheses (H1) stated there was a difference. The Mann-Whitney U test was used as the test statistic to compare the location of the differences in the rating of the brand association statements by the two groups (Malhotra, 2007:486). Statistical significance has been tested at the 0.05 and lower levels of significance. The results are presented in Table 2 and are discussed in paragraph 6.3.
In addition to the hypotheses tested, descriptive statistics, that is, frequency tabulation (Malhotra, 2007:458) were also used to provide additional insight pertaining to the strength of the brand associations (refer paragraph 5.3).
5.2 Survey and sample
The Directory of Gauteng-based Estate Agency Firms Registered with the Estate Agency Affairs Board as at 23 February 2009 was used as a sample frame for the study. The research frame contained a total of 12 629 estate agency firms. A two-stage sampling method was used. During the first stage, estate agencies (the sample units) were selected randomly. Telephone interviews were used to determine whether the estate agency was in fact operational and for initial contact and screening. A total of 2 867 estate agencies were contacted by telephone. Of these agencies 1 632 had to be excluded from the survey, due to the following reasons: the telephone was not answered; the dialled number was a fax line; the company was not an estate agency firm; the principal estate agent declined to participate in the survey. As a result of the global economic downturn the number of active registered estate agencies declined significantly over the period 2007 to 2008 (Kloppers, 2008:1) and this contributed significantly to the large fall out of estate agency firms contacted.
During the second stage, quota controls were used, based on the primary network service provider used by the principal estate agent. Once an estate agency firm was identified as active, an invitation to participate in the survey, with a link to the questionnaire, was e-mailed to qualified respondents. A total of 1 235 links requesting participation in the survey were e-mailed this includes 383 links that were re-sent, after a follow-up telephone call. The follow-up telephone call and resending of the link was done to minimise non-response error. Fieldwork was closed after a total of 255 completed questionnaires had been returned by principal estate agents who had agreed to participate in the survey. This implies a response rate of 29.93 per cent of participants willing and able to participate in the survey. Fieldwork took place from 18 May 2009 to 21 August 2009. Thus, the research was conducted prior to the rebranding of Cell C in 2010 (Mentz, 2011:76), the launching of 8.ta by Telkom and the change of Vodacom's corporate colour from blue to red.
The quota targets were determined based on Vodacom, MTN and Cell C's market share within the LSM seven to ten groups among cellphone users in Gauteng as reported by SAARF (2009) at the time of the survey. The target quotas were defined as follows: Vodacom 125, MTN 95 and Cell C 30. The target for Cell C was increased from 27, based on market share estimates, to 30. The actual number of interviews realised were as follows: Vodacom 135, MTN 95 and Cell C 25. Cell C was excluded from the quantitative analysis as the number of completed interviews was less than 30.
Principal estate agents were identified as a user group likely to fall within the higher end of the market broadly defined as the LSM seven to ten groups. Personal total monthly income increases as individuals fall into higher LSM groups. At the time of the survey the percentage of individuals that earned a personal total monthly income of less than R7 999 per month varied as follows from LSM seven to LSM ten (SAARF, 2009): LSM seven (49.2 per cent), LSM eight (39.1 per cent), LSM nine (30.5 per cent), LSM ten (21 per cent). To ensure that only respondents that fell within the higher end of the market were included in the sample, respondents that did not report personal total monthly income as well as those that reported a personal total monthly income of less than R7 999 per month were excluded from further analysis. In total 182 respondents were included for further analysis (109 Vodacom users and 73 MTN users).
5.3 Measurement instrument
The 28 brand association statements discussed in paragraph 4.3 were included in the measurement instrument. Respondents indicated their level of agreement with each brand association statement on a five-point rating scale, varying from strongly disagree to strongly agree. The scale values were defined as follows: strongly disagree = 1, disagree = 2, neither agree nor disagree = 3, agree = 4, strongly agree = 5. Don't know responses (don't know = 6) were excluded from any further statistical analysis.
Validity of the measurement instrument was assessed from the perspective of content validity (Malhotra, 2007:286). Agreement was reached between scholars in the field regarding the suitability of the brand association statements developed.
Each statement was analysed individually to compare the ratings of Vodacom and MTN users. As a result no reliability analysis was done (Malhotra, 2007:284-285). Due to the exclusion of don't know responses the sample size based on the number of observations per variable did not meet the minimum requirements for factor analysis (Hair, Black, Babin, & Anderson, 2010:102).
6 Discussion of the research results
The research results are discussed in three subsections, that is, the sample profile in terms of access to telecommunication services, hypotheses tested, and the brand positioning of Vodacom and MTN based on the brand association ratings.
6.1 Access to telecommunication services
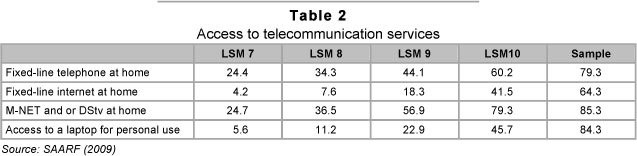
Access to telecommunication services reported by the sample was higher than that reported for individuals in the LSM seven to LSM ten groups at the time of the survey (SAARF, 2009). A comparison of the LSM data compared to that reported by the sample shows a skew towards LSM ten. The results are presented in Table 2.
The overall average contract expenses per month was R1 368, with an upper bound of R1 577 and a lower bound of R1 159, based on the 95 per cent confidence interval for the mean. The average monthly cellular contract expenses of Vodacom and MTN users did not differ at a statistically significant level of 5 per cent or lower based on the Mann-Whitney U test. The average monthly contract expenditure for the sample is significantly more than the average revenue per user reported by Vodacom (R474) and MTN (R365) for contract users in the 2009 financial year (Vodacom Group Limited, 2010:32, MTN Group Limited, 2009:36).
6.2 Hypotheses tested
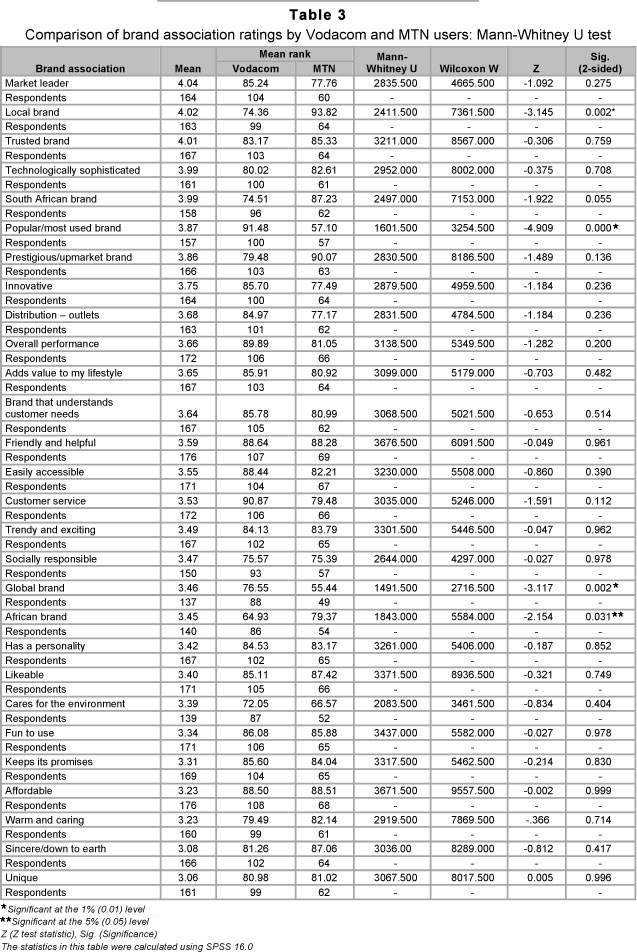
The results for the Mann-Whitney U test (refer to paragraph 5.1) are presented in Table 3. The brand association statements are ranked in declining order based on the overall mean.
The null hypotheses (Ho) were rejected for the following brand association statements:
- Local brand (based on the mean rank, MTN received a more favourable rating than Vodacom).
- Popular/most used brand (based on the mean rank, Vodacom received a more favourable rating than MTN)
- Global brand (based on the mean rank, Vodacom received a more favourable rating than MTN)
- African brand (based on the mean rank, MTN received a more favourable rating than Vodacom).
Vodacom received more favourable mean rankings on all the brand association statements that do not differ statistically significant between the two users groups with the exception of the following brand association statements: likeable, warm and caring, sincere/ down to earth and unique. However, the mean rankings of Vodacom and MTN were fairly similar on all the aforementioned brand association statements.
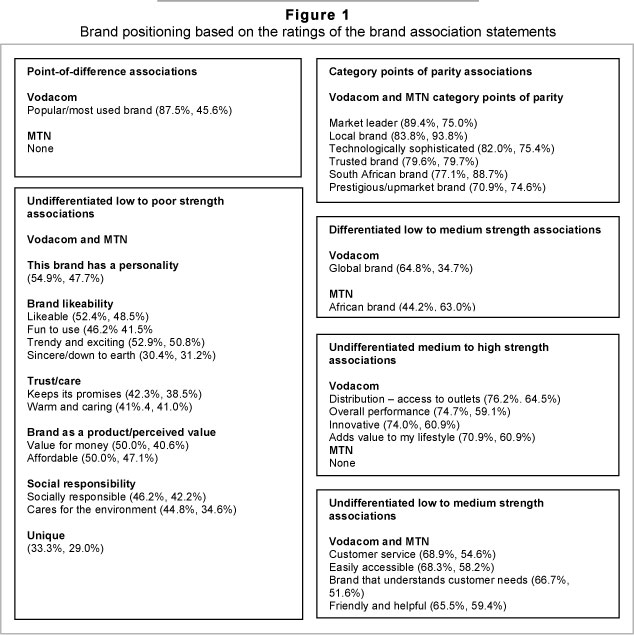
Brand positioning based on brand association statement ratings
A summary of Vodacom and MTN's brand positioning, based on the top-two-box ratings (agree/strongly agree) of Vodacom and MTN users is presented in Figure 1. The top-2-box ratings for Vodacom and MTN are indicated in brackets.
Point-of-difference brand associations
Point-of-difference brand associations are strong, favourable and unique brand associations (Keller. 2008:107-108). It is important that consumers positively evaluate these associations and believe that they cannot be found to the same extent in competitive brands (Venter & Jansen van Rensburg, 2009:219). Consumers' actual brand choices often depend on the perceived uniqueness of brand associations, especially if the unique brand associations imply superior value to consumers over a protracted period of time (Keller, 2008:107-108).
Vodacom established a point-of-difference association with the brand association statement popular/most used brand. The Mann-Whitney U test confirmed a statistically significant difference between the two user groups on this statement. MTN did not establish a point-of-difference association with any of the brand association statements.
Points of parity brand associations
Points of parity brand associations are not unique as they are shared with other brands. Points of parity brand associations can be categorised into two types, that is, category and competitive points of parity (Keller, 2008:109). Category points of parity demonstrate a brand's legitimacy and credibility in the category. They represent the minimum requirements for brand choice in the category. To achieve a point of parity on a brand association, a sufficient number of consumers must believe that the brand does sufficiently well on the association (Keller, 2008:109-110). Competitive points of parity are brand associations that negate competitor advantages, in other words, the brand break even on associations where its competitors are trying to establish an advantage (Keller, 2008:109-110, Venter & Jansen van Rensburg, 2009:219)
Vodacom and MTN received high top-two box ratings (above 70 per cent) for the brand association statements mentioned as category points of parity in Figure 1. A strong association with the category points of parity will have to be established by new market entrants to be considered as credible in the category. The Mann-Whitney U test indicated a statistical significant difference between the two user groups on the statement local brand with MTN receiving a more favourable rating. However, Vodacom has established a sufficiently strong association to establish a category point of parity.
Differentiated low to medium strength brand associations
Vodacom's positioning on the statement global brand has been categorised as a differentiated low strength brand association. Vodacom received a top-two box rating of 64.8 per cent, compared to MTN's 34.7 per cent. The Vodacom and MTN ratings differed at a statistically significant level on this statement. Vodacom, however, did not establish a sufficiently strong association to categorise its positioning with regard to this statement as a point-of-difference association. An opportunity exists for Vodacom to develop a point-of-difference on this brand association by improving the strength of its association on this statement.
MTN's positioning on the statement African brand has been categorised as a differentiated low strength brand association. MTN received a top-two box rating of 63 per cent, compared to Vodacom's 44.2 per cent. The Vodacom and MTN ratings differed at a statistically significant level with regard to this statement. MTN, however, did not establish a sufficiently strong association to categorise its positioning with regard to this statement as a point-of-difference association. An opportunity exists for MTN to develop a point-of-difference on this brand association by improving the strength of its association on this statement.
Undifferentiated medium to high strength brand associations
Vodacom's positioning on the statements distribution - access to outlets, overall performance, innovative, and adds value to my lifestyle, has been categorised as undifferentiated medium to high strength brand associations. Vodacom received higher top-two box ratings than MTN on all the aforementioned brand association statements. Vodacom's top-two-box ratings on these associations varied between a high of 76.2 per cent and low of 70.9 per cent. MTN's top-two-box ratings on these statements varied between a high of 64.5 per cent and a low of 59.1 per cent. The ratings for Vodacom and MTN did not differ statistically significantly with regard to any of the statements. Vodacom has established strong brand associations (top-two-box scores above 70 per cent) on all the brand association statements. Thus, an opportunity exists for Vodacom to establish point-of-difference associations should it achieve significantly higher ratings (differentiation) compared to MTN on these statements. It is unlikely that MTN will be able to establish point-of-difference associations on these statements based on its current positioning. However, should MTN improve the strength of its association on these statements sufficiently (top-two-box scores above 70 per cent) Vodacom's advantage can be negated and category points of parity will be established.
Undifferentiated low to medium strength brand associations
Vodacom's and MTN's positioning on the statements customer service, easily accessible, brand that understands customer needs, friendly and helpful, has been categorised as undifferentiated low to medium strength brand associations. Vodacom received higher top-two-box ratings than MTN on all the aforementioned brand association statements. Vodacom's top-two-box ratings on these associations varied between a high of 68.9 per cent and low of 65.5 per cent. MTN's top-two-box ratings on these statements varied between a high of 59.4 per cent and a low of 51.6 per cent. The ratings for Vodacom and MTN did not differ statistically significantly with regard to any of the statements. An opportunity exists for Vodacom to establish point-of-difference associations should it achieve significantly higher ratings (differentiation) compared to MTN on these statements. It is unlikely that MTN will be able to establish point-of-difference associations on these statements based on its current positioning. The low to medium strength brand associations should be an area of concern for both Vodacom and MTN.
Undifferentiated low to poor strength brand associations
Both Vodacom and MTN received top-two-box ratings below 55 per cent with regard to the brand association statements identified as undifferentiated low to poor strength brand associations in Figure 1. The ratings for Vodacom and MTN did not differ statistically significantly with regard to any of the statements. The low to poor strength brand associations should be an area of concern for both Vodacom and MTN. Neither has established a brand personality that resonates with the user groups. Despite significant investment in corporate social responsibility programmes, both received low ratings on the statements included to measure this subdimension.
7 Management implications
The literature review and assessment of the marketing environment identified 28 brand associations that should be considered by Vodacom and MTN in the positioning of their brands for the upper-end LSM groups, that is, LSM seven to ten. Brand association statements were developed to measure the brand associations. Principal estate agents were identified as an accessible user group that are likely to fall within the LSM seven to ten groups. The profile of the sample (principal estate agents in Gauteng), in terms of access to telecommunication services, confirmed a skew towards the LSM ten group.
Comparing Vodacom and MTN's brand positioning based on the brand association statements measured revealed a low level of brand differentiation. The Mann-Whitney U test confirmed statistically significant differences on four brand association statements. However, considering the strength of the brand associations that differed at a statistically significant level, only one point-of-difference association has been established.
Category points of parity brand associations have been established on six brand association statements. Differentiated low to medium strength brand associations have been established on two brand association statements, with Vodacom favourably positioned on the brand association statement global brand and MTN favourably positioned on the brand association statement African brand. Four brand association statements were categorised as undifferentiated medium to high strength, with Vodacom and MTN positioned very similarly on the brand association statements. Four brand association statements were categorised as undifferentiated low to medium strength, with Vodacom and MTN positioned very similarly on the brand association statements. Twelve brand association statements were categorised as undifferentiated low to poor strength, with Vodacom and MTN positioned very similarly on the brand association statements.
The main contribution of this study is the confirmation that there is a lack of brand differentiation between Vodacom and MTN in the defined target market. The development of brand associations that will contribute to a unique brand positioning based on a personal brand relationship with users should be considered.
References
AAKER, D.A. 2002. Building strong brands. London: Simon & Schuster. [ Links ]
AFFINITY ADVERTISING AND PUBLISHING. 2011. The encyclopaedia of brands and branding in South Africa. (17th ed.) Johannesburg. [ Links ]
AFFINITY ADVERTISING AND PUBLISHING. 2009. The encyclopaedia of brands and branding in South Africa. (15th ed.) Johannesburg. [ Links ]
AFFINITY ADVERTISING AND PUBLISHING. 2008. The encyclopaedia of brands and branding in South Africa. (14th ed.) Johannesburg. [ Links ]
BOSHOFF, C. & DU PLESSIS, F. 2009. Service marketing: a contemporary approach. Cape Town: Juta & Co. [ Links ]
BUSINESS MONITOR INTERNATIONAL. 2009. South African telecommunications report quarter 2 2009. London: Business Monitor International. [ Links ]
FARRIS, P.W., BENDLE, N.T., PFEIFER, P.E. & REIBSTEIN, D.J. 2006. Marketing metrics. New Jersey: Pearson Education. [ Links ]
GERBER-NEL, C. 2006. Determination of the brand equity of the provincial, regional and national rugby teams of South Africa. D.Com Thesis. Department of Business Management, UNISA. [ Links ]
HAIR, J.F., BLACK, W.C., BABIN, B.J. & ANDERSON, R.E. 2010. Multivariate data analysis: a global perspective. (7th ed.) New Jersey: Pearson Prentice Hall. [ Links ]
JAMES, A. 2006.Cell C's 5th birthday. The Star advertisement feature, 17 November:2. [ Links ]
KELLER, K.L. 2008. Strategic brand management: building, measuring, and managing brand equity. New Jersey: Prentice Hall John Wiley and Sons. [ Links ]
KLOPPERS, E. 2008. Geffen se eiendomsmark is in groter knyp. Beeld, Sake 24, 24 April:1. [ Links ]
LAMB, C.W., HAIR, J.F., MCDANIEL, C., BOSHOFF, C. & TERBLANCHE, N.S. 2008. Marketing. (3rd SA ed.) Cape Town: Oxford University Press. [ Links ]
MALHOTRA, N.K. 2007. Marketing research: an applied orientation. (5th ed.) New Jersey: Pearson Prentice Hall. [ Links ]
MENTZ, H. 2011. Customer-based brand equity of the major cellphone network service providers amongst principal estate agents in the Gauteng province of South Africa. D.Com Thesis. Department of Business Management, UNISA. [ Links ]
MILLER.J. & MUIR D. 2004. The business of brands. West Sussex: John Wiley & Sons. [ Links ] MTN GROUP LIMITED. 2009. MTN Group Annual Report for the financial year ended 31 December 2009. [ Links ] SOUTH AFRICAN ADVERTISING RESEARCH FOUNDATION (SAARF). 2010. Industry presentation: SAARF Segmentation Tools. May 2010. [ Links ]
SOUTH AFRICAN ADVERTISING RESEARCH FOUNDATION (SAARF). 2009. All Media and Products Survey (AMPS). 2009RB. [ Links ]
VENTER, P. & JANSEN VAN RENSBURG, M. 2009. Strategic marketing: theory and applications for competitive advantage. Cape Town: Oxford University Press. [ Links ]
VODACOM GROUP LIMITED. 2010. Vodacom Group Annual Report for the financial year ended 31 March 2010. [ Links ]
VODACOM GROUP LIMITED. 2009. Pre-listing statement 2009 (Issued 2 March 2009). [ Links ] VODACOM GROUP LIMITED. 2006. Vodacom Group Annual Report for the financial year ended 31 March 2006. [ Links ]
Accepted: April 2012

