


Servicios Personalizados
Articulo
 Inglés (pdf)
 Articulo en XML
 Referencias del artículo
Indicadores

Links relacionados
-
 Citado por Google
 -
 Similares en Google
Compartir

 Permalink
South African Journal of Economic and Management Sciences
versión On-line ISSN 2222-3436
versión impresa ISSN 1015-8812
S. Afr. j. econ. manag. sci. vol.15 no.4 Pretoria ene. 2012
ARTICLES
Empirical study of national technological innovation capability in africa
Mónica García-Ochoa MayorI; María Luisa Blázquez de la HeraII; Enrique de Diego RuizII
IDepartment of Business Administration, Complutense University of Madrid
IIIESE Business School, International Center for Competitiveness
ABSTRACT
This paper performs an analysis of the technological innovation capability in 30 African countries. Based on the literature about national innovation capability and economy of technological change, an empirical study has been performed by using clusters' analysis technique and the technological innovation indicators published in the Global Competitiveness Report 2010-2011 (WEF, 2010). The purpose is to explore the existence of groups of countries characterised by different technological innovation levels, deepening in their characteristics and the distance that separates them. The results show the existence of four groups of countries defined by different technological innovation capabilities in three factors, which are the Governmental and business technological effort, the Technological infrastructure and human capital (Available Base) and the Protection of intellectual property and innovation results.
Key words: technological innovation capability, cluster analysis, technological policy, technological infrastructures, innovation results, Africa.
JEL: O31, 33, 38
1 Introduction
Until recently, most economists believed that the accumulated capital per worker was the single factor explaining differences in the development levels of the countries (Solow, 1956; Fagerberg, 1994). However, from the 1960s the idea that the differences in development were principally due to technological differences has received an increasing support (Gerchenkron, 1962). This point of view is consistent with Schumpeter's theory of growth (1934, 1943) and during the 1980s many studies about the differences in development and growth among countries were inspired in this emerging perspective (Freeman, Clark & Soete, 1982; Fagerberg, 1987; Dosi, Freeman, Nelson & Soete, 1988; Verspagen, 1991).
Nowadays it is widely accepted that technology1 is one of the principal drivers of sustained economic growth (Romer, 1990; Aghion & Howitt, 1992; Grossman & Helpman, 1993; Juma et al., 2001; Fagerberg & Srholec, 2008; Lee & Kim, 2009). This justifies the decision in recent years, for academics and governments pay more attention to this matter and try to measure the technological capabilities of nations.
In the last two decades, two main questions have interested the academic community that studies the technological capabilities of countries. The first one refers to the general measure of the technological capabilities at a national level (Grupp & Schubert, 2010; OECD, 2007.) The second question is related to the global dynamics of technology, and particularly the study of a small group of advanced countries which are responsible for most of the technology and innovation production in the world (Archibugi & Iammarino, 2002; Kemeny, 2009).
An in-depth study of the roots and consequences of technological innovation reveals that the innovation 'new to the world' tends to be concentrated in a few countries (Furman, Porter & Stern, 2002). In fact, there are only a few nations that consistently improve their knowledge base. Most countries remain behind and even have difficulty absorbing capabilities considered obsolete in other parts of the world (Archibugi & Coco, 2004).
In consequence, due to the geographical concentration of innovations2 there is a growing interest in understanding the facts that determine the different innovation capability of countries. In this sense, for researchers, the differences in technological capabilities among countries are one of the main factors explaining the existence of clusters3 or groups of countries (Godinho, Mendoca & Pereira, 2005).
Thus, in recent years, there has been an increased number of international comparative studies about technological innovation capabilities (Archibugi & Iammarino, 2002; Archibugi & Coco, 2004; Castellaci & Archibugi, 2008; Fagerberg & Srholec, 2008; Kemeny, 2009). In this respect, the specialists in the economy of technological change have been interested in the study of the existence and characteristics of the 'national innovation systems', arguing that the analysis of the technological capabilities of different territorial states makes sense as they provide major institutional scope for the generation and spread of know-how (Lundvall, 1992; Nelson, 1993; Freeman, 1997). This analysis has already been successfully applied in developing countries (Sutz, 1997).
Especially in the field of the economy of innovation and technological change, and following the approach of an 'innovation system', there have been several studies trying to characterise these capabilities, their elements and their implications for development and economic growth. In this sense, it is worth mentioning the works of Abramovitz (1986), Fagerberg (1987), Dosi et al., (1988), Cohen & Levinthal (1990), Lall (1992), Lundvall (1992), Nelson (1993), Edquist (1997; 2004), Freeman (1997), Sutz (1997), Archibugi & Coco (2004), Fagerberg & Godinho (2004), Navarro, Gibaja, Bilbao-Osorio & Aguado (2009) among others.
Therefore, this emphasises the need to deepen in the study of indicators that measure the technological and innovation capabilities, trying to analyse the composition and to study which components have more importance in improving a country's technological innovation capability, in making strategic decisions about innovation activities, carrying out political actions to stimulate the innovation in the areas where it is needed, and better understanding the economic and social transformations that take place in countries (Archibugi, Denni & Filippetti, 2009; Grupp & Schubert, 2010).
The development of technological innovation capabilities is especially relevant in the case of African countries. In this sense, several researchers and international institutions are convinced that structural transformation and economic and social development of African countries depend upon their scientific, technological and innovation capabilities (Mugabe, 2006; World Bank, 2009; AU-NEPAD, 2010). This recognition is manifested in the various initiatives that countries have launched both individually and collectively (Mugabe, 2011). At national level, a growing number of countries are reviewing and revising their policies and strategies for creating conducive environments for investment in science, technology and innovation, and in some cases new policies and strategies are being designed. There are regional efforts such as the approval of the Southern African Development Community Protocol of Science, Technology and Innovation in 2008, the creation in 2007, within the Economic Community of West African States Commission, of a Department of Education, Culture, Science and Technology; the purpose of this department is to promote science, technology and innovation for regional integration, economic development, poverty reduction and social emancipation of people of West Africa. Finally, the inclusion in the East African Community Treaty of several provisions promotes the application of science, technology and innovation for development in the East African region (AU-NEPAD, 2010). It is also worth mentioning that a number of regional and international institutions have developed programmes aimed at helping African countries in the areas of science, technology and innovation, such as the African Union (AU), the New Partnership for Africa's Development (NEPAD), the African Development Bank (AfDB), the World Bank and the United Nations Educational, Scientific and Cultural Organisation (UNESCO) (Mugabe, 2011).
Consequently, the main reason that has led us to select the African continent for our research has been the lack of studies on technological innovation capacity in developing countries in general and, specifically, in Africa. African countries are increasingly recognising that they should invest in science, technology and innovation capabilities in order to respond to the socio-economic challenges they face, and we think that our work can help improve the knowledge and further development of those capabilities.
Thus, based on the literature about national innovation capability and economy of technological change, the purpose of this paper is to analyse the technological innovation capability of 30 African countries. The study explores the existence of groups of countries characterised by different innovation levels, showing the characteristics of each group and the distances between them in the period 2010-2011.
The work has been done using the technological innovation indicators published in the Global Competitiveness Report (GCR) 2010-2011 (WEF, 2010). The empirical analysis examines these data through three steps: the first consists in reducing the great number of indicators through a factorial analysis, obtaining three factors (Government and business technological effort; Technological infrastructure and human capital (Available Base) and Protection of intellectual property and innovation results). Secondly, these three factors are used to identify different groups of countries through the statistical technique of cluster analysis. Finally, an econometric test is performed to evaluate the statistical precision of the obtained results.
The following are the main contributions of this paper. From the point of view of the technological innovation literature, our results provide new empirical evidence on the existence of four different groups of countries in Africa in terms of their technological innovation capability, showing the dimensions in which each group differs from the others. Furthermore, it is clearly shown that the differences between these countries are well reflected by three factors, as the factor and cluster analyses indicate. We have labeled the first factor 'Governmental and business technological effort', the second factor 'Techno- logical infrastructures and human capital' and the third factor 'Intellectual property protection and innovation results'.
Our research and classification could help to identify and to understand the challenges and opportunities that the countries of each cluster will have to face in the future, and in this sense some political recommendations are proposed that might help in the development of technological capabilities.
Therefore, the paper has been organised as follows: in the second section, the theoretical framework for the empirical analysis is provided, and at the same time the 15 indicators used to measure the technological innovation capability of the different countries of the sample are defined, likewise justifying their selection. The third section shows the methodology used in the empirical analysis, firstly an inspection of the descriptive statistics of all variables and secondly a factorial analysis. Section 4 presents the results of the cluster analysis, revealing the existence of four groups of countries characterised by different technological innovation levels. Section 5 concludes this study, describing the main political implications that are derived from the empirical results and proposing some recommendations in terms of technological innovation policies for each of the four groups or clusters obtained. Finally, we have included an Appendix B, which shows the results of the performance of an econometric test, which validates the results obtained in cluster analysis.
2 Theoretical framework
Before defining the indicators selected to measure the technological innovation capability of the countries, and proceeding to justify and argue their election, we clarify some concepts that are similar and often overlap.
In recent years some terms, such as 'technological capabilities' (Kim, 1980, 1997), 'absorption capability' (Cohen & Levinthal, 1990; Dahlman & Nelson, 1995), 'innovation systems' (Lundvall, 1992; Nelson, 1993: Edquist, 1997; Sharif, 2006), 'innovation capability' (Kim, 1997; Furman et al., 2002) have appeared, together with a wide empirical literature that studies these aspects of economic development (Fagerberg & Godinho, 2004; Archibugi & Coco, 2005, among others). However, as we will see in the next section of the paper and as Fagerberg and Srholec (2008) point out, there is an important overlapping among some of these concepts, the relationship between conceptual and empirical work in this area frequently being very weak.
In this sense, Kim (1997) defines national technological capability as 'the ability to make an effective use of the technological knowledge that allows to assimilate, use and change the existing technologies'. Following Fagerber and Srholec (2008), this definition is very similar to the 'absorption capability'. Dahlman and Nelson (1995) define national absorption capability as 'the ability to learn and implement the technologies and associated practices of developed countries'. This definition is derived from the analysis at company level performed by Cohen and Levinthal (1989). These authors suggested the term of 'absorption capability' and defined it as 'the capability of a company to recognize the value of external information, to assimilate it and to develop its application for commercial purposes' (Cohen & Levinthal, 1990). Therefore, this concept represents the link between the capabilities of the companies to develop and improve new products on one side, and the external stock of technological opportunities on the other side (Criscuolo & Narula, 2008). At this point, it is worth mentioning that Kim (1997) uses the concepts of national absorption capabilities and national technological capabilities in an interchangeable way.
Likewise, we must point out that the concept of national absorption capability has been associated until now in the literature about technology transfer with the concept of national technological capabilities, and in the literature about endogenous growth with the concept of human capital (Lucas, 1988; Romer, 1990).
Following Criscuolo and Narula (2008) and starting from the definition of technological capabilities, it should be taken into account that they include not only the capability of searching and selecting the most appropriate technology to assimilate it to the already available absorption capability, but also the creation of new knowledge mainly through investment in R&D. Therefore, the absorption capability represents a subset of technological capabilities (Criscuolo & Narula, 2008).
Meanwhile, during the 1980s a new systemic approach emerged for the study of the countries' ability to generate technology and improve through what it called a 'national innovation system', converting this into an analytical tool to study the economic development and the technological abilities of the countries (Lundvall, 1992; Nelson, 1993; Edquist, 2004).
The concept of a national innovation system makes reference to the group of institutions that contribute to the development and diffusion of new technologies. These institutions provide the framework in which governments implement policies to influence in the innovation process. Therefore, it is a 'system of interconnected institutions, to create, store and transfer knowledge, abilities that define new technologies' (Sharif, 2006).
As has been previously discussed, the concept of technological capabilities refers to the ability to develop and commercially exploit new knowledge, the ability to innovate being an important element of them (Fagerberg & Srholec, 2008), which Kim (1997) named 'innovation capability'. Therefore, national innovation capability can be defined as 'the ability of a country as a political and economic entity to produce and commercialize a flow of innovative technology in the long term' (Furman et al., 2002).
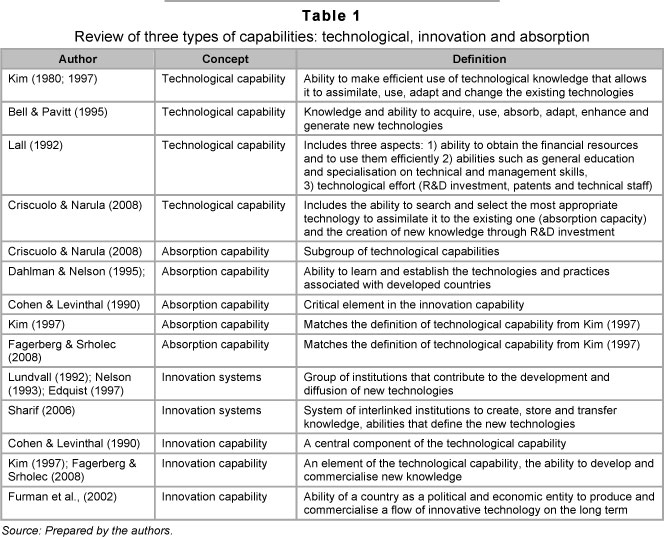
Consequently, although the three types of capabilities (technological, absorption and innovation) have usually been treated separately, the existence of shared elements among them and their strong correlation makes it possible and advisable for them to be studied together. Table 1 offers a summary of the main contributions to these concepts. Based on the definitions in Table 1 it can be concluded that technological capabilities include the innovation and the absorption concepts (CEPAL, 2007).
Consequently, the link established among the technological, innovation and absorption capabilities allows the effort to focus on the measuring of the technological ones, as they include the other two (CEPAL, 2007). For this reason, this work, with the purpose of analysing the technological innovation capability of 30 African countries, will be based on the definitions that include the three aforementioned concepts, for example the 'technological capability' definition of (Kim (1980; 1997);Patel and Pavitt, (1995) and Criscuolo and Narula (2008), and the concept of 'innovation capability' proposed by Furman et al., (2002) (see Table 1).
So the concept of technological capabilities includes variables that can be grouped in different dimensions. In this respect, Lall (1992) mentions three main dimensions: 1) structure and development, where he included, for example, GDP, growth and exports, 2) education and 3) science and technology. Archibugi and Coco (2004) developed an index of technological capabilities with three dimensions: 1) Technology creation, 2) Techno- logical infrastructures and 3) Human skills development. Other authors such as Filippeti and Peyrache (2010) group the selected variables to measure the technological capabilities in three different dimensions: 1) Business innovation (patents), 2) Knowledge and skills (researchers in R&D; scientific and technical articles; public R&D; Tertiary education, and 3) Infrastructure (Personal computers; Fixed and mobile phones; Internet users; Gross fixed capital formation and Broadband subscribers). Also, CEPAL (2007) considers three dimensions of this concept for developing countries: 1) Available base (initial base of capabilities) that includes infrastructure and human resources, 2) Effort made for the increase and consolidation of the technological innovation capacity, such as government policy, R&D investment and knowledge acquisition and 3) Results achieved through existing capabilities, such as patents.
We have decided to group our variables following the dimensions proposed by CEPAL (2007), as we show in section 3.2. of this paper. We have chosen this option because CEPAL (2007) groups the variables of technological innovation in three dimensions taking into account the innovation systems of developing countries.
With regards to this, it is worth mentioning that in most developing countries the nature of technological effort is different from that of developed countries. Developing countries have a higher need to build an initial base of capabilities and they need an initial learning process. Also, their markets and support institutions are less developed and less aware of business needs, the information networks are smaller, the entrepreneurship capacity to initiate risky technological effort is less developed, and the financial system is less oriented to supporting this effort. The technological activity deals more with absorption and improvement of the existing technology than with innovation.
On the other hand, knowledge is used differently depending on the stage of development. In countries with mature industries, the competitive use of technology has to do mainly with innovation (the ability to create new products and/or processes). However, in developing countries the use of technology is more related to building the ability to use the existing technologies at competitive levels of cost and quality (Lall & Pietrobelli, 2005).
2.1 Measurement of the technological capabilities: indicators used
As we have just described, the concept of technological capabilities has been used in a large number of studies. Although it was initially developed for the analysis of companies, it has also been applied to industries and countries.
Lall (1992) underlined three aspects that define the 'national technological capabilities': 1) The ability to gather the necessary financial resources and their efficient use; 2) Skills, including not only general education but also the specialisation in technical and managerial competences and 3) What he called 'national technological effort', which would be associated with measures such as R&D investment, patents and technical staff (Fagerberg & Srholec, 2008). This implies that in building technological capabilities some of the factors involved are company related and others are country related (incentive policy, institutional structure, resources, human capital and technological effort). Thus, it is possible to identify the accumulation of technological capabilities at the micro-economic level (in businesses), but also at national level (macroeconomic) (CEPAL, 2007). Therefore, the development of techno-logical innovation indicators has been carried out at both micro and macro levels. In fact, data collection and surveys are developed systematically at the levels of enterprise, industry, technology field and country (Sirilli, 1997; Smith, 2005).
The main purpose of the indicators is to compare different countries' positions and their changes. At this point, Archibugi et al., (2009) raise two interesting methodological questions. The first question relates to the use of 'countries' as the analysis unit, because countries are composed of different areas and regions that can be heterogeneous. In this regard, the ability to make comparisons between countries is based on the assumption that a national innovation system is able to distribute knowledge throughout the country (Patel & Pavitt, 1995). A second question that may arise is the usefulness of international comparisons, since differences in technological capabilities can be very large between certain countries, so comparisons will be more meaningful if they are made between similar national innovation systems.
Thus, in this paper we have taken into account the 30 African countries where there is availability of technological innovation indicators in the Global Competitiveness Report 20102011 (WEF, 2010). On the other hand, we have only considered the period 2010-2011 because data would not have been available for a longer period of time and many of the countries would have to be excluded from the analysis.
In our study, we use a series of indicators that measure relevant aspects directly related to the technological innovation capability. The need to use different indicators reflects a growing awareness that a single statistic, such as resources devoted to R&D, the number of patents or trade in high-tech products could provide information about specific aspects related to technology skills, but it would offer incomplete information (Archibugi et al., 2009). Therefore, by using a set of indicators, we define more precisely the situation in each country, providing an easier understanding of the differences between them. In addition, none of the indicators should be considered separately but combined and weighting the evidence provided by each one (CEPAL, 2007).
With regards to the specific indicators that we have used to carry out the empirical analysis of this work, we should point out that since the 1970s there have been numerous efforts to measure technological capabilities. Some international organisations, such as the World Bank (WB), the United Nations Development Programme (UNDP), the United Nations Industrial Development Organization (UNIDO), the World Economic Forum (WEF) and the European Commission (EC), have developed their own indicators. All of them take into account different aspects of what constitute the technological capabilities of a country and try to provide a ranking of countries according to them.
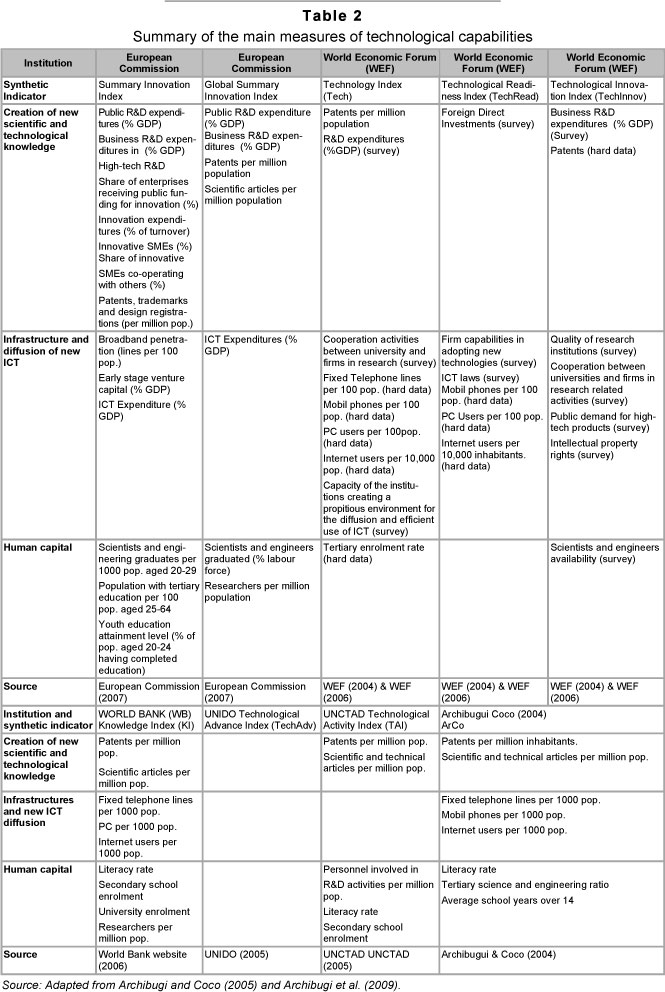
Archibugi and Coco, (2005) and Archibugi et al., (2009), in an attempt to advance in this field, provided a compilation of the previous work (see Table 2). In order to be consistent with these previous studies, to perform the empirical analysis of our work we have taken into account the indicators included in the Technology Index (Tech), Technological Readiness Index (TechRead) and the Technological Innovation Index (TechInnov) published by the World Economic Forum (WEF) (see Table 2), as the three of them consider aspects related to technological capabilities and innovation. In particular, the Tech Index is the sub-indicator from the Growth Competitiveness Index (GroCI)4 related to technological capabilities and it includes three main categories: innovation capability, technology transfer and ICT diffusion. As for the TechRead and TechInnov, it is worth clarifying that the Global Competitive Index (GloCI)5 from the GCR 2010-2011 is composed of twelve pillars or categories and these are subdivided into three groups: basic requirements, efficiency enhancers and Innovation and sophistication factors. Of the twelve pillars, those considering the aspects related with innovation capabilities are numbers nine (technological readiness) and twelve (innovation) which respectively match with TechRead and TechInnov (Archibugi et al., 2009).
In the empirical analysis of this work we have used all the indicators included in the three previously described indexes with the exception of PC users, due to the fact that these data have not been published in the GCR 2010-2011. As we have commented, these selected indicators for our study are collected in different pillars from the Global Competitiveness Report (GCR) 2010-2011 (WEF, 2010) and will be further defined in more detail (see Table 3).
The reasons why we believe that the proposed indicators can be used to analyse the African countries are the following: first, the African Science Technology and Innovation Indicator Initiative has decided to follow the definitions laid down in the sixth edition of the Frascati Manual. The African Science Technology and Innovation Indicator Initiative programme forms part of Africa's Science and Technology Consolidated Plan of Action which, among other things, aims to build the human and institutional capacities needed to produce common internationally comparable indicators as tools for ongoing survey of research and innovation at national levels. Secondly, at the first Intergovernmental Meeting on Science, Technology and Innovation Indicators, in Maputo in 2007, a decision was taken to adopt both the Oslo Manual and the Frascati Manual (OECD, 2002) for use in measuring innovation in Africa. This fits with the definition of technological innovation on which this work is based (see note 2). It should be also pointed out that the indicators used in the African Innovation Outlook 2010 (AU-NEPAD, 2010) (namely, Gross domestic expenditure on R&D activities, R&D personnel and researches, Qualifications of researchers and support staff, Science background of the researchers, Bibliometric analysis of scientific output and Patents) are very similar to the ones that we consider.
It is important to point out that the WEF indicators come from two sources: part of the data comes from different institutions (published data) and the rest comes from the Executive Opinion Survey (survey data); in order to see a critical review of the WEF methodology, see Lall, (2001). The Executive Opinion Survey is a panel comprised of executives and experts that provide an assessment (on a scale from 0 to 7) about general aspects affecting the competitive environment of an economic system for which official data are not available. The World Economic Forum conducts the Executive Opinion Survey in each of the countries analysed, following a detailed sample guideline to ensure greater data accuracy. A dual stratification is performed based on the size of the company and the sector of activity. Also, the surveys should include some new respondents each year and also repeated respondents, to allow for comparative analysis from year to year.
The surveys are obtained by mail, telephone, online or in interviews. The average number of respondents by country is around 90. Table 8 in the Appendix A, shows the number of respondents obtained for each of the 30 African countries included in this paper.
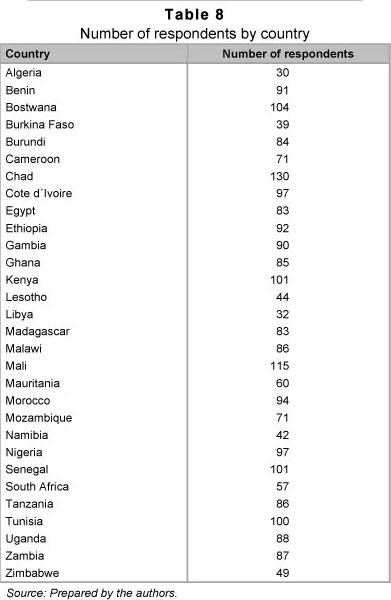
Likewise, it is advisable to stress the availability of the data and reliability of the source, as the Global Competitiveness Report is continuously updated and improved every year.
As we have seen, the technological innovation capability reflects a heterogeneous phenomenon that mainly relates to the infra-structures that give support to industrial production and to innovation activities, human capital education and the ability of nations to create, imitate and manage a complex stock of advanced technological knowledge (Castellaci & Archibugi, 2008). As can be observed in Table 2, the Technology Index (Tech), the Technological Readiness Index (TechRead) and the Technological Innovation Index (TechInnov) from the World Economic Forum (WEF) contemplate a series of indicators directly related to these aspects (generation, transmission and diffusion of technological innovation), matters that have been widely studied in the literature, both from a theoretical and empirical point of view (Pietrobelli, 1994).
We now define each of the specific indicators used in the empirical analysis of our work, grouped according to the dimension on which they provide information.
Lastly, we should point out that the choice of indicators allows us to simultaneously consider measures of input and output. This is particularly suitable because, while the input measures contemplate mainly the effort dedicated to R&D, the output measures look at the efficiency which that effort comes to producing new knowledge (Sancho Lozano, 2002).
3 Methodology: identification of variables and factor analysis
In order to carry out the statistical analysis of this work we have proceeded as follows: first a review of the descriptive statistics of all variables has been conducted. Secondly, a factor analysis of data on 15 indicators and 30 countries for the period 2010-2011 has been done. Then, with the obtained results the clusters analysis has been developed, and finally, a test of validity of the used cluster methodology has been conducted.
3.1 Review of descriptive statistics
First of all, as noted in the previous section, the observations used in the World Economic Forum's database that have been used in this study as indicators of technological innovation come from two sources: surveys and published data.
The variables obtained through the Executive Opinion Survey that the World Economic Forum conducts to executives and opinion leaders in each of the countries included in the analysis, have values between 1 and 7. The variables whose observations are obtained through published data have more scattered value. To make them comparable with the survey's variables, a normalisation process has been performed, by the following formula:
6 x (country's data - sample's minimum)/ (sample's maximum- sample's minimum) + 1
The sample's maximums and minimums are the minimum and maximum within the group of countries included in the analysis. By normalising like this, the variables obtained through published data fall likewise within the range of 1 to 7.
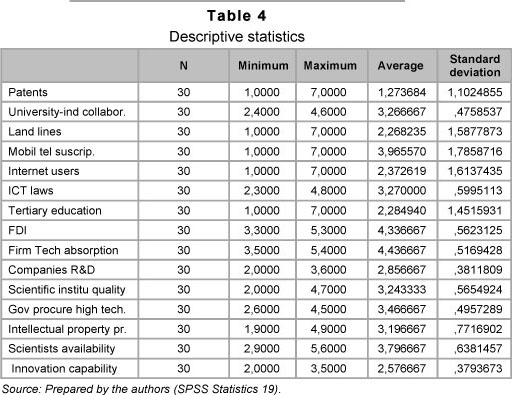
Thus, in this section the basic statistics for each of the main variables have been analysed, including minimum and maximum values, means and standard deviations for the period 2010-2011.
Table 4 shows the descriptive statistics of the variables. A wide spread among the minimums, averages and maximums can be observed. 'Patents', 'Land lines', 'Tertiary education' and 'Mobil telephone subscriptions' are the variables widest spread values (minimum of 1 and a maximum of 7). These are also the only four variables that have a minimum of 1 and a maximum of 7. Finally, notice that both the average and standard deviation of these statistics are significantly different among the others.
3.2 Factor analysis
Before beginning our empirical study, it is convenient to reduce the set of indicators to a smaller number of dimensions. To do this, a factor analysis has been performed, in order to identify the explanatory variables that best analyse the distribution of technological innovation among countries, that is, those that best discriminate the technological level among them.
The purpose of factor analysis is therefore to extract a smaller number of factors that explain most of the sample's variance. Factor analysis is a widely used and accepted technique in this kind of study (see for example: Adelman & Morris, 1965, 1967; Basilevsky, 1994; Temple & Jonson, 1998; and more recently Clarysse & Muldur, 2001; Brujin & Lagendijk, 2005; Castellaci & Archibugi, 2008; Dory, 2008 and Fagerberg & Srholec, 2008).
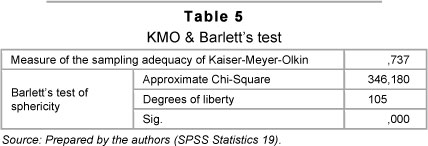
Before we perform the factor analysis, the viability to perform it for this set of data is studied, using the Kaiser-Meyer-Olkin (KMO)6 test and Barlett's test of sphericity7. (See Table 5).
The results of Bartlett's test of sphericity and the measure of sampling adequacy of Kaiser-Meyer-Olkin confirm the performed analysis is adequate as the KMO index is superior to 0,5 (Kaiser, 1974; Hair, Anderson, Tatham & Black, 1999), in particular the extent of sampling adequacy of Kaiser-Meyer-Olkin is 0,737 (see Table 5). Moreover, the Sig. Value is less than 0,05, which corroborates the result.
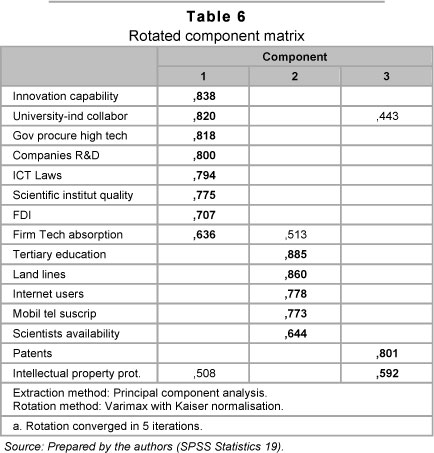
At the same time, Table 6 shows the results of the factor analysis for our database, namelys three main components that explain a high percentage of the sample's variance (74,47 per cent). This is significant at the usual levels, thus showing that these three factors represent most of the variability of the data.
Starting with the review of the literature and antecedents regarding the measurement of the technological innovation capability, in the second section of this study a set of indicators were selected (variables in the empirical part of the study) that are related with three dimensions (CEPAL, 2007): 1) the available base (infrastructure and human resources); 2) the realised efforts for the increase and consolidation of the technological innovation capability (governmental policy, R&D, knowledge acquisition, and others); and 3) the results obtained through the existing capabilities (patents).
Starting from the definition of these three dimensions, our interpretation of these three factors is as follows: factor 1 can be interpreted as a measure of Governmental and business technological effort. This component is related to what CEPAL (2007) names 'effort carried out for the increase and consolidation of technological innovation capability', observing that it has high factorial loads in all the variables that measure governmental technology effort (Acquisition from the government of high-tech products, Laws related with ICT, Quality of institutions of scientific research); those that measure the innovation activities in business (Capacity of absorption, Companies that invest in R&D, Collaboration university-company); and those that are related with the acquisition of external knowledge (Absorption of technology, Foreign Direct Investment and technology transferences). This factor is a combination of these variables and accounts for 35,75 per cent of the variance of the sample, which implies that is a very relevant dimension to analyse the differences in the technological innovation capabilities among countries.
Factor 2 can be interpreted as a measure of the Available base (CEPAL, 2007), as it groups variables that are related with the technological infrastructures and human capital (available capabilities in the country). As we can observe, this component has very high factorial loads in all the variables that measure the technological infrastructures (Fixed telephone lines, Mobil telephones subscriptions, Internet users), as well as those variables related with the human capital (Tertiary education, Availability of scientists and engineers). This factor shows that the technological infrastructures and human capital are highly correlated with the level of technological innovation of the countries and account for 25,15 per cent of the variance of the sample.
Factor 3 can be interpreted as a measure of results, as it groups two variables, which are the Protection of intellectual property and Patents, which is a variable that usually measures the results of the effort in innovation. Both account for 13,6 per cent percent of the sample. Therefore, it is worth mentioning that, along with factors 1 and 2, it seems to be an important measure to study the differences between countries in their technological innovation capabilities.
The component matrix with the factor analysis result can be found below.
4 Technological groups
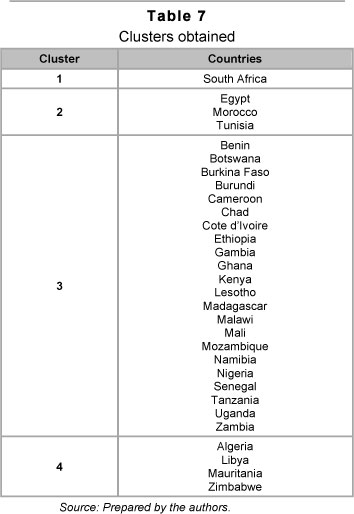
This section presents the results of a cluster analysisba8 that divides the African countries into 4 groups or clusters, characterised by different levels of technological innovation in the period 2010-2011. We have restricted the cluster analysis to four groups because in that way, all observations are closer to the centroid than with 3 or 5 groups. Also, as the ANOVA test in Appendix B shows, with four groups we achieve an analysis in which there are significant differences among the groups, while maintaining homogeneous conditions within each group. The countries that make up each of these groups can be seen below, in Table 7.
Cluster 1: (High score at Technology effort, medium-high at Available base, and very high score at Intellectual property and innovation results).
This group is only formed by South Africa,9 which is clearly the one with a better performance, particularly in terms of Intellectual property and results of innovation. This makes difficult an association with other countries in the sample, and thus cluster 1 contains only one observation belonging to South Africa. On the other hand, cluster 2, formed by Tunisia, Morocco and Egypt, performs better in terms of Available base.
South Africa's GDP per capita in 2010 was $10,498 thus being clearly superior to the average of the other clusters.
Cluster 2: (Medium-high at Technology effort, high score at Available base, and low at Intellectual property and innovation results)
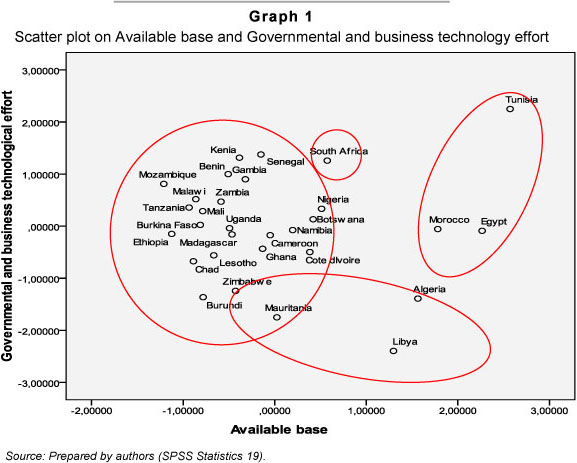
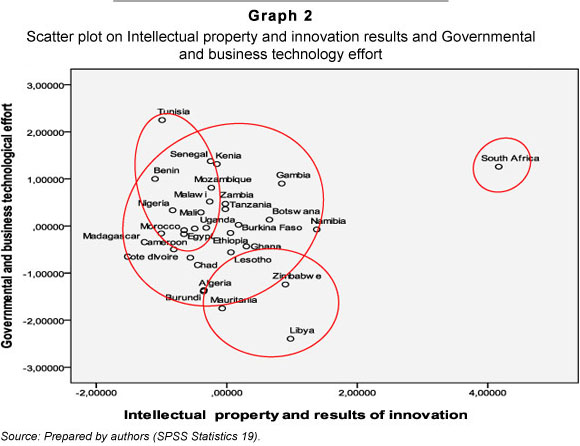
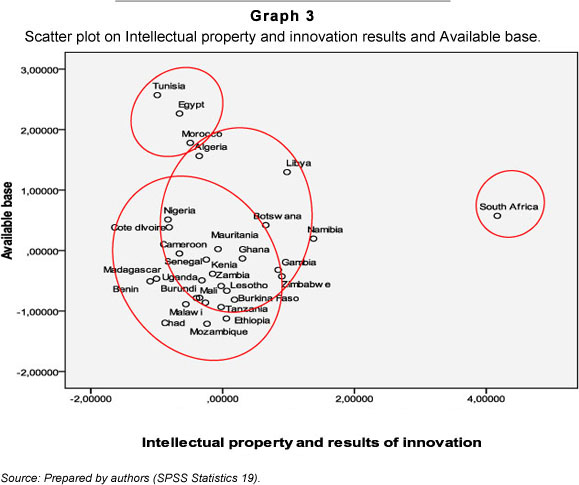
This group is formed by Tunisia, Morocco and Egypt. While these three countries do not outperform the others in terms of the measure of Governmental and business technology effort, they do have a clearly advanced position in terms of Available base, as it can be observed in Graph 1 and Graph 3. It is also worth noting a high variation in results regarding Governmental and business technology effort within the group, Tunisia clearly being above Morocco and Libya. Regarding the Intellectual property and innovation results, there is not a clear difference with cluster 3, as can be observed in Graph 2. Moreover, these three countries obtain a low score in this factor.
The average GDP per capita of the countries belonging to each cluster is used as a guidance indicator of economic development. In this case cluster 2's GDP per capita in 2010 was: $6863,667.
Cluster 3: (Medium score at Technology effort, medium-low at Available base and medium-low at Intellectual property and innovation results)
This group is formed by the majority of the countries in the study: Benin, Botswana, Burkina Faso, Burundi, Cameroon, Chad, Cote d'Ivoire, Ethiopia, Gambia, Ghana, Kenya, Lesotho, Madagascar, Malawi, Mali, Mozambique, Namibia, Nigeria, Senegal, Tanzania, Uganda and Zambia.
There is a significant difference between this cluster and cluster 2 in terms of Available base, whereas it obtains a similar although slightly lower position in Governmental and business technology effort.
With regard to Intellectual Property and innovation results, the cluster has an inter- mediate position between clusters 2 and 4.
This cluster has by far the lowest level of GDP per capita out of the clusters analyzed with $2370.909.
Cluster 4: (Low score at Technology effort, medium-high at Available base and medium at Intellectual property and innovation results)
This group is formed by Algeria, Libya, Mauritania and Zimbabwe. It has the lowest score on Governmental and business technology effort, while obtaining an average result in Intellectual property and innovation. In terms of Available base, the cluster appears quite disaggregated, some of the countries such as Algeria and Libya being at much higher positions than others such as Mauritania and Zimbabwe, as can be seen in Graph 1.
The average GDP per capita for the countries belonging to this cluster was $5820.5 in 2010, being at a great distance from South Africa's (almost 50 per cent less).
The clusters defined can be observed more clearly in graphs 1, 2 and 3 that show all countries ordered by their scores on each of the three factors.
5 Conclusions and policy recommendations
This paper provides empirical research on the differences between 30 African countries in terms of their technological innovation capabilities. The results show the existence of 4 groups of countries or clusters, clearly characterized by different levels of technological innovation. The technological innovation distance among these groups is clear with regards to the three factors considered in the study, which are the Governmental and business technology effort, the Technological infrastructure and human capital (Available base) and the Intellectual property protection and innovation results.
Cluster 1, only including South Africa, enjoys the most advanced position, clearly outstanding in terms of Intellectual property protection and innovation results, these being a result of innovation achievement. The group also has an advanced position in terms of Governmental and business technology effort, thus it indicates the efficiency of these policies to generate results measured in terms of patents, included in Factor 3. The group has, however, an intermediate position with regard to Available base when compared with some countries of cluster 2, such as Tunisia.
Cluster 2, formed by Tunisia, Morocco and Egypt, enjoys the most advanced position in terms of Available base, as has been mentioned, but shows a backward position with regard to Intellectual property protection and innovation results, indicating a low correlation between the availability of resources in these countries (technological infrastructure) and the innovation results (patents). In terms of Governmental and business technology effort, the group has an intermediate to high position, driven by Tunisia, with a high score on this factor.
Cluster 3, including 22 countries, has an intermediate position compared with the other clusters in general terms.
Finally, cluster 4, including Algeria, Zimbabwe, Mauritania and Libya, has the most backward position especially on Governmental and business technological effort and Intellectual property protection and Innovation results. The group has an intermediate position in terms of Available base, driven by Libya and Algeria.
Consequently, the main policy implication derived from the analysis is the uneven distribution of the technological innovation capability of the observed clusters. The combination of three factors of technological innovation capability (Governmental and business technological effort; Available base (Technological infrastructure and human capital); and Intellectual property protection and patents) plays an important role when positioning each national innovation system (Castrelacci & Archibugi, 2008). Each country should not only observe and try to imitate those that are in a more advanced position or cluster, but also follow their own path of innovation capability improvement.
We now introduce a more detailed explana-on of possible innovation policies for each group identified in the empirical analysis: with regard to the countries included in clusters 3 and 4, they are in the worst positions in technological innovation, and therefore they need a clear innovation policy. With the objective of reducing their technological difference they could foster their investment in R&D, as a stronger public and private investment capability in R&D could help the industry to develop its interests in research (Clarysse & Muldur, 2001). Likewise, new ways of financing and specific initiatives designed to increase the entrepreneur culture and innovation in SMEs could also be part of an innovation policy (Chabbal, 1995).
The countries integrated in cluster 3 also need an additional effort to improve the Technological infrastructure and the education of human capital, as they have very low capability to absorb knowledge.
South Africa from cluster 1 and Tunisia from cluster 2 are the better positioned countries in technological innovation in Africa. These countries must pay particular attention to the development of strategies that foster the creation and diffusion of knowledge. For this, they could improve the quality of the research institutions, encourage the collaboration between universities and companies and improve the laws related with information and communications technology, making the interaction among all the agents in the innovation system easier and promoting the collaboration with other international agents to help them create new knowledge (Clarysse & Muldur, 2001).
As a final conclusion we can state that cluster 1, formed only by South Africa, is the most advanced. In this sense, well positioned countries should try to internationalise their innovation systems and attract new talent, making the creation and diffusion of first-class knowledge easier (Navarro et al., 2009). This group could represent a reference point for less advanced groups in order to identify innovation policies that could help them migrate to a superior cluster.
On the other hand, our study may be useful in the following fields: firstly, in the academic, as the innovation indicators can be used to extend and widen our knowledge about technological change. Secondly, in the political, as governors need to localise the position of their country to identify strengths and weaknesses, to ensure opportunities and evaluate the effectiveness of the adopted policies (Furman et al., 2002). In third place, business leaders and executives use innovation studies to have a deeper understanding about technological advance, especially in times of great internal and international rivalry. In fact, data about technological capabilities in different countries make it possible to understand the geographical context in which companies can develop and establish their innovation activities, something which is crucial to the success of the innovation based strategies (Archibugi et al, 2009).
Despite the contributions of this empirical study, it is necessary to point out its limitations. There is no doubt that the literature on technological change needs to keep on going to find better measuring instruments. In this sense, the indicators mentioned in this work could be strengthened by using triangulation methods such as the use of synthetic indexes or by combining with other indicators developed by other bodies or institutions.
On the other hand, our research has concentrated in a unit of analysis that is the country, and although we have observed there are good reasons for doing so, we are aware that in a globalised world, countries are not the only significant entity to study technological change. The regions or companies are equally important to study the technological skills, and can therefore be considered as very interesting statistical units (Cantwell & Iammarino, 2003; Archibugi & Coco, 2005).
We finally propose the following research lines: a first area of research might consider a longer period of time and thus analyse the evolution of the groups and whether they move from one cluster to another. A second research area might be the study of the correlation between input and output factors, analysing whether correlation increases over time and which countries are more efficient and fast in innovation generation and diffusion. A third line of research could consist in analysing how the technological capability is related with the level of economic development. In this sense, even though we have taken the average GDP per capita as indicative data, observing an overlap among the clusters obtained and each group's average GDP, this aspect could be subject to an empirical contrast.
Endnotes
1 OECD defines technology as a 'set of indicators, abilities, routines, competences, equipments and engineering practices that are needed to produce a product or service'. To see a discussion, see Metcalfe (2010).
2 When in this paper we use the term 'innovation', we always refer to 'technological innovation'. Oslo's Manual (OECD, 2006) establishes four kinds of innovation: 'product, process, commercial and of organization. Product and process innovation are closely linked to the concept of technological innovation'. Frascati's Manual (OECD, 2002) defines technological innovation as 'the set of scientific, technological, organizational, financial and commercial stages, including the investments in new knowledge, that lead to or try to lead to the implementation of products and new or improved processes'.
3 In this paper we will talk interchangeably of 'cluster', 'groups' or 'conglomerates', always referring them to the different 'groups of countries' that result of carrying out the Clusters Analysis, as explained below in the Methodology section of this work.
4 The Growth Competitiveness Index (GroCI) published in GCR was developed to analyse the growing potential of an economic system in the medium term, through the evaluation of their macroeconomic competitive factors. This index comprises three pillars and each of these reflects a critical element of the economic growth process of a national economic system. These are: 1) Macroeconomic scenario quality, 2) Robustness of public institutions and 3) Technological innovation capabilities. Each of these pillars is associated with a sub-indicator. We will focus in the Technology Index (Tech), as it is GroCI's sub-indicator related to technological capabilities (Archibugui et al., 2009).
5 The Global Competitiveness Index (GloCI) was first published in the Global Competitiveness Report (GCR) 2004-2005 and it's an indicator developed by the WEF to evaluate the competitive capability of economic systems, both for developed and developing countries, its main objective being to synthesise in only one indicator both the economic drivers of productivity and the microeconomic components of the growth capabilities. For this purpose, it considers a series of grouped variables in pillars which reflect different aspects of the economic system. Each pillar considers variables from surveys and from published data. The GloCI of the GCR 2009-2010 comprises twelve categories, among them only nine and twelve have been considered, the ones that correspond with the TechRead and Techlnnov (Archibugui et al., 2009).
6 KMO's index, developed by Kaiser (1974), is used to compare the magnitudes of the multiple correlation coefficients observed with the magnitudes of the partial correlation coefficients. When the index's value is lower than 0.5, it is not advised to apply the analysis, as correlations between pairs of variables cannot be explained through other variables. The nearer the KMO index is to one, the more adequate is the use of factor analysis.
7 Barlett's test of sphericity confirms whether variables are related by setting the hypothesis that the correlation matrix equals the identity matrix (that has one on the main diagonal and zero in the rest of the values). If this hypothesis is confirmed, then variables are uncorrelated. If the hypothesis is rejected, variables would be related and it would be appropriate to conduct the factorial analysis.
8 A cluster analysis is a multivariate statistical analysis technique that allows the split of a set of data (in this case corresponding to different countries) into groups, in such a way that the data related to a group are very similar among them but very different from the other groups (Hair et al. 1999; Everitt, Landau & Leese, 2001). This kind of analysis has been performed by different authors (Johnson, 1967; Jardine & Sibson, 1968; Rohlf, 1970; Lerman, 1970; Benzecri; 1976; Clarysse & Muldur, 2001; Brujn & Landerdijk, 2005; Castellacy & Archibugui, 2008; Dory, 2008). To be able to form homogeneous groups of observations (in this case of countries), their distance or similarity has to be measured. In this respect, several methods have been developed. In this case, the Euclidean distance will be used.
9 In this respect, it is important to remark that Hair et al. (1999) establish the possibility that a cluster is constituted by only one observation.
Acknowledgements
The authors would like to thank the Spanish Ministry of Science and Innovation for the financial support given to this research project under contract: NATIONAL PLAN I+D+i 2008-2011 - Sub Project of Fundamental Research REFERENCE: ECO2010-19787 (sub project ECON).
References
ABRAMOVITZ, M. 1986. Catching up, forging ahead, and falling behind. Journal of Economic History, 46:385-406. [ Links ]
ADELMAN I. & MORRIS, C.T. 1965. A factor analysis of the interrelationship between social and political variables and per capita gross national product. Quarterly Journal of Economics, 79:555-578. [ Links ]
ADELMAN, I. & MORRIS, C.T. 1967. Society, politics and economic development. Baltimore: The John Hopkins Press. [ Links ]
AGHION, P. & HOWITT, P. 1992. A model of growth through creative destruction. Econometrica, 60: 323-351. [ Links ]
ARCHIBUGI, D. & COCO, A. 2004. A new indicator of technological capabilities for developed and developing countries. World Development, 32(4):629-654. [ Links ]
ARCHIBUGI, D. & COCO, A. 2005. Measuring technological capabilities at the country level: a survey and a menu for choice. Research Policy, 34(2):75-194. [ Links ]
ARCHIBUGUI, D., DENNI, M. & FILIPPETTI, A. 2009. The technological capabilities of nations: The state of the art synthetic indicators. Technological Forecasting & Social Change, 76:917-931. [ Links ]
ARCHIBUGUI, D. & IAMMARINO, S. 2002. The globalization of technological innovation: definition and evidence. Review of International Political Economy, 9(1):98-122. [ Links ]
AU-NEPAD. 2010. African Innovation Outlook 2010. Pretoria: AU-NEPAD. [ Links ]
BASILEVSKY, A. 1994. Statistical factor analysis and related methods: theory and applications. Londres: John Wiley & Sons Inc. [ Links ]
BELL, M. & PAVITT, K. 1995. The development of technological capabilities, In I.U. Haque (ed.) Trade, Technology and International Competitiveness, World Bank, Whasington, 69-101. [ Links ]
BENZECRI, J.P. 1976. Analyse des données. Paris: Dunod. [ Links ]
BRUJIN, P. & LAGENDIJK, A. 2005. Regional innovation systems in the Lisbon strategy. European Planning Studies, 13:1153-1172. [ Links ]
CANTWELL, J. & IAMMARINO, S. 2003. Multinational corporations and European regional systems of innovation. London: Routledge. [ Links ]
CASTELLACI, F. & ARCHIBUGI, D. 2008. The technology clubs: The distribution of knowledge across nations. Research Policy, 37:1659-1673. [ Links ]
CEPAL. 2007. Serie estudios y perspectivas. Indicadores de capacidades tecnológicas en América Latina. Mexico: United Nations. [ Links ]
CHABBAL, R. 1995. Unplan d'actionpour lesPME innovantes. European Business and Innovation Centre Network (EBN), EC-BIC Observatory. [ Links ]
CLARYSSE, B. & MULDUR, U. 2001. Regional cohesion in Europe? An analysis of how EU public RTD support influences the techno-economic regional landscape. Research Policy, 30:275-296. [ Links ]
COHEN, W.M. & LEVINTHAL, D.A. 1989. Innovation and learning: The two faces of R&D. The Economic Journal, 99(397):569-596. [ Links ]
COHEN, W.M. & LEVINTHAL, D.A. 1990. Absorptive capacity: a new perspective on learning and innovation. Administrative Science Quarterly, 35:128-152. [ Links ]
COMISIÓN EUROPEA. 2007. Global innovation scoreboard 2006 Report, CE. Brussels. [ Links ]
CRISCUOLO, P. & NARULA, R. 2008. A novel approach to national technological accumulation and absorptive capacity: aggregating Cohen & Levinthal. The European Journal of Development Research, 20(1): 56-73. [ Links ]
DAHLMAN, C. & NELSON, R. 1995. Social absorption capability, national innovation systems and economic development, in Social capability and long-term growth (eds.) D.H. Perkins & B.H. Koo, Basingstoke: Macmillan Press. [ Links ]
DORY, T. 2008. RTD policy approaches in different types of European regions. Luxembourg: Office for Official Publications of the European Communities. [ Links ]
DOSI, G., FREEMAN, C., NELSON, R. & SOETE, L. 1988. Technical change and economic theory. London: Pinter Publishers. [ Links ]
EDQUIST, C. 1997. Systems of innovation: technologies, institutions and organizations, Pinter, London. [ Links ]
EDQUIST, C. 2004. Systems of innovation: perspectives and challenges. In J. Fagerberg, J., Mowery, D. & Nelson, R. (eds.) The Oxford handbook of innovation pp 181-208. Oxford: Oxford University Press. [ Links ]
EVERITT, B., LANDAU, S. & LEESE, M. 2001. Cluster analysis. London: Arnold (4th ed. [ Links ]) FAGERBERG, J. 1987. A technology gap approach to why growth rates differ. Research Policy, 16:87-99. [ Links ]
FAGERBERG, J. 1994. Technology and international differences in growth rates. Journal of Economic Literature, 32:1147-1175. [ Links ]
FAGERBERG, J. & GODINHO, M.M. 2004. Innovation and catching-up. In Fagerberg, J., Mowery, D. & NELSON, R. (eds.) The Oxford handbook of innovation (514-544). Oxford: Oxford University Press. [ Links ]
FAGERBERG, J. & SRHOLEC, M. 2008. National innovation systems, capabilities and economic development. Research Policy, 37:1417-1435. [ Links ]
FILIPETTI, A. & PEYRACHE, A. 2011. The patterns of technological capabilities of countries: A dual approach using composite indicators and data analysis. World Development. (In press). [ Links ]
FREEMAN, C., CLARK, J. & SOETE, L.G. 1982. Unemployment and technical innovation: a study of long waves and economic development. Pinter, London. [ Links ]
FREEMAN, C. 1987. Technology policy and economic performance: lessons from Japan. Pinter, LONDON. [ Links ] FREEMAN, C. 1997. The national system of innovation. In Archibugui & J. Michie (eds.) Technology, globalisation and economic performance, pp 24-49. Cambridge: Cambridge University Press. [ Links ]
FURMAN, J.L., PORTER, M. & STERN, S. 2002. The determinants of national innovative capacity. Research Policy, 31:899-933. [ Links ]
GERSCHENKRON, A. 1962. Economic backwardness in historical perspective. Cambridge, MA: The Belknap Press. [ Links ]
GODINHO, M.M., MENDOCA, S.F. & PEREIRA, T.S. 2005. Towards a taxonomy of innovation systems. Lisbon: Mimeo. [ Links ]
GROSSMAN, G. & HELPMAN, E. 1993. Innovation and growth in the global economy. Cambridge: The MIT press. [ Links ]
GRUPP, H. & SCHUBERT, T. 2010. Review and new evidence on composite innovation indicators for evaluating national performance. Research Policy, 39:67-78. [ Links ]
HAIR, J.F., ANDERSON, R.E, TATHAM, R.L. & BLACK, W.C. 1999. Análisis multivariante. Madrid: Prentice Hall. [ Links ]
JARDINE, N. & SIBSON, R. 1968. A model for taxonomy. Mathematical Biosciences, 2:465-482. [ Links ]
JOHNSON, S.C. 1967. Hierarchical clustering schemes. Psychometrika, 32:241-255. [ Links ]
JUMA, C., FANG, K., HONCA, D., HUETE-PÉREZ, J., KONDE, V. & LEE, S. 2001. Global governance of technology: meeting the needs of developing countries. International Journal of Technology Management, 22(7-8):629-655. [ Links ]
KAISER, H.F. 1974. An index of factorial simplicity. Psychometrika, 39:31-36. [ Links ]
KEMENY, T. 2009. Are international technology gaps growing or shrinking in the age of globalization. Journal of Economic Geography. Doi: 10.1093/jeg/lbp062. [ Links ]
KIM, L. 1980. Stages of development of industrial technology in a developing country. A model. Research Policy, 9:254-277. [ Links ]
KIM, L. 1997. Imitation to innovation: the dynamics of Korea's technological learning.. Harvard Business School Press. [ Links ]
LALL, S. 1992. Technological capabilities and industrialization. World Development, 20:165-186. [ Links ]
LALL, S. 2001. Competitiveness, technology and skills. Edward Elgar Inc: Cheltenham. [ Links ]
LALL, S. & PIETROBELLI, C. 2005. National technology systems in sub-Saharan Africa. International Journal of Technology and Globalisation, 1(34):311-342. [ Links ]
LEE, K. & KIM, B. 2009. Both institutions and policies matter but differently for different income groups of countries: determinants of long-run economic growth revisited. World Development, 37(3):533-549. [ Links ]
LERMAN, I.C. 1970. Les bases de la classification automatique. Paris: Gauthier-Villars. [ Links ]
LUNDVALL, B.A. 1992. National systems of innovation: towards a theory of innovation and interactive learning. London: Pinter Publishers. [ Links ]
LUCAS, R. 1988. On the mechanism of economic development. Journal of Monetary Economics, 22:3-42. [ Links ]
METACALFE, J.S. 2010. Technology and economic theory. Cambridge Economic Journal, 34(1):153-171. [ Links ]
MUGABE, J. 2006. Regionalism and science and technology development in Africa. In Box, L. & and Engerlhard, R.eds., Science and Technology Policy for Development Dialogues at the Interface. London: Anthem Press. [ Links ]
MUGABE, J.O. 2011. Science, technology and innovation in Africa's regional integration: From rhetoric to practice. ACODE Policy Research Series, 44:1-34. [ Links ]
NAVARRO, M., GIBAJA, J.J., BILBAO-OSORIO. & AGUADO, R. 2009. Patterns of innovation in EU-25 regions: a typology and policy recommendations. Environment and Planning C: Government and Policy, 27:815-840. [ Links ]
NELSON, R. 1993. National innovations systems: a comparative analysis. New York: Oxford University Press. [ Links ]
OECD 2002. Manual de Frascati: propuesta de norma práctica para encuestas de investigación y desarrollo experimental. OECD. [ Links ]
OECD 2006. Manual de Oslo: Guíapara la recogida e interpretación de datos sobre innovación, (3rd ed.) Madrid: Tragsa. [ Links ]
OECD 2007: Science, technology and innovation indicators in a changing world. Paris. [ Links ]
OECD. PATEL, P. & PAVITT, K., 1995. Their measurement and interpretation. In Stoneman, P. (ed.) Handbook of economics of innovation and technological change pp. 15-51). Oxford: Blackwell Handbooks in Economics. [ Links ]
PIETROBELLI, C. 1994. National technological capabilities: an internal comparison. Development Policy Review, 12(2):115-148. [ Links ]
ROHLF, F.J. 1970. Adaptive hierarchical clustering schemes. Systematic zool, 19:58-82. [ Links ]
ROMER, P.M. 1990. Endogenous technological change. Journal of political Economy, 98:71-102. [ Links ]
SANCHO LOZANO, R. 2002. Indicadores de los sistemas de ciencia, tecnologia e innovación, Economía Industrial, 343:97-109. [ Links ]
SCHUMPETER, J. 1934. The theory of economic development. Cambridge, Mass: Harvard University Press. [ Links ]
SCHUMPETER, J. 1943. Capitalism, socialism and democracy. Harper & Brothers: Nueva York. Se cita la traducción al espanol: Capitalismo, Socialismo y Democracia. Ed. Folio, Barcelona, 1984. [ Links ]
SHARIF, N. 2006. Emergence and development of the national innovation system. Research Policy, 35:745766. [ Links ]
SIRILLI, G. 1997. Science and technology indicators. The state of the art and prospects for the future, En G. Antonelli, N. De Liso (eds.) Economics of structural and technological change, London: Routledge. [ Links ]
SMITH, K. 2005. Measuring innovation, In: J. Fagerberg, D. Mowery, R. Nelson (eds.) The Oxford Handbook of Innovation. Oxford: Oxford University Press. [ Links ]
SOLOW, R.M. 1956. A contribution to the theory of economic growth. Quarterly Journal of Economics, 70:65-94. [ Links ]
SUTZ, J. 1997. Innovation y desarrollo en America Latina. Caracas: Nueva Sociedad. [ Links ]
TEMPLE, J. & JOHNSON, P.A. 1998. Social capability and economic growth. Quarterly Journal of Economics, 113:965-990. [ Links ]
UNCTAD. 2005. World investment report, transnational corporations and the internationalization of R&D, UNCTAD, Geneva. [ Links ]
UNIDO (United Nations Industrial Development Organization) 2005. Industrial Development Report 20052006. Competing through innovation and learning, UNIDO. Vienna. [ Links ]
VERSPAGEN, B. 1991. A new empirical approach to catching up or falling behind. Structural Change and Economic Dynamics, 2(82):359-380. [ Links ]
WEF. 2004. The Global Competitiveness Report 2003-2004, Palgrave Macmillan, Houndmills. [ Links ]
WEF., 2006. The Global Competitiveness Report 2005-2006, Palgrave Macmillan, Houndmills. [ Links ]
WEF. 2009. The global competitiveness report 2009-2010, New York Oxford University Press. [ Links ]
WEF. 2010. The global competitiveness report 2010-2011, New York Oxford University Press. [ Links ]
WORLD BANK. 2006. World Development Indicators. The World Bank, Washington, DC. [ Links ]
Accepted: May 2012
Appendix A
Number of respondents by country
Appendix B
Econometric test validation of cluster analysis
We have conducted an econometric test in which we have performed an ANOVA, as well as post-hoc tests (Scheffe's, Student-Newman-Keuls, Tukey's HDS and Waller-Duncan) that will allow us to verify that the cluster analysis proposed is correct, being significant differences among the 4 groups considered.
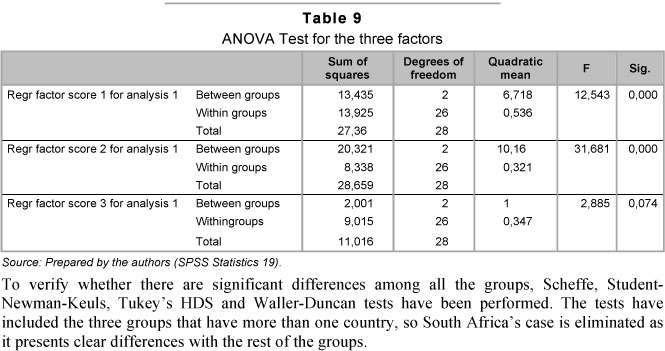
The results of the ANOVA test are shown below, in Table 9, and they confirm the validity of the analysis.
Table 10, shown above, contains the results of the post-hoc test conducted with Factor 1, the measure of Governmental and business technology effort, observing that group 4 (Algeria, Libya, Mauritania and Zimbabwe) have clear differences with groups 1 (Egypt, Morocco and Tunisia) and 2 (formed by 22 countries). However, groups 1 and 2 show no significant differences between them, which is also easily noticeable in the scatter plot (Graph 1).
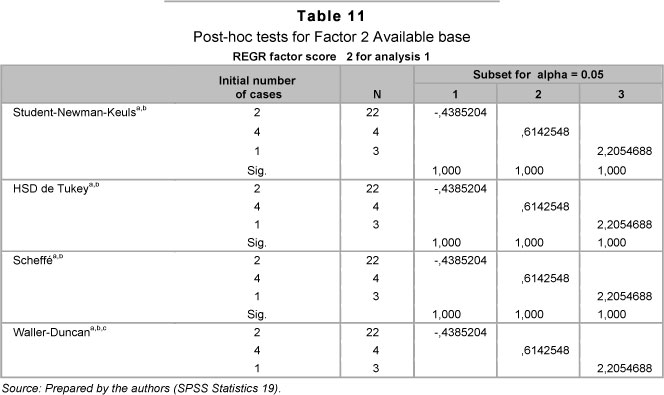
Regarding the groups obtained for Factor 2, the measure of the Available base, the tests of Student-Newman-Keuls, Tukey's HSD and Waller-Duncan show significant differences between the three groups, as can be seen in Table 11. These three groups are also easy to detect in both Graph 1 and Graph 3.
Regarding Factor 3, the measure of Intellectual property and innovation results, Table 12 shows that there are significant differences between groups 1 and 4, but group 2 presents similarities with both group 1 and group 4, as can also be observed in Graphs 2 and 3.
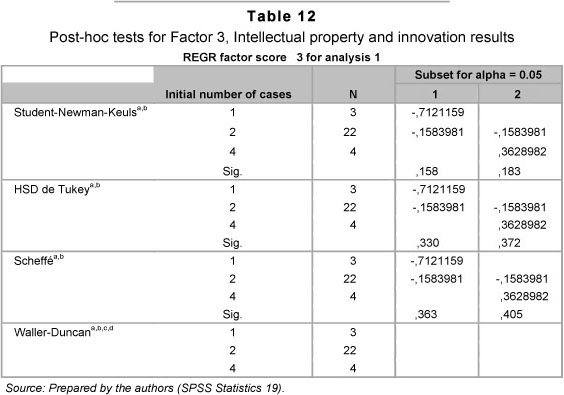
To conclude, post-hoc tests confirm the cluster analysis is correct and show significant differences in most of the cases among the groups considered, as can also be observed, both in the scatter plots and in the results of the ANOVA test, the factor of Intellectual Property and innovation results being the one that discriminates less.

