


Servicios Personalizados
Articulo
 Inglés (pdf)
 Articulo en XML
 Referencias del artículo
Indicadores

Links relacionados
-
 Citado por Google
 -
 Similares en Google
Compartir

 Permalink
South African Journal of Economic and Management Sciences
versión On-line ISSN 2222-3436
versión impresa ISSN 1015-8812
S. Afr. j. econ. manag. sci. vol.15 no.2 Pretoria ene. 2012
ARTICLES
Foreign direct investment to Africa: trends, dynamics and challenges
Elsabe LootsI; Alain KabundiII
IFaculty of Economic and Management Sciences, Potchefstroom Campus, North-West University
IIDepartment of Economics and Econometrics, University of Johannesburg
ABSTRACT
The FDI debate is often characterised by generalities about the importance of these flows within the global context. This article aims to unpack the African-specific FDI issues in order to get a clearer and more substantiated understanding of the current trends, dynamics and challenges, with emphasis on the period since 2000. The research concludes that nominal flows to the continent are on the increase, with exponential increases over the past decade. The descriptive analysis indicates that flows to the continent are unevenly spread and are concentrated in the largest economies and/or in petroleum-/oil-exporting countries. The impact of FDI on growth and investment in particularly smaller economies indicates that FDI inflows are making a substantial contribution to these economies and illustrates the importance of this source of investment. The econometric analysis reveals that oil exporters and the size of the economy are powerful explanatory variables in explaining FDI flows to Africa, with trade openness a positive, but less powerful variable.
Key words: Foreign direct investment, Africa
JEL: E22, F21, O16, 55
1 Introduction
The general notion exists that Africa has a large resource gap. This gap has been acknowledged within the context of the Nepad framework as well as within the context of the expectations of achieving the Millennium Development Goals. A growth rate of 7 per cent per annum is seen as a minimum requirement to reach these stated goals. Such a growth rate requires investment ratios to average 25 per cent of GDP over the long term. With the current savings rate in Africa averaging 9 per cent of GDP, the financing gap amounts to 16 per cent of GDP (Ndulu et al., 2007:26). Since African countries are not in a position to generate additional income to fill this gap, foreign savings through foreign direct investment (FDI), which could support other means of capital inflows would be required like official development assistance.
Since the late 1980s FDI worldwide has become a more significant source of capital. With the forces of globalisation since the second half of the 1990s becoming more widespread, world FDI flows have become even more pronounced. After a steady increase in total world FDI flows to the mid 1980s, exponential increase peaked in 2000 at levels of US$1 398 billion in inflows and US$1 231 billion in outflows. After the September 11 attacks on the World Trade Centre in 2001, world FDI flows contracted significantly for the next three years, before increasing again in 2004, and by 2007 record highs of US$2 100 billion in inflows and US$2 268 billion in outflows were recorded. The impact of the financial crises lead to an expected contraction in world flows in 2008, with inflows decreasing to US$1 771 billion and outflows to US$1 929 billion (UNCTAD, 2010). To put SAJEMS NS 15 (2012) No 2129 the magnitude of these flows into perspective, FDI world inflows/outflows exceeded the total GDP for the continent of Africa and are comparable to the size of the GDP of Italy.
The developed world is still the dominant player on the FDI scene. Approximately 67 per cent of world FDI flowed to developed countries during the 2000-2008 period, 3.6 per cent to transition economies and 29.4 per cent to developing countries (UNCTAD, 2010). Concerning FDI outflows over the past two to three decades, developing countries have started to intensify their participation as source countries. During the period 2000-2008, approximately 13 per cent on average of world FDI outflows originated from this group of countries in contrast to a mere 6 per cent in the 1980s. Despite the declining role of advanced economies, this group remains the major source of world FDI outflows, with a dominant contribution of 85 per cent on average to all world outflows since 2000 (UNCTAD, 2010).
Where does Africa fit into this picture? Is the continent sharing in the increase in flows worldwide? Who are the African beneficiaries of these flows? The objective of the article is to unpack the African-specific FDI issues during the period 2000-2008 in order to get a clearer and more substantiated understanding of the current trends, dynamics and challenges. Taking into account the voluminous research on the topic, the paper provides a literature overview of FDI in Africa, followed by an exploration of the general FDI trends to African countries. With reference to the dynamics of African FDI, the flows to the continent will be disaggregated in order to gain a better understanding of country directions and possible gains. The descriptive analysis is validated by econometric analysis in the form of a cross-section regression. In conclusion, the challenges of continued foreign investment and the impact of possible reversal in flows to the continent is addressed.
Literature overview
The literature on FDI flows to developing countries is vast, but the literature on Africa is still fairly limited, especially that which focuses on in-depth analyses of the determinants and dynamics of FDI flows. Apart from the annual overviews in UNCTAD's World Investment Reports, the empirical analysis on African FDI is still quite limited. The more recent and most significant studies and their results are those by Morisset (2000), Asiedu (2002, 2003 and 2004), Naudé and Krugell (2003), Akinkugbe (2005), Breslin and Samanta (2008), Rojid, Seetanah, Ramessur-Seenarain and Sannassee (2009) and Hailu (2010).
Morisset (as cited by Naudé & Krugell, 2003:5) finds that more FDI flows to countries with larger local markets and/or natural resources. She concludes that aggressive liberalisation, modern investment codes and strong economic growth are important prerequisites for increased flows of FDI to Africa.
Asiedu (2002) explores whether factors affecting FDI in developing countries have a different effect on countries in sub-Saharan Africa (SSA). In covering the period 19881997, she concludes that higher returns on investment and better infrastructure do not have a significant positive impact on SSA in comparison with other developing countries. Openness to trade promotes FDI, but the marginal benefits from increased trade are less than in other developing countries; and, lastly, Africa requires different FDI policies than other developing regions. Asiedu, in her 2003 publication, used panel data for 22 countries in sub-Saharan Africa over the period 1984-2000 to examine the impact of political risk, the institutional framework and government policy on FDI flows. She concluded that macro-economic stability, efficient institutions, political stability and a good regulatory framework have a positive effect on FDI on the continent. In her study, she also refers to several investor surveys that revealed that, firstly, factors that attract FDI to Africa are different from those that work in other regions, and, secondly, that the region is also structurally different from the rest of the world (Asiedu, 2003:4). Asiedu (2004), again, covering the period 1980-1999, concluded that despite the fact that Africa has reformed its institutions, improved its infrastructure and liberalised its FDI regulatory framework, the initiatives have been less significant than those implemented in other developing countries, making SSA less attractive for FDI inflows.
Naude and Krugell (2003) covered the period 1970-1990 in their cross-country analysis on whether institutions and geography matter as determinants of FDI in Africa. They concluded that geography does not have a direct influence on FDI flows to Africa. They used a number of specifications on policy instruments to demonstrate that neither market-seeking nor re-exporting motives for FDI seem to dominate. In critically reviewing the claims of earlier studies on the dominance of economic policies, they concluded that good policies are only significant if they are made by good institutions. As an institutional measure, political stability proved to be a significant determinant of FDI.
Akinkugbe (2005) included 53 African countries in his panel regression model, covering the period 1970-2000. His findings reveal that the drivers of the volume of investment flows to these countries are a combination of high per capita income, trade openness, level of infrastructural development and a high rate of return on investment, all of which are significant decision variables for potential investors.
Breslin and Samanta (2008) endeavoured to establish a relationship between corruption and FDI in 11 African countries, covering the period 1995-2004. No conclusive evidence was found that corruption has an effect on FDI inflows.
Rojid et al. (2009) analysed potential determinants of FDI for a sample of 20 African countries, covering the period 1990-2005. By applying a panel data fixed effects model, they conclude that abundance of natural resources, openness to trade, the size of the domestic market and the stock of human capital are positive in attracting FDI. They further conclude that political instability and labour costs have an inverse relationship with FDI.
Hailu (2010) applied a cross section fixed effect Least Squares Dummy Variable estimation technique to determine possible demand side effects of FDI inflows to 45 African countries. Covering the period 19802007, he concludes that natural resource endowment, labour quality, trade openness, market access and quality infrastructure have positive and significant effects on FDI inflows. He further concludes that when government expenditure and private domestic expenditure are added, the effects still remain positive, with an ultimate conclusion that African governments have a large pool of demand side policy instruments at their disposal to attract FDI.
These studies all differ in the periods covered, methods applied and variables includes. The majority of these analyses, with the exception of the research by Breslin and Samanta (2008), Rojid et al. (2009) and Hailu (2010) cover periods ending on or before 2000 and do not necessarily provide new insights into the more recent FDI dynamics on the continent. The econometric modelling for FDI in Africa is further complicated by the lack of data, reliability of data and the diversity of countries on the continent. In the majority of these studies, the level of statistically significant variables is questionable. The latter two studies provide more consistent positive empirical evidence that natural resource abundance, trade openness and market access/ size are significant determinants. However, despite the fact that the current research adds value, it remains a fact that modelling African FDI remains fairly complicated and challenging.
2 African FDI trends
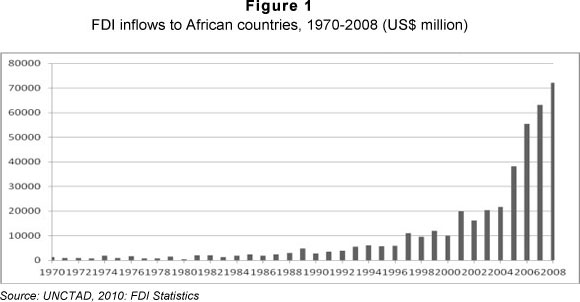
Within the context of the increase in world FDI flows, nominal flows to Africa exhibit an exponential increase over the past four decades - see Figure 1 below. During the 1970s, inflows to the continent averaged US$ 1.1 billion per year. The flows doubled to an average of US$2.2 billion in the 1980s and tripled to US$6.6 billion on average per year in the 1990s. From the 1990s the average flows augmented to US$35.2 billion on average per year during the 2000-2008 period. Record highs were recorded in 1997 (US$11 billion) and again in 2001 with US$20 billion. Since 2005, the momentum increased exponentially from US$38 billion to a high of US$72 billion in 20081. The increasing trend after 2007 was despite the global financial crises that affected the developed economies since late 2007.
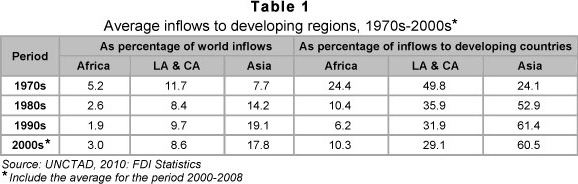
Notwithstanding the exponential increase in flows to the continent, its share as recipient in world FDI flows declined from 5.2 per cent during the 1970s to 1.9 per cent during the 1990s, before increasing to 3 per cent over the period 2000-2008 - see Table 1 below. A similar similar pattern is evident when assessing the continent's share as recipient within the group of developing countries. Tabel 1 also covers the distribution of inflows between the various major developing regions. Africa's share within the group has declined from a significant 24.1 per cent in the 1970s to an average of merely 6.2 per cent in the 1990s, before picking up again to an average of 10.3 per cent during the 2000-2008 period. Latin America and the Caribbean were the largest recipient regions in the 1970s. Depite the fact that the share of flows to this region has also declined, it still remains a popular destination with close to a third of all inflows to developing regions still going to Latin America and the Caribbean. The largest benefactor of FDI inflows in the developing world since the 1980s is the Asia and Pacific region, currently receiving on average 60.5 per cent of all flows to the developing world
Notwithstanding the exponential increase in flows to the continent, its share as recipient in world FDI flows declined from 5.2 per cent during the 1970s to 1.9 per cent during the 1990s, before increasing to 3 per cent over the period 2000-2008 - see Table 1 below. A similar pattern is evident when assessing the continent's share as recipient within the group of developing countries. Tabel 1 also covers the distribution of inflows between the various major developing regions. Africa's share within the group has declined from a significant 24.1 per cent in the 1970s to an average of merely 6.2 per cent in the 1990s, before picking up again to an average of 10.3 per cent during the 2000-2008 period. Latin America and the Caribbean were the largest recipient regions in the 1970s. Depite the fact that the share of flows to this region has also declined, it still remains a popular destination with close to a third of all inflows to developing regions still going to Latin America and the Caribbean. The largest benefactor of FDI inflows in the developing world since the 1980s is the Asia and Pacific region, currently receiving on average 60.5 per cent of all flows to the developing world.
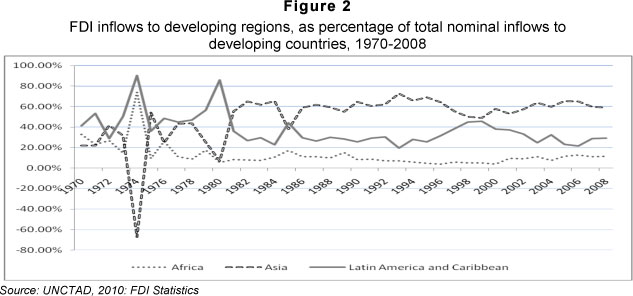
Figure 2 provides an interesting picture of the pattern of inflows to the three developing regions. Since 1970, flows to Latin American and Asia have formed a mirror image of one another, with flows to Africa being a mirror image of either one of these two regions at any particular time. This is an indication that foreign investors, within their pool of designated FDI funding, are continuously weighting their options between the two major developing regions, with Africa more or less taking the slipstream. One of many explanations for the pattern lies in the investment climate in the various regions. The investment climate, as measured by the ease of doing business-ranking, of Latin America and the Caribbean (87), and East Asia and the Pacific (77), does not differ substantially (IFC, 2008). This could imply that foreign investors consider the choice of business opportunities between these regions as being equal. However, the investment climate in sub-Saharan Africa stands at 136, which is far below those in the other developing regions, making the continent a riskier investment destination.
The booming of developing economies' involvement as countries of FDI origin, coincided with the increased participation of this group of countries in the global economy since the late 1980s. The more recent participation of the various developing regions as source countries indicates that the most active source region is Asia, responsible for 69.6 per cent of all FDI outflows from the developing world. Latin America and the Caribbean are responsible for 28.1 per cent of all developing country outflows. African countries contribute a mere 2.3 per cent to total developing country outflows. It is significant to note that China currently contributes 9.2 per cent to the developing country foreign investment pool, four times more than the total contribution from the African continent!
During the period 2000-2007, on average 38 per cent of all inflows to African countries were in the form of cross-border mergers and aquisitions (M&As), while the remaining 62 per cent were in the form of reinvested earning, greenfield investments or intra-company loans from parent firms (UNCTAD, 2002-2008). The greenfield investments are predominantly in the primary sector, and specifically in the mining and petroleum industries. This sector also dominates the cross-border M&A sales on the continent over the long term, although in specific years such as in 2005 and 2006, cross-border M&As in the services sector outstripped primary sector inflows. In the services sector, the largest investments are in the financial sector and in infrastructure projects in the areas of electricity, tele-communications and water (UNCTAD, 2008:43). The manufacturing sector on the continent lags behind the other two sectors. Notwithstanding investments in industries such as chemicals and pharmaceuticals, the automobile (in South Africa and Morocco), and textile and apparel (in Lesotho and Uganda), higher labour costs relative to those prevailing in Asia (Bangladesh and China) and other increases in costs of production are deterrents to foreign investors.
The nominal increase in FDI inflows to the continent coincided with a reversal in the declining economic growth trend since the mid-1990s. Where the average African GDP growth reached a low of 1.3 per cent on average during the period 1990-1994, it began to turn around and increased to 3.7 per cent in 1995-1999, 4.1 per cent in 2000-2004 and 5.6 per cent on average during the period 20052008. This culminates in a significant improvement in FDI as percentage of GDP since the mid-1970s (see Figure 3). After reaching a low of 0.4 per cent on average during the late 1970s and 1980s, FDI as percentage of GDP improved continuously since the mid-1990s to reach an average level of 2.2 per cent after 2000, demonstrating a more pronounced role for FDI on the continent.
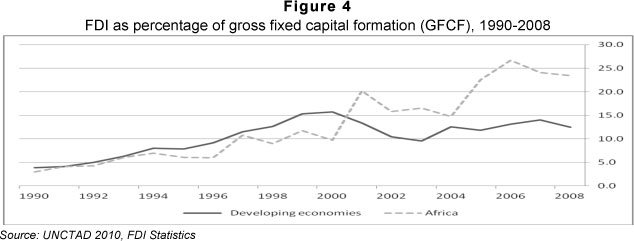
A similar pattern to the FDI/GDP ratio is evident in the FDI/GFCF ratio - see Figure 4. The average ratio for African countries underperformed in comparison with the average ratio for developing countries until 2000, after which it consistently outperformed GFCF ratios in the developing world. The African FDI/GFCF ratio reached a high of 26.7 per cent in 2006, and declined marginally to 23.4 per cent in 2008. The decline could be ascribed to sustainable levels of higher economic growth, which made domestic investment less dependant on FDI. These ratios for the continent are way above the 12 per cent plus ratio for the developing world, illustrating the importance of and dependence on FDI inflows in capital formation and investment on the continent.
The major source countries are still France, the UK and the US. However, India, Malaysia, China and South Africa as developing countries are also becoming major investors on the continent.
Notwithstanding the fact that FDI flows to the continent have declined in their share of both world flows and flows to developing countries towards the end of the 1990s, a reversal of these flows is evident since 2000. The reversal of the African share of world FDI flows has taken place on the back of the exponential increase in nominal flows to the continent, particularly since the late 1990s and early 2000s. The sectoral distribution of flows since 2000 also indicate that foreign investment has shifted from its former focus on primary industries only towards more flows into service industries. The increase in nominal FDI flows has led to a significant improvement in its share of continental GDP as well as in the gross fixed capital formation to GDP ratio. The dynamics of these improvements are now being discussed.
3 FDI dynamics
Given the diversity of African countries, continental averages tend to mask the impact of FDI on sub-regions and individual countries. The unpacking of flows to and from the various sub-regions and countries provide more details on the dynamics of these flows since 2000.
The inflows to the continent are not evenly spread amoung the five sub-regions2. On average, Northern Africa has been the most popular recipient, receiving 34.3 per cent of all flows to the continent during the period 20002008. Besides the fact that this region attracts investments into oil exploration in countries such as Egypt, Libya, Algeria and Morocco, flows to this sub-region remain strong because of renewed privatisation programmes and policy initiatives to improve efficiency. The largest investors in this region are the US, UK and Germany. Inflows into Central Africa (26.8 per cent) increased to such an extent in 2008, that the region moved from a general fourth position in the past to second position. The flows are predominantly concentrated in Equatorial Guinea, the DRC, Chad, Congo and Cameroon, all, with the exclusion of the DRC, oil-exporting countries. Transnational corporations are investing in the primary (mining and oil exploration) and service sectors, including infrastructure development. Since the UK has disinvested its interests in Equatorial Guinea, the FDI inflows predominantly come from other developing countries. FDI inflows to Western Africa (18.3 per cent) are dominated by flows into the oil industry in Nigeria. The FDI boom in the primary sector as well as a number of privatisation schemes and project upgrades in Burkina Faso, Cote d'Ivoire and Mali also explain the flows to this sub-region. Southern Africa is in the fourth position, receiving on average 12,3 per cent of continental flows to countries such as South Africa, Zambia, Namibia, Botswana and Mozambique. The recipient industries vary between service industries, aluminium industries and copper mining. It is worth noting that China is becoming a major investor in this sub-region. Eastern Africa ranks the lowest in FDI inflows to the continent, with the majority of inflows flowing into the primary sector. Natural resource exploration projects in Tanzania are the most significant in this sub-region. Privatisation sales in Kenya and tourism investment in Mauritius are examples of non-resource-driven FDI in the region.
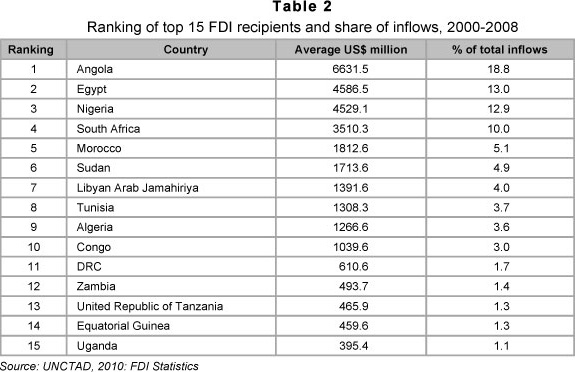
The distribution of FDI inflows among the recipient countries highlights the uneven spread of FDI inflows on the continent. The top 15 destinations, ranked according to their average inflows for the period 2000-2008, are listed in Table 2. A number of observations can be made on the countries included in the list:
- The top 15 countries comprise 28 per cent of the continent and are recipients of 86 per cent of all inflows during the period 20002008.
- The top four destinations - Angola, Egypt, Nigeria and South Africa - received approximately 55 per cent of all flows to African countries since 2000.
- The four largest economies on the continent - South Africa, Egypt, Algeria and Nigeria - contribute 56 per cent of the continent's GDP and are recipients of approximately 40 per cent of all FDI inflows.
- Ten African oil-exporting countries3 are included in the top 15 list, reflecting the interest of foreign investors in this particular sector on the continent. Four of the remaining five countries can be classified as non-oil commodity exporters (South Africa, Zambia, Tanzania and DRC).
- Nine of the sixteen countries listed have achieved higher than the continent's average growth rate over the period.
- With the exception of Sudan, the remaining listed economies can be seen as reasonably open. In the majority of the listed countries, exports comprise more than 30 per cent of GDP and trade exceeds 50 per cent of GDP.
The evidence provided above signifies the uneven spread of FDI inflows to the continent. Two major features are discernible:
- Firstly, the small number of large economies on the continent that dominate the FDI scene.
- The second feature is perhaps more significant: 71.3 per cent of all inflows are directed at 12 oil-exporting countries, while the remaining non-oil-exporting countries (43 in total) receive a mere 28.7 per cent of all inflows. If the group of non-oil-exporting countries is disaggregated, the non-oil commodity-exporting countries (14 in total) are recipients of 18.7 per cent of all inflows. If South Africa, where recent FDI inflows have been directed more towards the services sector, is excluded, the remaining pool of non-oil commodity-exporting countries only receives approximately 8 per cent of all FDI inflows. The remaining group of non-oil as well as noncommodity-exporting countries receive a mere 10 per cent of all inflows, substantiating the fact that FDI flows to the continent are still natural resource-driven. Furthermore, oil-exporting countries are the major attraction for continental FDI inflows, although not all of the flows to these countries are necessarily directed to oil extraction per se. The interest of foreign investors in non-oil commodities also seems to be declining, and very little interest exists in FDI in non-resource-rich countries.
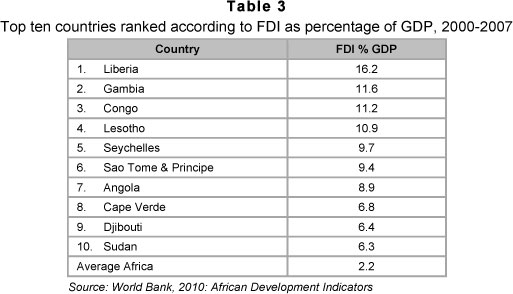
The impact of FDI on individual countries can be assessed by looking at its contribution to GDP and to gross fixed capital formation, respectively. The top 10 recipient countries, as measured by GDP impact, are ranked in Table 3. The FDI inflows to these countries make a substantial impact to their economies, especially if it is taken into account that their ratios of 2.2 per cent are way above the average for the continent. These results provide a mixed bag of countries, ranging from three oil exporters (Angola, Sudan and Congo), one non-oil commodity exporter (Zambia - copper) to five non-resource-rich countries. The latter group consists of Gambia, Lesotho (clothing and textile industries), Seychelles, São Tomé and Principe, Djibouti and Cape Verde. The majority of these countries, excluding Seychelles and the Congo, are still classified as least-developed countries.
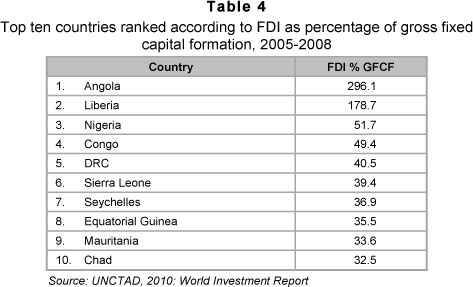
FDI as a percentage of gross fixed capital formation illustrates the importance of this source of investment for African countries (see Table 4 below). Angola topped the list primarily due to the inflow into oil extraction industries. Foreign investment in the majority of countries on the top ten list is also natural resource-driven, again dominated by oil exploration. With the exception of Nigeria (where FDI inflows are more diversified), the remainder of countries are classified as least developed countries.
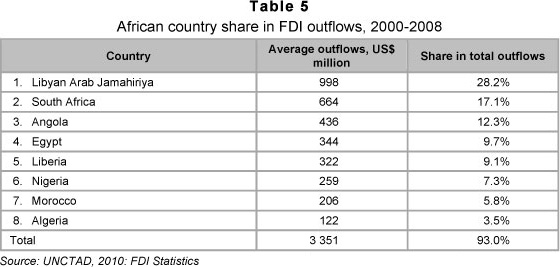
As stated earlier in the paper, a mere 1.8 per cent of developing country FDI outflows originate in African countries. Eight African countries have been the dominant source countries during the 2000-2008 period - see Table 5. Libyan Arab Jamahiriya is by far the largest and most prominent source country, with an outflow contribution of on average 28 per cent during the period 2000-2008. The country became particularly active as source country over the last three years. The majority of the outflows of the other African investor countries such as South Africa, Angola, Egypt and Liberia are directed at other African countries and, driven by the commodity market boom, investments are primarily aimed at natural resource exploration and the services sector. As was mentioned earlier, the latter sector appears to be experiencing an increase in inflows.
4 Econometric methodology
The literature on African FDI reveals that no conclusive evidence exists on the determinants of FDI inflows, especially not for the period after 2000. Taking cognizance of the statistical challenges, correlation analyses and stepwise regressions are used to establish possible economic determinants explaining FDI inflows to Africa since 2000. Panel data, obtained for the African Development Indicators (World Bank, 2010), is used for 464 African countries, using country averages covering the period 2000-20075. We use the cross-section regression instead of panel data regression to account for a large number of missing observations for the period under investigation. In addition, given the lack of consensus in the literature regarding the determinants of FDI, this paper uses the most common explanatory variables used. The basic equation underlying the determinants of FDI in Africa is written as

where a is the intercept, Oil is the variable of interest, a dummy variable, representing countries that export oil, x is a vector of control variables, and ei is the stochastic error term.
The dependent variable is the average nominal FDI inflows to the respective countries. The explanatory variables identified are:
- Trade (imports plus exports) and exports, as percentages of GDP, respectively, to establish whether more open economies attract more FDI inflows;
- Real GDP of the individual economies to establish whether market size is attractive to potential foreign investors;
- Rate of inflation as proxy for sound macroeconomic policy;
- Gross domestic investment as percentage of GDP to verify whether higher domestic investment attracts foreign investment;
- Oil-exporting countries versus non-oil-exporting countries to establish the appeal of oil exporters in attracting more FDI to the continent (dummy variable);
- Road kilometres per 1 000 square kilometres of land area as proxy for the quality of infrastructure.
5 Estimation results
The correlation coefficients (R) as well as the R2 are shown in Table 6. The correlation analysis indicates that only two explanatory variables - market size and oil exporting countries - are significant and positively correlated with the dependent variable.
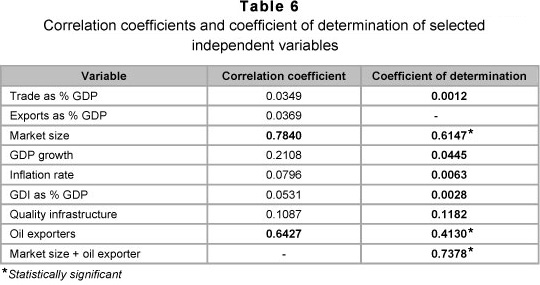
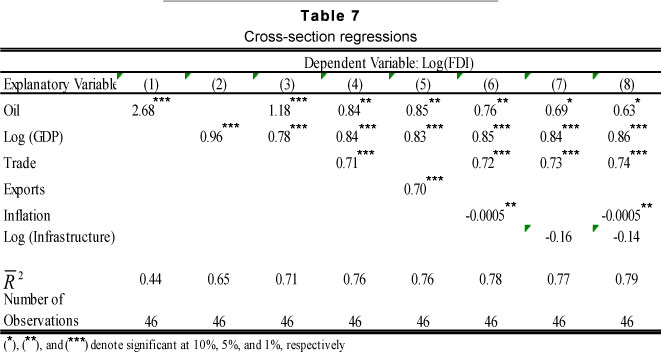
Table 7 includes results of cross-section regressions, using log of FDI as dependent variable. Column 1 includes only one explanatory variable, the dummy variable for oil exporting countries6. The first regression reveals that oil plays a crucial role in explaining FDI in Africa, displaying a positive coefficient, which is significant at a one percent level. In addition, with an R2 of 0.44, it means oil alone explains 44 per cent of variation in log FDI, which is relatively high. These results validate the above descriptive analysis, which points to the importance of oil in attracting FDI on the continent. The second column portrays a regression with log GDP, which is a proxy of the size of the economy, as explanatory variable. This regression demonstrates that the size of the economy matters, with a positive coefficient and significance at one percent, confirmed by the adjusted R2, indicating that 66 per cent of the change in FDI is explained by the size of the economy alone. Given the endogeneity nature of log GDP, we use log of final consumption expenditure as instrument7. However, (1) and (2) could be misspecified, given that they are both simple-regression models with one explanatory variable. Model (3) combines both oil and log of GDP as explanatory variables. Both these variables have correct signs and are significant at a one percent level. Moreover, combined they explain 71 per cent of variation in FDI, which is much higher.
Another determinant of FDI discussed in the literature is trade. Open economies tend to attract more FDI than closed economies. This argument is true as indicated in model (4). The coefficient of trade shows a correct sign and it is significant at a one percent level. However, including trade does not improve more on the explanatory power of (3); the increment is five percentage points only. Furthermore, FDI increases by 0.71 per cent following a percentage increase in trade, which is lower relative to the impact of GDP and oil, respectively. Including exports produces similar results as model (4), and the adjusted R2 unchanged at 76 per cent.
As discussed above, the literature on FDI points to the fact that sound macroeconomic policy and good infrastructure matter for FDI. Models (6) and (7) test this hypothesis and we conclude that these two variables have not been major determinants of FDI in Africa since 2000. Even though inflation in (6) has the expected sign, it is only significant at a ten percent level and the coefficient is very low. Notice that the adjusted R2 increases only by two and one percentage points, respectively when inflation is added to the model. The log of infrastructure does not portray the correct sign in (7). It is also not significant and furthermore only increases the explanatory power of the model by one percentage point. On the other hand, the coefficient of oil decreases slightly and it is significant at 10 per cent in model (7), while coefficients of log of GDP and trade remain more or less the same.
However, when all variables are included in model (8), the explanatory power of the model increases from 75 per cent to 79 per cent, illustrating that, with the exception of infrastructure and inflation, these variables matter for FDI in Africa. Similar to models (6) and (7), infrastructure and inflation do not matter for FDI in Africa, but openness and the size of the economy are still essential. Oil displays a lower coefficient, but is still significant at the 10 per cent level.
6 Conclusion and FDI challenges
Increases in and sustainable FDI flows to Africa are seen by Nepad as long-term goals to ensure growth and development on the continent. At this point in time (2008), nominal flows to the continent are on the increase despite a declining trend in the continent's share of flows to the developing world. The flows to the continent are also unevenly spread and are concentrated in the largest economies and/or in petroleum/oil-exporting countries.
Since the FDI to GDP as well as the FDI to GFCF ratios for Africa are greater than in other developing regions, the potential growth spill-over benefits are large. The econometric analysis reveals that oil exporters and the size of the economy are powerful explanatory variables in explaining FDI flows to Africa, with trade openness a positive, but less powerful variable.
Looking forward, two mainstream challenges are facing the continent. The first challenge relates to the world recession and its possible long term impact on African FDI inflows.
Since the majority of FDI inflows since 2000 have been driven by high commodity prices in general and high oil prices in particular and the associated need of foreign investors to expand their operations, the decline in commodity process, associated with world recession, may have an adverse impact on FDI flows to the continent. The IMF in its most recent World Economic Outlook (IMF(a), 2010:2) indicates that world economic growth slowed from 5.2 per cent in 2007 to 3.2 per cent in 2008 and contracted with 0.6 per cent in 2009. The projections for 2010 were that growth would bounce back to 4.8 per cent in 2010. African growth has contracted from 5.2 per cent in 2008 to a mere 1.9 per cent in 2009 (IMF(b), 2010:2), with the 2010 projection indicating a recovery to 4.3 per cent. Given that oil prices and non-oil commodities declined by 36.1 per cent and 18.9 per cent respectively in 2009, but recovered with growth rates of 22 per cent and 5.8 per cent in 2010, could signal a slowdown in the expansion of investment in these areas in the near future. The lower world growth and a decline in profits could also impact on an associated lower potential for earnings available for reinvestment. In line with the contraction of all major macroeconomic variables, world net FDI flows also declined with 45 per cent in 2009 and projections are that they will slowly recover towards the 2008 levels in the next few years (IMF(a), 2010:200). This is expected to have a significant effect on FDI flows to Africa over the next two years.
The second major challenge for African countries relates to the fact that natural resource-driven FDI, and especially oil, has limited linkages to domestic enterprises and little impact on downstream activities in host economies (UNCTAD, 2003:37; UNCTAD, 2008:42). African countries need to implement programmes to channel petroleum and mining revenues for investment in physical and human capital that is supportive of broader economic growth and development.
Endnotes
1 It is important to note that FDI statistics are notoriously difficult to measure, and even more so for African countries. The UNCTAD data set however proves to be the more reliable source.
2 Data and information compiled from UNCTAD, 2000-2010
3 The oil-exporting countries are: Algeria, Chad, Cameroon, Congo, Egypt, Libya, Morocco, Tunisia, Nigeria, Angola, Equatorial Guinea and Sudan. Cameroon and Chad are not included in the top 15 list.
4 Comoros, Djibouti, Eritrea, Guinea, Liberia, São Tomé and Principe and Somalia have been omitted due to lack of data.
5 The data is restricted to 2007 since more recent GDP figures for a large number of African countries are not available for 2008 during the time the research was conducted.
6 We remove outliers with absolute median deviations greater than three times interquartile range.
7 Tests show that log of consumption expenditure is both relevant and exogenous instrument, since it is correlated with log of GDP and uncorrelated with the error terms. Note we use 2-Stage Least Square (2SLS) regressions in models 2 to 8.
References
AKINKUGBE, O,. 2005. A two-part econometric analysis of foreign direct investment to Africa. Journal of World Trade, 39(5):907-923. [ Links ]
ASIEDU, E. 2002. On the determinants of foreign direct investment to developing countries: Is Africa different? World Development, 30(1):107-119. [ Links ]
ASIEDU, E. 2003. Foreign direct investment to Africa: The role of government policy, governance and political instability, Department of Economics, University of Kansas. [ Links ]
ASIEDU, E. 2004. Policy reform and foreign direct investment in Africa: absolute progress but relative decline. Development Policy Review, 22(1):41-48. [ Links ]
BRESLIN, T.P. & SAMANTA, S.K. 2008. Investment flows, economic growth and corruption in African countries: an analysis. Journal of African Business, 9(2):287-307. [ Links ]
HAILU, Z.A. 2010 Demand side factors affecting the inflow of FDI to African countries: Does capital markets matter? International Journal of Business and Management, 5(5):104-116. [ Links ]
INTERNATIONAL FINANCE CORPORATION. 2008. Doing business 2008, IFC: Washington. [ Links ]
INTERNATIONAL MONETARY FUND (IMF a). 2010. World economic outlook October 2010, IMF Publications: Washington. [ Links ]
INTERNATIONAL MONETARY FUND (IMF b). 2010. World economic outlook Update January 2010, IMF publications: Washington. [ Links ]
NAUDE, W.A. & KRUGELL, W.F. 2003. Foreign investment in Africa: do institutions and geography matter? Paper presented at the Conference of the Economics Society of South Africa, Somerset West, September. [ Links ]
NDULU, B.J., CHAKRABORTI, L., LIJANE, L., RAMACHANDRAN, V. & WOLGIN, J. 2007. Challenges of African growth: opportunities, constraints, and strategies, The World Bank publications: Washington DC. [ Links ]
ROJID, S., SEETANAH, B., RAMESSUR-SEENARAIN, T. & SANNASSEE, V. 2009. Determinants of FDI: lessons from African economies, UNCTAD. [ Links ]
UNITED NATIONS COMMISSION ON TRADE AND DEVELOPMENT (UNCTAD). 2010. FDI statistics, www.unctad.org/fdistatistics. [ Links ]
UNITED NATIONS COMMISSION ON TRADE AND DEVELOPMENT (UNCTAD). 2009 World investment report 2009. United Nations: New York. [ Links ]
UNITED NATIONS COMMISSION ON TRADE AND DEVELOPMENT (UNCTAD). 2008 World investment report 2008. United Nations: New York. [ Links ]
UNITED NATIONS COMMISSION ON TRADE AND DEVELOPMENT (UNCTAD). 2007 World investment report 2007. United Nations: New York. [ Links ]
UNITED NATIONS COMMISSION ON TRADE AND DEVELOPMENT (UNCTAD). 2006 World investment report 2006. United Nations: New York. [ Links ]
UNITED NATIONS COMMISSION ON TRADE AND DEVELOPMENT (UNCTAD). 2005 World Investment Report 2005. United Nations: New York. [ Links ]
UNITED NATIONS COMMISSION ON TRADE AND DEVELOPMENT (UNCTAD). 2004 World investment report 2004. United Nations: New York. [ Links ]
UNITED NATIONS COMMISSION ON TRADE AND DEVELOPMENT (UNCTAD). 2003 World investment report 2003. United Nations: New York. [ Links ]
UNITED NATIONS COMMISSION ON TRADE AND DEVELOPMENT (UNCTAD). 2002 World investment report 2002. United Nations: New York. [ Links ]
WORLD BANK. 2010. African development indicators, Oxford University Press: New York. [ Links ]
Accepted: March 2012