


Servicios Personalizados
Articulo
 Inglés (pdf)
 Articulo en XML
 Referencias del artículo
Indicadores

Links relacionados
-
 Citado por Google
 -
 Similares en Google
Compartir

 Permalink
South African Journal of Economic and Management Sciences
versión On-line ISSN 2222-3436
versión impresa ISSN 1015-8812
S. Afr. j. econ. manag. sci. vol.14 no.3 Pretoria ene. 2011
Application of the attitude toward enterprise (ATE) test on secondary school learners in South Africa
Andre G SteenekampI; Stephan P van der MerweII; Rosemary AthaydeIII
IConsultant
IIPotchefstroom Business School, North-West University
IIISmall Business Research Centre, Kingston University
ABSTRACT
The main aim of this research paper was to discuss the application of the Attitude Toward Enterprise (ATE) Test1 developed by Kingston University, London, on secondary school learners in South Africa. A total of 1 748 usable questionnaires were gathered from grade 10 learners in the Sedibeng District and utilised for statistical analysis. Five factors with eigen-values greater than one describing the entrepreneurial attitudes of young learners were extracted during exploratory factor analysis. Tests for reliability and construct correlation produced satisfactory results to recommend the Enterprise Attitude Questionnaire for further use on young learners in South Africa. A comparison of the mean differences between the constructs for demographic variables produced statistically significant differences in a number of instances, but no visible effects or practical significance to suggest that these differences have any effect in practice. Practical recommendations are offered for further employment of the Enterprise Attitude Questionnaire in entrepreneurship research on young learners.
Keywords: attitude, education, entrepreneurship, impact, recommendations, youth
JEL: D83, I23
1 Introduction
Youth entrepreneurship has an important role to play in South Africa's efforts to promote a business environment conducive to sustainable growth as well as economic and social prosperity. However, unemployment rates in South Africa are increasingly higher in the lower age groups with the highest occurrence in the group aged 15 to 24 years (Stats SA, 2007). The age profiles of discouraged work-seekers (people who have given up on finding employment) also indicate that the highest concentration is in the younger age groups of 20 to 24 years (905 000: 19.4%) and 25 to 29 years (700 000: 16.1%) (Stats SA, 2007:xxi).
If one considers that 1.6 million people in the age group 20 to 29 have given up on finding employment in South Africa, it stands to reason that not enough is being done to include the younger generation in the economy of this country and to stimulate selfemployment for future sustainability. Accordingly, the primary objective of this study was to examine the entrepreneurial attitudes of young learners in South African secondary schools based on the belief that the attitudes of young learners will have a significant impact on their employability and inclination towards self-employment.
2 Problem statement
Maas and Herrington (2007:15) note that education has a significant impact on entrepreneurial success, especially for innovation as a key success factor in the technologically advanced global environment. However, Isaacs, Visser, Friedrich and Brijlal (2007:613) and Horn (2006) agree that various problems in schools impede effective entrepreneurship education, including poorlytrained teachers and a lack of adequate resources. According to Horn (2006:113), only 5 to 7 per cent of successful Grade 12 candidates in South Africa find employment in the formal sector, thus emphasising the urgent need for youth entrepreneurship education.
Against evidence of the belief that job creation is mainly the responsibility of the government (Maas & Herrington, 2007:35), the problem statement central to this study is the expectation that entrepreneurship education (or the lack thereof) in South African schools will continue to contribute towards the high level of unemployment and increasing numbers of discouraged work-seekers among young South Africans.
3 Research objectives
The primary objective of this study was to examine the entrepreneurial attitudes of young learners in South African secondary schools. In view of this objective, the following secondary objectives were formulated:
• To obtain insight into the different approaches to entrepreneurship research, and in particular, research on young learners instead of actual adult entrepreneurs;
• To employ an existing, validated instrument to measure the entrepreneurial attitudes of young learners in South African schools;
• To validate the measuring instrument for the South African environment by means of statistical analysis;
• To examine the relationships between the constructs of entrepreneurial attitude and he demographical variables by means of paired tests and effect sizes;
• To make practical recommendations for further employment of the questionnaire in South African schools.
4 Literature review
Statistics indicate that the largest proportion of people in every country who are poor, illiterate, unemployed, living with HIV/AIDS or at risk of contracting the disease, involved in armed conflicts, and engaged in crime and violence are young people (Ryan, 2006:60). In 2005, an estimated 55 per cent of South Africa's children were living in ultra poverty (Leatt, 2006:27), and more recently, Herrington (2009:53) estimated that two-thirds of the South African population between 18 and 35 years of age were unemployed.
South Africa suffers from high unemployment, low economic growth and substandard Total early-stage Entrepreneurial Activity (TEA) (Swanepoel, Strydom & Nieuwenhuizen, 2010:58). In a study on the impact of previous knowledge and experience on the entrepreneurial attitudes of Grade 12 learners, Burger, O'Neill and Mahadea (2005:89) concluded that South Africa has a poorly developed entrepreneurial culture. This proposition is supported by data from the Global Entrepreneurship Monitor (GEM) indicating that a country at South Africa's stage of economic development would be expected to have a TEA rate in the order of 13 per cent, almost double South Africa's actual rate of 7.8 per cent in 2008 (Herrington, Kew &Kew, 2009:4).
It follows, as proposed by Kroon, de Klerk and Dippenaar (2003:319) and North (2002:24), that the entrepreneurial energy of all people, including children, should be harnessed towards economic development, job creation and the alleviation of poverty. Isaacs et al. (2007:613) argue that education is the key to establishing a culture of entrepreneurship in South Africa, and that schools are the place where the most profound impact can be brought about in youth development. Entrepreneurship education develops the skills, contacts and opportunities vital to most successful businesses (Botha, Nieman & van Vuuren, 2007:163), and the development of young entrepreneurs in South Africa plays a central role in innovation, economic growth, job creation and the alleviation of poverty, as well as in social and economic empowerment of the youth by arming them with greater control over their lives (Ndedi, 2009:463-464).
In view of the emancipation of women, the literature on female entrepreneurship suggests that women are more disadvantaged than men in terms of both entrepreneurial options and entrepreneurial resources (Smith-Hunter & Boyd, 2004:20), and that interventions designed for women may require greater nurturing in self-confidence and esteem, as well as business skills (Botha et al., 2007:164). Herrington et al (2009:21) agree that men are still substantially more likely than are women to be involved in both early-stage entrepreneurial activity (male TEA 62%; female TEA 38%) as well as in established businesses (male 65%; female 35%).
From an age perspective, involvement in early-stage entrepreneurial activity is lower in the 18 to 24 age category, and although being in line with general GEM trends, this phenomenon is of concern in the South African context, moreover when considering the disproportionally high unemployment figure for the youth (Herrington et al., 2009:23). Data from the 2008 GEM South African report (Herrington et al., 2009:23) also indicates that the ratio of entrepreneurs to each population group is the lowest among black Africans (0.9), followed by coloureds (1.2), Indians/ Asians (1.6) and whites (1.7). These differences in entrepreneurial activity call for a renewed focus on entrepreneurship research, and in particular, for the identification of problem areas where training interventions will have the greatest impact.
There are a number of leading youth entrepreneurship training providers in South Africa such as the Foundation for Economic and Business Development (FEBDEV), the South African Institute for Entrepreneurship (SAIE), the Education with Enterprise Trust (EWET), and Junior Achievement South Africa (JASA) (UYF, 2004:27). Notwith-standing the valuable contributions made by these organisations, the lack of assessing the effectiveness of entrepreneurship training interventions (Levie, Hart & Anyadike-Danes, 2009:2; Botha et al., 2007:164; Honig, 2004:270) presents a severe shortfall in academic research.
Academic research on entrepreneurship traditionally focused on the personality traits, characteristics and 'special' skills of entrepreneurs (Moen, Rahman, Salleh & Ibrahim, 2004; Luthje & Franke, 2003; Cromie, 2000; Caird, 1991; Hisrich & Brush, 1986; Cromie & Johns, 1983), including common personality traits such as achievement motivation (Buys & Havenga, 2006:37; Moen et al., 2004:193); risk taking propensity (Douglas & Shepherd, 2002:81; Cromie, 2000); locus of control (Luthje & Franke, 2003:143); and opportunity recognition (Allinson, Chell & Hayes, 2000:33) to name but a few. However, many scholars, such as Athayde (2009a), Johnston, Andersen, Davidge-Pitts and Ostensen-Saunders (2009), Van Wyk and Boshoff (2004), Cromie (2000) and Robinson, Stimpson, Huefner and Hunt (1991) argue that trait approaches have not been successful in entrepreneurship research.
Although trait approaches are regarded as being useful for simplistic tests based on traits for exploration and descriptive purposes (Caird, 1991:179) and to explain some aspects of why people become entrepreneurs (Cromie, 2000:24), Gartner (1989:47) concludes that behavioural approaches provide a more productive perspective for research on entrepreneurship. Robinson et al. (1991) also conclude that attitude is a better approach to the description of entrepreneurs than either personality characteristics or demographics.
Littunen (2000:304) maintains that the trait approach may result in the exclusion of potential (latent) entrepreneurs from entrepreneurial learning based on their prior-learning personality characteristics being seen as 'unfit' for development. Other findings presenting problems for the trait approach to entrepreneurship research include those of Luthje and Franke (2003:135, 143), where 'attitude towards entrepreneurship' produced the strongest explanation for the entrepreneurial intentions of students; the conclusion by Urban, Van Vuuren and Owen (2008:2) that previous results on the study of motivation in entrepreneurship using personality constructs, such as achievement need, risk-taking, tolerance of ambiguity and locus of control have produced mixed results; and the inability of the study by Johnston et al. (2009:41) to determine a significant relationship between specific personality types and potential entrepreneurial ability.
4.1 Attitude approaches to entrepreneurship research
Literature on entrepreneurship suggests that the attitude approach to research is largely based on the theory of planned behaviour (TPB), as proposed by Ajzen (1991). According to TPB, behaviour can be predicted by intentions, and these intentions, in turn, can be predicted by the attitude towards the behaviour, subjective norms regarding the behaviour, and perceived behavioural control over the behaviour (Ajzen, 1991). Krueger and Brazeal (1994:93) comment that research on intentions mostly focuses on proximal behaviours and not long-term goals but concede that TPB appears to be applicable in entrepreneurship research.
Gird and Bagraim (2008) examined the theoretical sufficiency of TPB by considering four additional factors believed to influence entrepreneurial intention (personality traits, situational factors, demographics and prior experience to entrepreneurship). The study indicated that prior experience of entrepreneurship, contrary to personality traits and situational and demographic factors, significantly added to the predictive power of TPB in explaining entrepreneurship intentions (Gird & Bagraim, 2008:711).
Peterman and Kennedy (2003) and Krueger (1993:17) also found significant support for Shapero's proposition that entrepreneurial intentions are largely derived from perceptions of feasibility; perceptions of desirability; and a propensity to act which are, in turn, derived from control beliefs. The results of Gird and Bagraim's (2008:717) study, as predicted by TPB, confirmed that perceived behavioural control, subjective norms and attitudes towards entrepreneurship had statistically significant positive correlations with entrepreneurial intent.
In support of the findings of Luthje and Franke (2003:135, 143), Gird and Bagraim (2008:717) conclude that the 'attitude towards entrepreneurship' variable had the strongest effect on entrepreneurial intent, while the perceived behavioural control and subjective norm variables had weaker statistically significant effects.
4.1.1 The entrepreneurial attitude orientation (EAO) scale
The Entrepreneurial Attitude Orientation (EAO) scale of Robinson et al. (1991:17) is based on the tripartite model of attitude predicting three types of reaction to everything: affect (positive or negative feelings towards an object), cognition (beliefs and thoughts about an attitude object) and conation (behavioural intentions and predispositions to behave in a given way towards the object). The EAO scale consists of four constructs seen as highly relevant to entrepreneurship, including innovation, personal control, the need for achievement and self-esteem (Robinson et al., 1991:19).
Robinson et al. (1991:23-24) concluded that three of the four subscales (innovation, personal control and self-esteem) contributed significantly to the discriminant function between entrepreneurs and non-entrepreneurs. Based on the EAO scale, Van Wyk, Boshoff and Bester (2003:18, 21) later concluded that biographic/demographic variables, such as age, number of jobs held, and the number of organisations worked for, did not show strong relationships with entrepreneurial attitudes, but that certain personality sub-scales of type A behaviour (achievement striving and impatience/irritability), locus of control, career orientations and self-concept were strong predictors of entrepreneurial attitude orientation.
The EAO study by Moen et al. (2004:192) also revealed no significant relationship between entrepreneurial attitude orientation and respondents' age, sex, race, religion and state of origin, but produced sufficient evidence to conclude that respondents' residential area, field of study, parents' education and fathers' occupation have a significant relationship with entrepreneurial attitudes. In another EAO study, Van Wyk and Boshoff (2004:34) found significant differences between entrepreneurs and engineers on three of the EAO sub-scales, including innovation, self-esteem and achievement, as well as on the overall EAO scale.
4.1.2 The entrepreneurial opportunity recognition (EOR) scale
The Entrepreneurial Attitude Orientation (EAO) scale was later expanded by McCline, Bhat and Baj (2000) to include two new exploratory scales to measure attitude toward risk and opportunity recognition in what they called 'Entrepreneurial Opportunity Recognition' (EOR). In a study on the health care industry, McCline et al. (2000:89) found that two of the EAO sub-scales (perceived control and self-esteem in Robinson et al., 1991) uncovered a significant difference between entrepreneurs and non-entrepreneurs.
4.1.3 The attitude toward enterprise (ATE) test
Another adaptation of the EAO scale of Robinson et al. (1991) surfaced in the work of Athayde (2009a; 2009b; 2004). Athayde (2009a:481) found that entrepreneurship in young people under the age of 25 currently represents a relatively new source of business start-ups and economic growth. As a result of the limitations of personality trait theory, Athayde (2009a:482) focused on attitude theory by building on the EAO scale of Robinson et al. (1991) and the subsequent work (EOR) ofMcCline et al. (2000).
The 'Attitude Toward Enterprise Test' (ATE Test) was developed to measure young people's attitudes towards a similar collection of constructs employed by Robinson et al. (1991), but taking into account the need for an instrument to measure enterprise potential in young people instead of actual adult entrepreneurs (Athayde, 2009a:483).
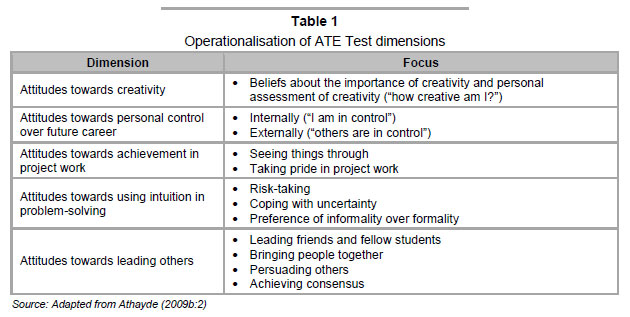
Ajzen (1991:180) points out that general dispositions tend to be poor predictors of behaviour in specific situations. It follows that constructs for research on attitudes need to be domain specific rather than general statements. Based on the criteria that measurement dimensions should consistently be associated with theories of entrepreneurship and should have been measured in empirical studies on entrepreneurship, Athayde (2009a:483) selected five dimensions of latent enterprise potential, including Achievement, Personal control, Creativity, Leadership and Intuition. These dimensions were operationalised (Athayde, 2009b:2) by placing them within a context relevant to young people still at school, as shown in Table 1. Athayde (2009a:488) employed exploratory factor analysis (EFA) and Cronbach alpha coefficients for reliability testing of the ATE Test. EFA showed that four of the factors shown in Table 1 were within acceptable levels of reliability, whereas the Intuition construct provided no solution and was therefore omitted from the measure. Using 0.7 as the benchmark for Cronbach alpha coefficients (Peterson, 1994:381), the remaining four constructs passed the threshold.
The subsequent study at secondary schools in London (Athayde, 2009a) concluded that participation in an enterprise programme positively influenced young people's enterprise potential and attitude towards entrepreneurship. In addition, the type of school (private/public), parents' occupation and gender were also found to be related to the attitude towards entrepreneurship (Athayde, 2009b:2). The desire for self-employment was influenced by demographic characteristics such as ethnic background, gender and having a self-employed parent (Athayde, 2009a:495).
5 Research design
Invitations to participate in this study were sent to the principals of 74 secondary schools registered with the Department of Education (DoE) in the Sedibeng District, Gauteng Province. The invitation included a short questionnaire for completion by each principal with provision for the school's details, the appointment of a responsible teacher, an option to participate in the study and the expected number of Grade 10 learners for 2009.
Seventeen schools returned the completed questionnaire, of which one indicated that it was a school for learners with behavioural problems. The remaining 16 responding schools indicated an expected 2 099 Grade 10 learners for 2009. A decision was made to include all the responding schools (target n = 2 099) to reach critical mass in the sample size.
Approval was obtained from the Small Business Research Centre (SBRC) at Kingston University, United Kingdom, for employment of the ATE Test in the empirical study. The ATE Test was incorporated into the 'Enterprise Attitude Questionnaire', including a section designed to gather demographic information from the respondents.
5.1 Gathering of data
As Grade 10 learners are minors, only schools where the principal had provided written permission for learners to participate in the study by returning the completed questionnaire were included in the empirical study.
5.1.1 Method of data gathering
Dates for the presentation ofthe questionnaires to responsible teachers or for the completion of the questionnaires were arranged during telephonic conversations. The responsible teachers were given the opportunity to select the method of completion in an attempt to secure their full cooperation. Hence, the data was gathered during school hours under the supervision of the responsible teacher after a meeting to discuss the requirements and procedures for the completion of the questionnaires; or under the supervision of the researchers in this instance.
Learners were informed, prior to the questionnaires being handed out, that participation in the study was not compulsory. The responsible teachers provided supervision during completion of the questionnaires, but did not intervene in the presence of the researchers.
5.1.2 Sample size
Convenience sampling was employed, as all the responding schools (with exclusion of the special school for learners with behavioural problems) participated in the study (16 schools from a population of 74 schools). A total of 1 756 questionnaires were completed, translating into 83.66 per cent of the targeted sample size. Eight questionnaires were removed from the dataset due to inadequate information provided by respondents resulting in a final sample of 1 748 responses (n = 1 748).
6 Results and discussion
The statistical analysis of the data was carried out using STATISTICA (Statsoft, 2008) and SPSS (SPSS, 2008) software. The composition and characteristics of the Sedibeng sample were analysed using descriptive statistics, whereas the construct validity and reliability of the measuring instrument were respectively examined by performing exploratory factor analysis and calculating Cronbach alpha coefficients.
The relationship between the extracted factors was examined by means of correlation analysis. Finally, t-tests and effect sizes (dvalues) were carried out to examine the relationship between demographic variables and the extracted factors. In view ofaddressing the objectives of this study, the following propositions were formulated:
| P1: | The measuring instrument has acceptable construct validity. |
| P2: | The measuring instrument has acceptable reliability. |
| P3: | There is correlation (a relationship) between the constructs of Leadership, Achievement, Creativity, Personal control and Intuition measured in the ATE Test. |
| P4: | There is a difference between the entrepreneurial attitudes of male and female Grade 10 learners with regard to the constructs of Leadership, Achievement, Creativity, Personal control and Intuition. |
| P5: | There is a difference between the entrepreneurial attitudes of Grade 10 learners from black African and white ethnic backgrounds with regard to the constructs of Leadership, Achievement, Creativity, Personal control and Intuition. |
| P6: | There is a difference between the entrepreneurial attitudes of Grade 10 learners who had been exposed to entrepreneurship at school and those who had not with regard to the constructs of Leadership, Achievement, Creativity, Personal control and Intuition. |
| P7: | There is a difference in the entrepreneurial attitudes of Grade 10 learners with self-employed parents or guardians as opposed to those learners whose parents or guardians are not selfemployed with regard to the constructs of Leadership, Achievement, Creativity, Personal control and Intuition. |
| P8: | There is a difference in the entrepreneurial attitudes of Grade 10 learners in the Sedibeng sample and British learners (Athayde, 2009a) with regard to the constructs of Leadership, Achievement, Creativity, Personal control and Intuition. |
6.1 Demographic profile
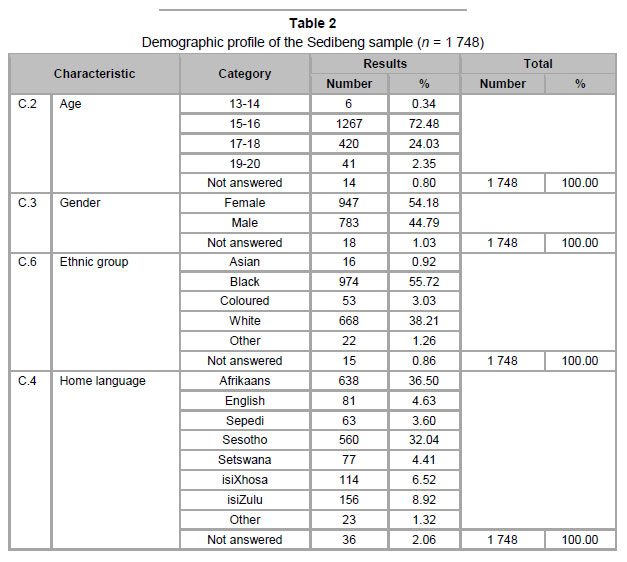
The demographic profile of the Sedibeng sample is presented in Table 2.
The demographic profile of the sample appeared proportionate to the total population of Sedibeng with a gender spread of 50.7 per cent males and 49.3 per cent females, and furthermore, consisting of 82 per cent black Africans, 16 per cent whites, 1 per cent coloureds and 1 per cent Asians (Sedibeng, 2008:8).
6.2 Results of the attitude toward enterprise (ATE) test
This study was the first to employ the ATE Test in South African secondary schools. Hence, the validity and reliability of the measuring instrument as well as the relationship between the constructs had to be re-examined prior to comparing the mean differences between constructs for demographic variables.
6.2.1 Construct validity of the ATE Test
An exploratory factor analysis (EFA) was conducted using SPSS software (SPSS, 2008) to assess the discriminant validity of the 30 items measuring entrepreneurial attitudes in young people. Kaiser's criterion, stipulating that factors with eigen-values greater than one should be retained, was used to determine the number of factors to be extracted (Field, 2005:735). Factor loadings greater than 0.35 were considered significant, as recommended by Field (2005:637, 638).
The exploratory factor analysis (Varimax with Kaiser normalisation) resulted in the extraction of seven factors with all 30 items demonstrating discriminant validity by loading to a sufficient extent, but it was evident that all but one of the reverse score items in the measuring instrument loaded separately from the factors identified by Athayde (2009a). The exploratory factor analysis was therefore performed excluding the reverse score items that loaded onto separate factors. Five factors with eigen-values greater than one, explaining 45.38 per cent of the variance before rotation, were extracted from the analysis shown in Table 3.
After rotation, these factors could be identified as the theoretical dimensions of Leadership (self-perceptions of ability to lead others), Achievement (achievement orientation in project work), Personal control (perceived personal control over career), Creativity (perceptions about creativity at school) and Intuition (intuition in problem solving) as latent variables in the measurement of the entrepreneurial attitudes of young people.
The Kaiser-Meyer-Olkin (KMO) measure of sampling adequacy of 0.871 indicated that patterns of correlations were compact and that factor analysis should yield reliable factors (Field, 2005:640). Bartlett's test of sphericity yielded a significant (p-value) smaller than 0.0001, indicating that correlation between variables was sufficient for factor analysis.
Rotation resulted in four of the items loading significantly on more than one factor with values greater than 0.35. LEAD5, ACH5 and CONT5 were classified under the factor that yielded the highest factor loading. ACH6 loaded onto both Achievement (0.449) and Creativity (0.410), but the item was classified under Creativity even with the lower factor loading as the corresponding statement in Table 3 makes more sense in the realm of Creativity.
Factor 1, labelled Leadership (LEAD), comprised four items during the exploratory factor analysis. All four items (LEAD1; LEAD2; LEAD3; LEAD4) that were used to measure the latent variable Leadership loaded onto Factor 1. Two additional items, LEAD5 (Achievement) and LEAD 6 (Intuition) loaded onto Factor 1, indicating that respondents also regarded these items as being related to their self-perception ofthe ability to lead others.
Four items (ACH1; ACH2; ACH4; ACH5) used to measure the latent variable Achievement loaded onto Factor 2, labelled Achievement (ACH), whereas the remaining two items (LEAD5 and CONT5) respectively loaded onto Factor 1 (Leadership) and Factor 3 (Personal control). Two additional items, ACH3 (Intuition) and ACH6 (Creativity), also loaded onto Factor 2, indicating that respondents viewed these items as part of their achievement orientation in project work. ACH6, however, was allocated to the construct of Creativity (factor four) for reasons explained earlier.
The third factor, labelled Personal control (CONT), resulted in the loading of all four items (CONT1; CONT2; CONT3; CONT4) used to measure the latent variable Personal control. CONT5, classified by Athayde (2004) as Achievement, also loaded onto Factor 3, suggesting that respondents viewed the corresponding statement as being related to Personal control.
Three of the items (CREA1; CREA2; CREA3) used to measure the latent variable Creativity loaded onto Factor 4, labelled Creativity (CREA), indicating that respondents viewed these items as being related to Creativity, whereas the fourth item (ACH6) loaded onto both Achievement (0.449) and Creativity (0.410). Although respondents regarded this item as being more related to Achievement, it was allocated to Creativity as discussed earlier.
The fifth and final factor, labelled Intuition (INTU), comprised five items during exploratory factor analysis. Three of the items (INTU1; INTU2; INTU3) used to measure the latent variable Intuition loaded onto Factor 5, indicating that respondents regarded these items as being related to their intuition in problem-solving, whereas the remaining two items (LEAD6 and ACH3) respectively loaded onto Leadership and Achievement.
The exploratory factor analysis, together with the interpretability of the factors, provided some evidence of construct validity, thus indicating that proposition 1 (P1) could be accepted.
6.2.2 Reliabilityofthe measuring instrument
Cronbach alpha coefficients were calculated to assess the internal consistency between the 23 items of the measuring instrument. Cronbach alpha coefficients range in value from 0 to 1 and the higher the value, the more reliable the generated scale (Santos, 1999). A Cronbach alpha coefficient of 0.7 is generally the minimum acceptable reliability for preliminary research, as recommended by Nunnally in 1978 (Peterson, 1994:381).
All 1 748 participants' responses were used to determine the reliability of the extracted factors by calculating the Cronbach alpha coefficients shown in Table 3. The only factor with a Cronbach alpha coefficient above the customary cut-off value of 0.70 was Leadership, with a value of 0.721. The remaining factors had Cronbach alpha coefficients above 0.58, with the exception of Intuition with a low alpha of0.318.
The resulting alphas, subject to the exclusion of the factor Intuition, also excluded by Athayde (2009a), were not inconsistent with the type of research described in this study. Field (2005:688) notes that questionnaires designed to measure 'knowledge' and 'intelligence' should have Cronbach alpha coefficients above the customary cut-off value of 0.70, but concedes that instruments designed to measure 'attitudes' may have lower alphas (x < 0.70) and still have acceptable levels ofreliability.
Based on the concession by Field (2005:688), proposition 2 (P2) that the measuring instrument has acceptable reliability (subject to the exclusion of Intuition) could therefore be accepted.
6.2.3 Relationship between the constructs
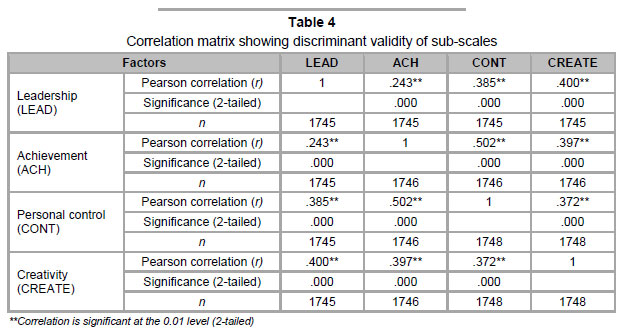
The relationship between the four remaining constructs, namely Leadership, Achievement, Personal control and Creativity, were examined by calculating the Pearson correlation coefficients (r) presented in Table 4.
Factor scores for each participant were calculated as the average of all items contributing to the relevant factor; hence missing values for an individual were automatically replaced by the average of the other responses contributing to the relevant factor for that specific individual.
It is important to determine whether the effect of the relationship between two constructs is meaningful; hence the size of the effect should be measured. Field (2005:32) notes that effect sizes are useful because it provides an objective measure of the importance of an effect. According to Cohen (1992:156), Pearson correlation coefficients of 0.10; 0.30 and 0.50 respectively indicate a small, medium and large effect.
The results in Table 4 indicate that there were statistically significant (p < 0.01) correlations between all the construct combinations. Correlations between the constructs ranged from a small effect for Leadership and Achievement (r = 0.243), to medium effects for Personal control and Creativity (r = 0.372), Leadership and Personal control (r = 0.385), Achievement and Creativity (r = 0.397) and Leadership and Creativity (r = 0.400), and a large effect for Achievement and Personal control (r = 0.502).
Although only two of the constructs (Achievement and Personal control) correlated with practically significant (large effect: r > 0.500) correlations, the results showed statistically significant correlations at the 0.01 level. Based on Cohen's guidelines (Cohen, 1992:155-159) and statistical significance (p < 0.01), proposition 3 (P3) could be accepted.
6.2.4 Comparison of the mean differences between constructs
Research methodology often employs random sampling to study the properties of a population. An advantage of drawing a random sample is that it allows the study of a population within the constraints of limited time and money (Ellis & Steyn, 2003:51). Statistical significance tests (e.g. t-tests) are then used to prove that the results, such as the difference between two means, are significant. In such cases, the p-value is used as criterion to calculate the probability that the obtained value or larger could be obtained under the assumption that the null hypothesis (that there is no difference between the means) is true (Ellis & Steyn, 2003:51).
Small p-values (e.g. smaller than 0.05) are considered sufficient evidence that the results are indeed statistically significant. However, such statistical significance does not necessarily imply that the result has practical importance, as tests for significance have a tendency to yield small p-values as the size of data sets increases (Ellis & Steyn, 2003:51).
Ellis and Steyn (2003:51) argue that statistical inference draws conclusions from descriptive measures that were calculated for a population from which a random sample was drawn. It follows that statistical inference is not appropriate if the sample becomes a subpopulation in itself, as was the case in this study (Steyn, 2002:10). In such cases, Ellis and Steyn (2003:51) recommend the use of effect sizes so that practical significance can be understood as a large enough difference to have an effect in practice. Steyn (2002:10) agrees that effect sizes can be a useful aid to determine whether the relationship is "practically significant". Although the results of the /-test are shown, the findings of this study resulting from a sub-population sample type were based on the effect sizes (d-values).
The differences in the means between the extracted factors, namely Leadership, Achievement, Personal control and Creativity, for the demographic variables gender, ethnic origin, exposure to entrepreneurship and selfemployed parents or guardians were examined by t-tests and effect sizes (d-values), because the responses of Grade 10 learners from the same population could be considered to be dependent.
The analysis was performed at group level, where the average (mean) scores of different demographic groups were taken as data points.
The effect sizes (d) were interpreted according to Cohen's guidelines (Field, 2005:32; Ellis & Steyn, 2003:52; Cohen, 1992:155-159), where d = 0.2 is a small effect; d = 0.5 is a medium effect; and d = 0.8 is a large effect. In terms of interpretation, results with medium effects (0.5 < d < 0.8) were regarded as visible effects and d > 0.8 as practically significant, being the result of a difference causing a large effect (Field, 2005:32; Ellis & Steyn, 2003:52; Cohen, 1992:155-159).
Tables 5 to 9 show the relationships between the four constructs and the demographical variables gender (Table 5), ethnic origin (Table 6), exposure to entrepreneurship (Table 7) and self-employed parents OT guardians (Tables 8 & 9), with the mean ( ) , standard deviation (s), t-tests (p-value) and effect sizes (d-value).
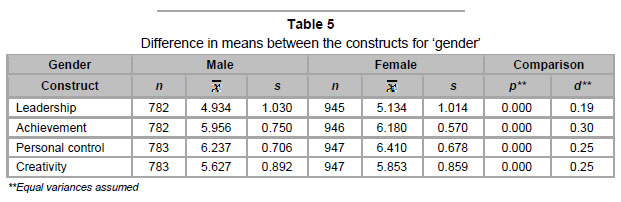
Table 5 reveals a statistically significant difference (p < 0.05) in the mean values between the perceptions of male and female Grade 10 learners with regard to the constructs
Leadership, Achievement, Personal control and Creativity (p = 0.000). Although female participants rated all four constructs more positively than their male counterparts, the differences were not practically significant as only a small effect (respectively d = 0.19; d = 0.30; d = 0.25 and d = 0.25) could be determined. Based on Cohen's guidelines (Cohen, 1992:155-159), proposition four (P4) could not be accepted.
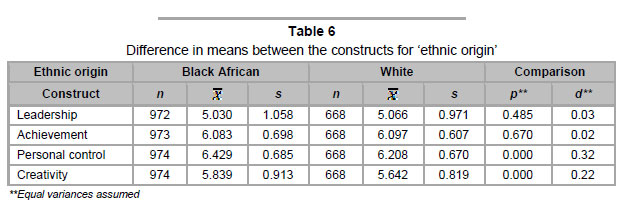
The difference in the means between the constructs for the demographic variable ethnic origin between black African and white learners (as the majority groups representing 93.93 per cent of the sample) was also examined. Table 6 confirms a statistically significant difference (p < 0.05) in the mean values between the perceptions of black African and white learners with regard to the constructs Personal control (p = 0.000) and Creativity(p= 0.000).
It is evident that black African learners rated Personal control and Creativity more positively than white learners did, but the differences between the mean values were not practically significant, as indicated by only a small effect for both Personal control (d = 0.32) and Creativity (d = 0.22). Proposition 5 (P5), that there is a difference between the entrepreneurial attitudes of Grade 10 learners from different ethnic groups (Black African and White), could therefore, based on the guidelines by Cohen (1992:155-159), not be accepted.
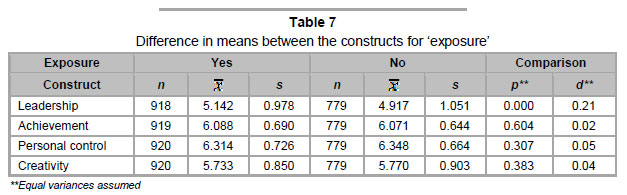
A similar analysis was conducted to determine whether entrepreneurship exposure at school has had any influence on the entrepreneurial attitudes of Grade 10 learners. Table 7 reveals a statistically significant difference (p < 0.05) in the mean values between the perceptions of learners who had been exposed to entrepreneurship and those who had not for the construct Leadership (p = 0.000). Although learners who had been exposed to entrepreneurship at school rated Leadership higher than those who had not been exposed, the difference between the mean values was not practically significant, as indicated by a small effect (d = 0.21). Based on the guidelines by Cohen (1992:155-159), proposition 6 (P6) could not be accepted.
Respondents were also asked what their parents or guardians do during weekdays to determine whether self-employed parents or guardians have had any influence on the entrepreneurial attitudes of learners. The results for male and female parents or guardians were separated and are presented in Tables 8 and 9.
The difference in the means between the constructs for the demographic variable selfemployed mother or female guardian confirmed a statistically significant difference (p < 0.05) in the mean values between the perceptions of learners with regard to the constructs Leadership (p = 0.001) and Personal control (p = 0.019) as shown in Table 8. Although learners with self-employed mothers or female guardians rated Leadership and Personal control more positively than learners whose mothers or female guardians were not self-employed, the differences between the mean values were not practically significant, as indicated by a small effect (d = 0.25 and d = 0.18 respectively).
Table 9 reveals that the difference in the means between the constructs for the demographic variable self-employed father or male guardian produced no statistically significant difference (p < 0.05) in the mean values between the perceptions of learners with regard to any of the four constructs (p > 0.10 in all cases).
Based on the guidelines by Cohen (1992:155159), proposition 7 (P7), that there is a difference in the entrepreneurial attitudes of Grade 10 learners with self-employed parents or guardians as opposed to learners whose parents or guardians were not self-employed with regard to the constructs Leadership, Achievement, Personal control and Creativity, could thus not be accepted.
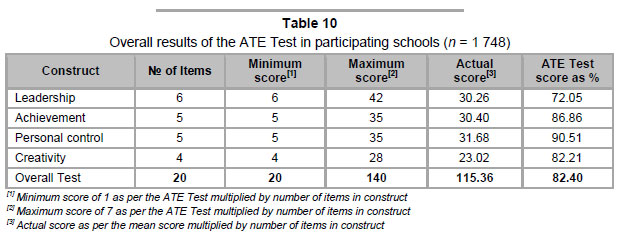
6.2.5 Results of the A TE Test
Table 10 presents the ATE Test scores for each construct as well as the overall score for comparison with the scores of British youth in the study by Athayde (2009a). The results suggested that the Sedibeng sample achieved high mean scores (suggesting a positive entrepreneurial attitude) for each of the constructs (ranging from 72.05% to 90.51%), as well as for the overall ATE Test, with a mean score of 82.40 per cent. This finding is, to a notable extent, in contrast with the study by Athayde (2009a:495), where the mean scores of different demographic sub-groups ranged from 63.0 per cent to 73.8 per cent for participants in the YE Company Programme (entrepreneurship training) and from 60.8 per cent to 69.7 per cent for non-participants.
Although this finding suggests that Grade 10 learners in the Sedibeng sample achieved a higher overall mean score for the ATE Test than British learners in the study by Athayde (2009a), it is acknowledged that there was no statistical evidence to conclude that such a difference indeed exists. Proposition 8 (P8) could therefore not be accepted.
7 Conclusions
The statistical evidence presented in this research paper is sufficient to conclude that the ATE Test employed in this study had acceptable levels of construct validity (P1), reliability (P2) and relationships between the constructs of Leadership, Achievement, Personal control and Creativity (P3) to measure the entrepreneurial attitudes of Grade 10 learners.
Comparison of the differences in the mean values between constructs for demographic variables using t-tests and effect sizes (dvalues) produced statistically significant differences (p < 0.05) in a number of instances, but no visible effects (0.5 < d < 0.8) or practical significance (d > 0.8) to suggest that these differences have any effect in practise. It is therefore concluded that there is no practically significant difference in the entrepreneurial attitudes of Grade 10 learners in the Sedibeng District from the perspectives of gender (P4) and ethnic grouping (P5). On the positive side, this finding suggests that male and female learners from different ethnic groups may respond similarly to youth entrepreneurship development programmes.
Contrary to the findings of Athayde (2009a), two major concerns were highlighted in this research paper. Firstly, the study produced no evidence of a practically significant difference in the entrepreneurial attitudes of Grade 10 learners who had been exposed to entrepreneurial activity and those who had not participated in such activities (P6). Secondly, no practically significant difference could be determined between the entrepreneurial attitudes of learners with self-employed parents and those whose parents were not selfemployed (P7).
It is therefore concluded that catalytic factors, such as exposure to entrepreneurship at school and having self-employed parents, which should positively influence the attitudes of young people, have not had any practically significant effect on learners in the Sedibeng sample. Although the results of the empirical study indicated some exposure to entrepreneurship at school, it suggested that the scope and intensity of both experiential (such as selling goods at school or participating in an entrepreneur's day) and desk-based learning (such as having entrepreneurship as a school subject, attending entrepreneurship training or drafting a business plan) were neither focused nor deep enough to have any effect in practice. This finding re-emphasises the urgent need for tailor-made entrepreneurship training programmes in South African secondary schools.
In so far as the influence of self-employed parents in this study is concerned, the nature of self-employment was not qualified and no distinction was made between necessity and opportunity entrepreneurs. Accordingly, learners' perceptions of self-employment could have included anything from a street vendor to the chief executive officer (CEO) of a multinational organisation. The potential impact of a street vendor on the entrepreneurial attitude of a young learner remains debatable, and on the other hand, it should be considered that large firm CEOs may have lost their entrepreneurial flair by virtue of the corporate culture they manage. Although the ATE Test scores suggested that Sedibeng learners achieved a higher overall mean score than British learners in the study by Athayde (2009a), this study produced insufficient statistical evidence to conclude that there is indeed a difference between the entrepreneurial attitudes of Grade 10 learners in the Sedibeng sample and British learners with regard to the constructs of Leadership, Achievement, Creativity and Personal control (P8).
It can, however, be concluded that inconsistencies between the ATE Test scores of British learners (Athayde, 2009a) and the South African sample should be approached with due consideration for the differences in culture, socio-economic composition and educational approaches between the two countries.
8 Recommendations
The Enterprise Attitude Questionnaire, including the ATE Test, is recommended for further research on the entrepreneurial attitudes of young learners in South Africa, subject to a number ofrecommendations discussed below.
The sub-par Cronbach alphas presented in this study may have been caused by Sedibeng learners interpreting the statements in the ATE Test otherwise than British learners, due to differences in culture and educational approaches. Notwithstanding the concession by Field (2005:688), that instruments measuring 'attitudes' may have alphas lower than the customary 0.70 and still have acceptable levels of reliability, further refinement of the Enterprise Attitude Questionnaire may be required to attain optimum results for the South African environment.
The measuring instrument was administered in English and Afrikaans as the two languages of tuition in secondary schools included in the sample. As a starting point for future studies, researchers must ensure that respondents understand each concept and statement in the ATE Test in consideration for the quality of basic education and the vast array of languages and cultures in South Africa. It may even be necessary to test respondents' understanding of concepts, language and contextual meanings prior to administering the ATE Test. It might also be useful to carry out reliability and construct validity testing in each language, unless researchers are confident that learners indeed understand the meaning of each statement within context.
The perceived lack of focused entrepreneurship training in Sedibeng secondary schools made it impossible to employ a preand post-test control-group design in this study; hence, the possibility of self-selection by respondents cannot be excluded. Further studies using the Enterprise Attitude Questionnaire should therefore employ a preand post-test control-group design to increase the potential for focused entrepreneurship training to differentiate between participants and non-participants. Accordingly, respondents in future test groups must be subjected to entrepreneurial training after pre-testing but prior to post-testing against a control group in order to determine the real impact of entrepreneurial training on the attitudes of young South African learners.
In this study, the test scores of learners attending state schools were not compared with those of learners attending private schools. It is therefore recommended that pedagogical differences in sample schools be analysed in future studies, as Athayde (2009a: 495) found significant differences between the test scores of privately educated pupils and those at state schools.
Considering the high levels of poverty and socio-economic challenges in South Africa, it is suggested that a measure of socio-economic background be included as an additional demographic variable in future studies. Parents' occupation can be used as a proxy for this to examine the perception that individuals from higher socio-economic backgrounds consistently out-perform those from lower socio-economic backgrounds.
The role that self-employed parents have to test groups (one group exposed to play in the entrepreneurial intentions of their entrepreneurial training; the other with a selfchildren should also not be overlooked. Further employed entrepreneur as parent) for studies should firstly employ a measure to comparison against a control group with differentiate between entrepreneurial and non-neither one of these catalytic factors present. entrepreneurial self-employed parents, and This approach will enable researchers to secondly, secure the commitment of qualifying distinguish between the impact of either parents to transfer their skills and entrepreentrepreneurship training or having a selfneurial flair to their children. It may be employed entrepreneur as parent on the worthwhile to employ two mutually excluding entrepreneurial attitudes of young learners.
Endnotes
1 Intellectual Property Rights for the Attitude Toward Enterprise Test (ATE Test) belong to the Small Business Research Centre (SBRC) at Kingston University, London, United Kingdom.
References
AJZEN,I. 1991. The theory of planned behaviour. Organizational Behaviour and Human Decision Processes, 50(2):179-211. [ Links ]
ALLINSON, C.W., CHELL, E. & HAYES, J. 2000. Intuition and entrepreneurial behaviour. European Journal of Work and Organizational Psychology, 9(1):31-43. [ Links ]
ATHAYDE, R. 2004. Attitudes to enterprise test code. London: Small Business Research Centre, Kingston University. (Available from the author at r.athayde@kingston.ac.uk) (Email to: A. Steenekamp (andre@arcspray.co.za) 13 May 2009). [ Links ]
ATHAYDE, R. 2009a. Measuring enterprise potential in young people. Entrepreneurship Theory and Practice, 33(2):481-500. [ Links ]
ATHAYDE, R. 2009b. Briefing paper on ATE test. London: Small Business Research Centre, Kingston University. (Available from the author at r.athayde@kingston.ac.uk) (E-mail to A. Steenekamp (andre@arcspray.co.za) 13 May 2009). [ Links ]
BOTHA, M., NEMAN, G. & VAN VUUREN, J. 2007. Measuring the effectiveness of the Women Entrepreneurship Programme on potential, start-up and established women entrepreneurs in South Africa. South African Journal of Economic and Management Sciences, 10(2):163-183. [ Links ]
BURGER, L., O'NEILL, C. & MAHADEA, D. 2005. The impact of previous knowledge and experience on the entrepreneurial attitudes of Grade 12 learners. South African Journal of Education, 25(2):89-94. [ Links ]
BUYS, P. & HAVENGA, K. 2006. Entrepreneurial functionality of new venture creation learners. S A Journal of Human Resource Management, 4(3):36-43. [ Links ]
CAIRD, S. 1991. Testing enterprising tendency in occupational groups. British Journal of Management , 2(4):177-186. [ Links ]
COHEN, J. 1992. A power primer. Psychological Bulletin, 112(1):155-159. [ Links ]
CROMIE, S. 2000. Assessing entrepreneurial inclinations: some approaches and empirical evidence. European Journal of Work and Organizational Psychology, 9(1):7-30. [ Links ]
CROMIE, S. & JOHNS, S. 1983. Irish entrepreneurs: some personal characteristics. Journal of Occupational Behaviour, 4(4):317-324. [ Links ]
DOUGLAS, E.J. & SHEPHERD, D.A. 2002. Self-employment as a career choice: attitudes, entrepreneurial intentions and utility maximization. Entrepreneurship Theory and Practice, 26(3):81-90. [ Links ]
ELLIS, S.M. & STEYN, H.S. 2003. Practical significance (effect sizes) versus or in combination with statistical significance (p-values). Management Dynamics, 12(4):51-53. [ Links ]
FIELD, A. 2005. Discovering statistics using SPSS. London: Sage. [ Links ]
GARTNER, W.B. 1989. "Who is an entrepreneur?" is the wrong question. Entrepreneurship Theory and Practice, 13(4):47-68. [ Links ]
GIRD, A. & BAGRAIM, J.J. 2008. The theory of planned behaviour as predictor of entrepreneurial intent amongst final-year university students. South African Journal of Psychology, 38(4):711-724. [ Links ]
HERRINGTON, M. 2009. Positive signs. [Online] Available at: URL: http://www.gemconsortium.org/document.aspx?id=871 (Accessed 2009-03-06). [ Links ]
HERRINGTON, M., KEW, J. & KEW, P. 2009. Global Entrepreneurship Monitor South African report 2008. [Online] Available at: URL: http://www.gemconsortium.org/download/1266231703468/GEM2008 SouthAfricanReport_1 .pdf (Accessed 2010-02-13). [ Links ]
HISRICH, R.D. & BRUSH, C. 1986. Characteristics of the minority entrepreneur. Journal of Small Business Management, 24(4):1-8. [ Links ]
HONIG, B. 2004. Entrepreneurship education: toward a model of contingency-based business planning. Academy of Management Learning and Education, 3(3):258-273. [ Links ]
HORN, G. 2006. Educational solutions to improve the employability of senior high school learners. South African Journal of Education, 26(1):113-128. [ Links ]
ISAACS, E., VISSER, K., FRIEDRICH, C. & BRIJLAL, P. 2007. Entrepreneurship education and training at the Further Education and Training (FET) level in South Africa. South African Journal of Education , 27(4):613-629. [ Links ]
JOHNSTON, K.A., ANDERSEN, B.K., DAVIDGE-PITTS, J. & OSTENSEN-SAUNDERS, M. 2009. Identifying student potential for ICT entrepreneurship using Myers-Briggs personality type indicators. Journal of Information Technology Education, 8:29-43. [ Links ]
KROON, J., DE KLERK, S. & DIPPENAAR, A. 2003. Developing the next generation of potential entrepreneurs: co-operation between schools and businesses. South African Journal of Education, 23(4):319-322. [ Links ]
KRUEGER, N. 1993. The impact of prior entrepreneurial exposure on perceptions of new venture feasibility and desirability. Entrepreneurship Theory and Practice, 18(1):5-21. [ Links ]
KRUEGER, N.F. (Jr.) & BRAZEAL, D.V. 1994. Entrepreneurial potential and potential entrepreneurs. Entrepreneurship Theory and Practice, 18(3):91-104. [ Links ]
LEATT, A. 2006. Income poverty in South Africa. [Online] Available at: URL: http://www.ci.org.za/depts/ci/pubs/pdf/general/gauge2006/gauge2006_incomepoverty.pdf (Accessed 2009-05-13). [ Links ]
LEVIE, J., HART, M. & ANYADIKE-DANES, M. 2009. The effect of business or enterprise training on opportunity recognition and entrepreneurial skills of graduates and non-graduates in the UK. (Available from r.athayde@kingston.ac.uk) (E-mail to: A. Steenekamp (andre@arcspray.co.za) 26 Apr. 2010). [ Links ]
LITTUNEN, H. 2000. Entrepreneurship and the characteristics of the entrepreneurial personality. International Journal of Entrepreneurial Behaviour and Research, 6(6):295-309. [ Links ]
LiiTHJE, C. & FRANKE, N. 2003. The 'making' of an entrepreneur: testing a model of entrepreneurial intent among engineering students at MIT. R & D Management, 33(2):135-147. [ Links ]
MAAS, G. & HERRINGTON, M. 2007. Global entrepreneurship monitor South African report 2007. [Online] Available at: URL: http://www.gemconsortium.org/document.aspx?id=765 (Accessed 2010-03-06). [ Links ]
McCLINE, R.L., BHAT, S. & BAJ, P. 2000. Opportunity recognition: an exploratory investigation of a component of the entrepreneurial process in the context of the health care industry. Entrepreneurship Theory and Practice, 25(2):81-94. [ Links ]
MOEN, J.A., RAHMAN, I.H.A., SALLEH, M.F.M. & IBRAHIM, R. 2004. A study on entrepreneurial attitudes among youths in Malaysia: case study: Institute Kemahiran Belia Negara, Malaysia. Journal of American Academy of Business, Cambridge, 4(1/2):192-197, Mar. [ Links ]
NDEDI, A.A. 2009. Entrepreneurship training and job creation in South Africa: are tertiary institutions filling the gap? Journal of Contemporary Management, 6:441-462. [ Links ]
NORTH, E. 2002. A decade of entrepreneurship education in South Africa. South African Journal of Education, 22(1):24-27. [ Links ]
PETERMAN, N.E. & KENNEDY, J. 2003. Enterprise education: influencing students' perceptions of entrepreneurship. Entrepreneurship Theory and Practice, 28(2):129-144. [ Links ]
PETERSON, R.A. 1994. A meta-analysis of Cronbach's coefficient alpha. Journal of Consumer Research , 21(2):381-391. [ Links ]
ROBINSON, P.B., STIMPSON, D.V., HUEFNER, J.C. & HUNT, H.K. 1991. An attitude approach to the prediction of entrepreneurship. Entrepreneurship Theory and Practice, 15(4):13-31. [ Links ]
RYAN, C. 2006. Youth enterprise and sustainable livelihoods. Commonwealth Youth and Development , 4(2):58-70. [ Links ]
SANTOS, J.R.A. 1999. Cronbach's Alpha: a tool for assessing the reliability of scales. Journal of Extension , 37(2):1-4. [ Links ]
SEDIBENG (Sedibeng District Municipality, South Africa). 2008. Sedibeng annual report 2007-2008. [Online] Available at: URL: http://www.sedibeng.gov.za/keydocuments.html (Accessed 2010-05-10). [ Links ]
SMITH-HUNTER, A.E. & BOYD, R.L. 2004. Applying theories of entrepreneurship to a comparative analysis of white and minority women business owners. Women in Management Review, 19(1):18-28. [ Links ]
SPSS, Inc. 2008. SPSS® 16.0 for Windows, Release 16, Copyright© by SPSS Inc., Chicago, IL: SPSS. [ Links ]
STATSOFT, Inc. 2008. STATISTICA (Data Analysis Software System). Release 8. URL: http://www.statsoft.com. [ Links ]
STATS SA (Statistics South Africa). 2007. Labour force survey September 2007. (Statistical release, P0210). [Online] Available at: URL: http://www.statssa.gov.za/publications/P0210/P0210September2007.pdf (Accessed 2008-11-17). [ Links ]
STEYN, H.S. (Jr.) 2002. Practically significant relationships between two variables. SA Journal of Industrial Psychology, 28(3):10-15. [ Links ]
SWANEPOEL, E., STRYDOM, J.W. & NIEUWENHUIZEN, C. 2010. An empirical analysis of a private company's corporate social investment in SMME development in South Africa. Southern African Business Review, 14(1):58-78. [ Links ]
URBAN, B., VAN VUUREN, J.J. & OWEN, R.H. 2008. Antecedents to entrepreneurial intentions: testing for measurement invariance for cultural values, attitudes and self-efficacy beliefs across ethnic groups. S A Journal for Human Resource Management, 6(1):1-9. [ Links ]
UYF (Umsobomvu Youth Fund). 2004. Leading entrepreneurship education providers in South Africa. [Online] Available at: URL: http://www.uyf.org.za/ur/Entrepreneurship%20Education%20in%20South%20Africa.pdf (Accessed 2010-05-31). [ Links ]
VAN WYK, R. & BOSHOFF, A.B. 2004. Entrepreneurial attitudes: a distinction between two professional groups. South African Journal of Business Management, 35(2):33-38. [ Links ]
VAN WYK, R., BOSHOFF, A.B. & BESTER, C.L. 2003. Entrepreneurial attitudes: what are their sources? South African Journal of Economic and Management Sciences, 6(1):1-24. [ Links ]
Accepted June 2011

