


Services on Demand
Article
 English (pdf)
 Article in xml format
 Article references
Indicators

Related links
-
 Cited by Google
 -
 Similars in Google
Share

 Permalink
South African Journal of Economic and Management Sciences
On-line version ISSN 2222-3436
Print version ISSN 1015-8812
S. Afr. j. econ. manag. sci. vol.14 n.3 Pretoria Jan. 2011
The macroeconomic determinants of technological progress in Nigeria
Olusegun Ayodele Akanbi
Department of Economics, University of Pretoria
ABSTRACT
This study empirically examines the macroeconomic determinants of technological progress (total factor productivity) in Nigeria that is consistent with the endogenous growth theory. The estimations are carried out with time-series data from 1970 to 2006 using the Johansen estimation techniques. The study is distinct from most of the existing literature since it made an attempt in generating a time-varying technological progress. It employs the Kalman filter technique to determine the evolution of the Solow residual estimated from a Cobb-Douglas production function. The results conform to the existing literature that macroeconomic instability, the level of financial development, and the level of human development are highly significant determinants of technological progress in Nigeria.
Keywords: technological progress, macro determinants, kalman filter, cointegration, Nigeria
JEL: C13, 22, E23, O47
1 Introduction
The role played by total factor productivity in attaining sustainable economic growth and development is well recognised in the growth literature. A focus on achieving a rising growth in technology of any economy could be to a larger extent a driving force to increasing labour and capital employment of that economy. It is therefore, quite apparent that empirical research on technology performance is of great importance to the success of any country.
Based on the growth accounting literature, an economy's production function is explained by the inputs of labour and capital and any residual not explained by these inputs is considered as total factor productivity growth, which also measures technological progress broadly (Hayani, 2001). However, total factor productivity is a variable which accounts for effects in total output not caused by inputs. In the standard production function the constant parameter is regarded as total factor productivity, which can range from technology to human capital. This constant parameter has been measured mostly in the literature by the residual from the production function. Therefore, since technological progress is found to be one of the biggest components of total factor productivity, they can be used interchangeably.
Given the combination of factor inputs (labour and capital), the production function is increased by the improvement in productivity. The standard neoclassical growth models (i.e. Solow (1956), Ramsey (1928) and the overlapping generation models of Samuelson (1958)) see technological progress as exogenous in the long run growth determination. This line of thought has been challenged by the new growth theorists (i.e. Romer (1986) and Lucas (1988)), who consider technological progress as endogenous and the search for possible driving force. These possible factors have still not yet been established in the literature (Akinlo, 2006).
There is a large body of literature that has looked into the factors that determined technological progress across a number of countries. But there have been relatively few estimates of technological progress in Nigeria (i.e. Ogunleye & Ayeni (2008), Adenikinju (1998), and Okojie (1995)) and an attempt to explore the determinants of technological progress in Nigeria at the macroeconomic level has been rare. Akinlo (2006) explores the effects of macroeconomic factors on total factor productivity in 34 sub-Saharan African countries. Results from his panel econometric analysis shows that some macroeconomic variables (i.e. external debt, inflation and human capital) included in the estimation have a significant impact on productivity. Therefore, policies geared towards reducing the rate of debt accumulation, low inflation and improvement in human development will boost total factor productivity in the continent.
Other macroeconomic variables such as openness and trade orientation have been investigated by Miller and Upadhyay (2000) as potential determinants of total factor productivity in a panel of some developed and developing countries. Their results revealed that a higher level of openness and outwardoriented countries will experience a higher level of productivity. The level of human development is also found to have a positive and significant impact on productivity. Edwards (1998) and Gurney and Englander (1994) likewise suggest that more open economies will experience faster productivity growth.
Against this background, the aggregate determinants of productivity in an economy can be attributed to the level of macroeconomic stability, human development, the level of openness of the economy and the role which the financial sector plays in providing funds to the system. These factors, which have been investigated by Khan (2006) was found to have a robust and significant impact on total factor productivity. Following Khan (2006), this study attempts to establish the macro determinants of technological progress in Nigeria by incorporating the idea of endogenous growth theory. These factors are also identified as the level of macroeconomic instability, the country's financial development, and the level of human development. This idea is adopted since Nigeria and most developing economies still face these challenges in the race to achieving their developmental objectives.
The distinctive feature of this study is the attempt made in generating time-varying technological progress. A different approach is followed in this study by employing the Kalman filter technique to determine the evolution of the Solow residual estimated from a Cobb-Douglas production function. Existing studies on this issue have adopted the neoclassical growth accounting framework in measuring the growth in technology over time. This approach is based on the assumption that technological improvements are exogenously determined and grow at a constant rate over time. However, production models need to allow technology to improve over time in order to be able to explain growth in the presence of constant, increasing and decreasing returns to scale production structures.1
The results of the estimates are significant and consistent with theoretical expectation, revealing the impact of the selected factors on technological progress. Hence, the analysis tends to shed light on the direction which policy makers should take to improve productivity in the country.
The rest of the study is structured as follows. Section 2 presents some stylised facts on productivity performance in Nigeria while Section 3 analyses the sources of growth in the different major periods experienced by the country. Section 4 presents the empirical analysis, which contains the background of the production structure and technological progress in Nigeria, the theoretical model, the methodology and the description of the data used in the study. It also presents the estimation results. Section 5 concludes the study.
2 Nigeria's productivity performance: some stylised facts
This section presents the growth in productivity of labour and capital in Nigeria since 1970. Few basic trends have emerged over the past few decades with regards to the pattern of factor inputs growth.2
As shown in Figure 1, capital and labour productivity has been following a similar trend over the years since 1970. The average annual growth rate in productivity of about 3.5 per cent and 4 per cent were recorded for capital and labour respectively. With the exception of the outlier in 1973, the average annual growth in productivity of capital is found to be negative (0.5 per cent) while labour productivity recorded a positive growth of about 1 per cent in the same period.3 The outlier reflects the effects of the huge growth in GDP which was caused by the boom in oil revenue. However, the above facts indicate the low level of factor productivity in Nigeria over the past few decades as growth in productivity has been around zero in most years. However, is crucial to explore more deeply the nature and drivers of total factor productivity (technological progress) in Nigeria at this point. This analysis will enable policy makers to identify the optimal economic policy for long-term growth potential of the country.
3 Sources of economic growth: growth accounting exercise
The basic determinant of a country's economic performance and living standards is mainly that country's physical capacity to produce goods and services with its available quantity of inputs (factors of production). But a nation's output of goods and services does not only depend on the availability of its inputs (capital and labour) but also on the productivity of these inputs.
Empirical investigation of the various developed and newly industrialised economies for their sources of economic growth over a long period of time have shown explicitly how much the tangible inputs and their productivity have contributed to the long-term growth (Kim and Lau (1994), Lau and Park (2003), Tahari et.al. (2004), Senhadji (2000), and Dike (1995).
In an attempt to identify the structural changes that occurred in the Nigerian economy over the years, it is imperative to decompose the growth performance into its primary sources. The sources of the Nigerian economic growth from 1970 to 2006 is calculated according to the effectiveness with which capital and labour are used in the production process. The long run production function was estimated (under the assumption of constant returns to scale) with labour taking about 93 per cent share in total production while capital takes 7 per cent.
Following Solow (1956), a Cobb-Douglas production function using a constant return to scale technique was adopted in performing the simple growth accounting exercise.
To experience economic growth under the assumption of constant returns to scale, there must be growth in the accumulation of capital, labour and total factor productivity (technological progress). The growth accounting equation states that output growth is equal to the weighted sum of capital and labour growth, plus the growth in total factor productivity or technology. This is presented as:
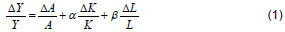
where  is the contribution of total factor productivity to output growth,
  is the contribution of capital to output growth and
  is the contribution of labour to the growth in output. The above equation is called the of total factor productivity to output growth can be derived from the equation since the growth rate of output, capital and labour are known. This is also called the Solow residuals, which is that portion of growth left unaccounted for by increases in capital and labour4.
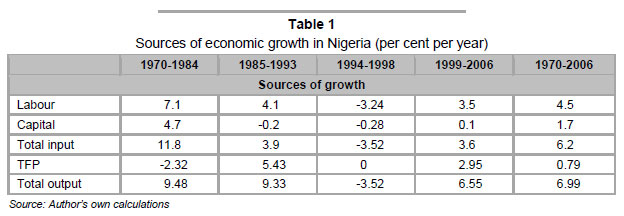
By applying the growth accounting equation to decompose the sources of economic growth in Nigeria from 1970 to 2006, Table 1 presents the results of this analysis in four major periods experienced by the country5:
• The pre-Structural Adjustment Programme (SAP) [1970-1984].
• The SAP era [1985-1993].
• The period ofderegulation [1994-1998].
• The return to democratic dispensation [1999-2006].
The long-term parameter estimates for labour (0.93) and capital (0.07) are used in decomposing the sources of growth for the four major periods.
Table 1 gives the summary of the findings of what growth accounting says about the sources of Nigeria economic growth. Over the period 1970-2006, the country's total output grew at an average rate of about 7 per cent per year. The contribution of labour to total output growth accounted for about 4.5 per cent per year. This may be due to the huge population of the country and the fact that more than one third of the population are in the labour force. Likewise is the high rate of the informal sector participation rate in the country, which may have contributed to labour taking a large share of the economic activities. However, the contribution of capital stock to output growth during this period is accounted to be 1.7 per cent per year. Therefore, combining the contribution of labour and capital gives the total inputs contribution which accounted for 6.2 per cent per year. Taking the difference between the total output growth (6.99%) and the contribution of total inputs (6.2%) gives 0.79 per cent, which represents the total factor productivity (technological progress) per year. These results are similar to the findings by Dike (1995) and Senhadji (2000).
The breakdown of the data into 4 different periods as mentioned above explains in more details how the long-run sources of growth in Nigeria were achieved. Column (3) represents the SAP (1985-1993) period in Nigeria, and the contribution of capital stock to the total output growth during this period is found to be negative, while the average total growth for the period of deregulation is found to be negative. These are periods associated with continuous military rule, which coincided with huge mismanagement of the country's resources. In these periods not much capital investment (capital expenditures) could be made in the economy, but the return to a democratic dispensation since 1999 has improved the country's economic performance, and the contribution of capital stock to economic growth has increased by about 0.4 per cent from the previous period.
The period between 1970 and 1984 recorded about 9.5 per cent growth in total output per year but this was accompanied by a slowdown in productivity during this period. This was not really a surprise since empirical evidence has also revealed that most countries (especially the US) experienced a slowdown in its productivity almost at the same period. Although, no one is certain about the cause of the slowdown, many empirical studies related to the U.S economy (Baily & Gordon, (1988); Denison, (1985); Bishop, (1989); Nordhaus, (1982); Baily, (1982); Jorgenson, (1990); Greenwood & Yorukoglu, (1997); and Hobijn & Jovanovic, (2001)) have suggested some alternatives associated with measurement error, legal and human environment, technological depletion and slow commercial adaptation, oil price, and the beginning of a new industrial revolution. Some of these explanations may also be attributed in the case of Nigeria; one cannot debunk the possibility of these causes of slowdown in productivity, but may rather say that there are many factors that have contributed to it.
In the long-run, the sources of economic growth again confirm that productivity from labour and capital has been very low over the years. This gives an indication of why the level of human development has been deteriorating in Nigeria, which can have an adverse effect on the rate of productivity growth in the economy (Abel & Bernanke, 2005:215). Despite rising economic growth since 1999, real per capita income as at 2005 was about N1800 (local currency unit) which is similar to the 1970s level. This is a serious indication that the country is just breaking through from its past economic bondage of corruption and mismanagement but still facing a serious problem of severe poverty among its citizens.
4 Empirical analysis
4.1 Background: the production structure and technological progress
An attempt is made to model the Nigerian production function by employing the statespace model (Kalman filter) to determine the evolution of the Solow residual that is estimated from a simple Cobb-Douglas production function. The state-space model regained its popularity in the economic literature during the 1980s (i.e Lawson, (1980); Harvey, (1987)) and the development of these models were first seen in Wiener, (1949) and Kalman, (1960) who were control engineers in the technology of radar and aircraft.
The application of the state-space model with stochastically time-varying parameters (constant coefficient of the technological progress in the Cobb-Douglas production function is allowed to vary over time) is adopted in this study in order to endogenise technological progress. This technique differs and hence may be a better approximation than the conventional OLS estimation which uses the residual as a proxy for technology.
An extensive econometrics application of the state-space models can be found in Hamilton (1994:372-408).
The dynamic representation of the statespace model of a (nx1) vector y t , is given by the following system of equations:
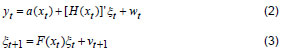
where a(xt) describes an (n x 1) vector-value function, H(xt) an (rxn) matrix-value function, and F(xt) denotes a (rxr) matrix whose elements are a function of xt,  is a (rx1) vector of unobserved state variables (i.e state vector). The (nx1) and (rx1) disturbance vectors wt and vt are assumed to be independent white noise. The first equation is known as the observation (or measurement) equation and the second is known as the state (or transition) equation.
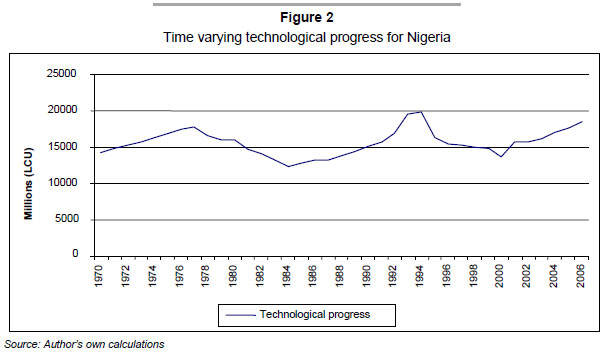
The role played by technology in the growth process of a nation cannot be undermined. Technology has been seen as a catalyst to any country's economic transformation. The assumption that technological progress occurs at a constant rate is very common in the growth literature (especially the exogenous growth theory). This may not be a very realistic assumption. A time varying technological progress generated in this study using the Kalman filter procedure reveals the weakness of this assumption.
Figure 2 shows the upward and downward trend in the evolution of technology in Nigeria. Visual exposition revealed on average a similar trend with the technology from the growth accounting exercise calculated for each period as explained in the previous section.
4.2 The model
Existing theory on productivity growth (technological progress) has not provided a particular specification in determining the drivers of total factor productivity for an economy (Akinlo, 2006). Endogenising technological progress has not been very popular in the economic literature over the years. There is a large body of empirical literature that tends to explain the process of growth in a single or cross-country setting, but very little evidence has been found with respect to total factor productivity (Senhadji, 2000). In line with the endogenous growth theory, the problem of how best to represent technological progress was investigated by Budd and Hobbis (1989) who applied their analysis to the UK production function. Two main sources of technological advances were identified in their paper: (i) through domestic research effort; (ii) importing new technology from abroad. As mentioned earlier, Khan (2006) investigated the macro determinants of total factor productivity in Pakistan. These determinants are broadly categorised into macroeconomic stability, human resource development and financial sector development.6
It is expected that Research & Development (R&D) will go a long way towards boosting technology. More important, is the extent of macroeconomic stability playing a huge role in R&D. However, due to data limitation, the R&D factor in long-term technology specification could be captured by the level of macroeconomic stability as investigated in Khan (2006). In addition, the budget balance will also be an important determining factor in the long-term technological progress, but this effect could be broadly captured from the financial development activities as the level of gross savings and changes in reserves will have a great impact.7
As mentioned earlier, this study concentrates on the macroeconomic determinants of technological progress in Nigeria. Therefore, it does not debunk the fact that some institutional variables (i.e. political instability in the case of Nigeria) may also have a huge impact in the long run.
Against this background, which is in line with the new growth theory, Nigerian technological progress (tfp) is specified based on the standard Romer (1990) framework:
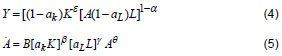
Therefore,

where mst a form of macroeconomic stability which is proxied by consumer prices (CPI), is the human development variable which is proxy by poverty level (povertydindex), fdt represent the level of financial develop-ment (finconstr).8 These variables are expected to influence the growth of technology in Nigeria since most developing economies are characterised by these factors. An in-creasing level of macroeconomic instability which could be reflected in the rise in price level will have a negative impact on aggregate technology. Likewise, will a rise in the level of poverty impact on the country's technological advancement. A positive development in the financial sector (i.e. availability of credit) will boost the aggregate technology in the country.
4.3 Methodology and data
This study modelled the Nigerian technological progress following Khan (2006). In line with the Johansen (1988) cointegration estimation technique, the reduced form Vector Autoregression (VAR) of Equation (6) is respecified as:

where Xt is a vector of variables:

Cholesky decomposition is utilised for orthogonalisation, which means that the Cholesky factor is lowered triangular. Therefore, the technological progress variable will be contemporaneously affected by all the other variables. The need to have a meaningful impulse-response function from the Vector Error Correction Model (VECM) is dictated based on the ordering ofthe variables.
Based on the relationship that is captured in the long-run by the technology model specified in Equation (8), a VECM of the following form is estimated to see the short-run dynamics in the technological progress function.
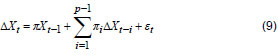
The procedure used in estimation can be explained as follows. Firstly, the reduced form VAR in Equation (8) is estimated and all the diagnostic tests are performed. Secondly, the Johansen cointegration test is performed and the cointegrating vectors and loading matrices are identified. Thirdly, a VECM from Equation (9) is estimated and the entire diagnostic tests are performed.9 Lastly, impulse responses analyses are performed.
All the data used in this study were obtained from the IMF (International Financial Statistics), World Bank database: African Development Indicators and World Development Indicators, and the Central Bank of Nigeria Statistical Bulletin. Annual data series which cover the period 1970-2006 were used to estimate the parameters of the model and where appropriate the variables were transformed into real figures using the GDP deflator (2000 = base year). All the data used in the estimation process are in their natural logarithm form (ln). Graphical exposition ofall the data used in the study and their order of integration are presented in the Appendix.
In addition to the technological progress series generated, there is still a lack of availability of some time series data. Therefore, the following time series had to be derived for the variables used in the model:
Financing of gross domestic investment (financial constraint)
In a general equilibrium framework (i.e. system of national account), the financing of gross domestic investment equals total gross domestic investment (Du Toit, 1999). Therefore, the financial constraint variable is defined as an identity which enters into the system of equations in the form:
Financial constraint = gross domestic
savings + capital flows + changes in
reserves + depreciation value
This variable captures the financial sector development of the economy.
Rate of depreciation
The rate of depreciation can take different values for an individual country depending on the structure of that particular economy. In general, it is common to assign a higher rate of depreciation to developing or low-income countries. A higher depreciation rate of 20 per cent is adopted in this study since Nigeria allocates much lower revenues to maintenance expenditures (see Bayraktar and Fofack (2007), Beddies (1999), and Vera-Martin (1999)).
Poverty indexThere are multiple dimensions of the measurement of poverty in the literature. The poor are generally classified as those without an adequate income or expenditure to cover their basic necessities. An index of poverty is derived for this study following the basic Foster-Greer-Torbecke (FGT) indices as this is one of the most commonly used poverty indices in the literature.10 This measure has three components: (a) the incidence of poverty, which shows the share of the population that are below the poverty line, (b) the depth of poverty, which shows how far the households are from the poverty line, and (c) the severity of poverty which relates to the distance separating the poorest households from the poverty line. These indices are calculated as follows:
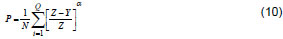
where N = Population, Q = % of population living below poverty line (Proxy = Poor population), Z = Poverty line (World Bank estimate), Y = Household Final Consumption Expenditure per capita, α = Poverty aversion parameter. α =0,1,2 for absolute, depth and severity of poverty respectively.
Since the incidence of poverty measures absolute poverty in an economy, this study adopted the depth of poverty as a measure of poverty gap.
Capital stock
In the model, capital stock is derived through a perpetual inventory method. This means that the current stock of capital is equal to the investment in the previous period plus stock of capital from the previous period, net of depreciation. This is shown as:

where Kt is the capital stock, It is the gross domestic investment, and  is the rate of depreciation.
Since the initial stock of capital is very important and this is not known, it is assumed to be about 1.5 of the gross domestic product for that particular period.
Labour employment
Due to lack of time series data on labour employment/unemployment and on any labour market variables (both formal and informal), labour employment is generated based on the activities in the labour force. Since a percentage of the labour force participates in the labour market, labour employment is derived as:
Employment (
) = Labour Force
Participation Rate (LFPR) x Labour Force
The LFPR on average is about 67 per cent per annum indicating about 33 per cent average unemployment in the country.
4.4 Estimation results
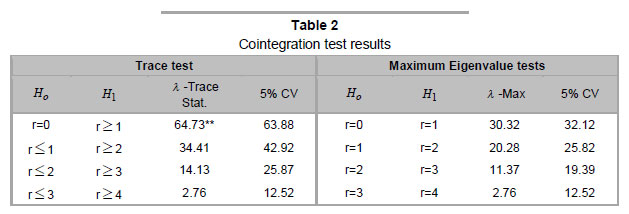
Based on the nature of the Data Generating Process (DGP) of all the variables, an appropriate model for technological progress in Nigeria is selected and the results of the trace and maximum eigenvalue tests are presented in Table 2. Following the Pantula principle of testing which version of the deterministic component should be used, the trace test identified one cointegrating vector while the maximum eigenvalue test found no cointegration for a model with trend and intercept in the cointegrating equation.
Using the cointegrating vectors from the trace test, the long-run part of the VECM is presented in Equation (12). The long-run cointegrating vector identified the technological progress which is the equation of interest in this study.
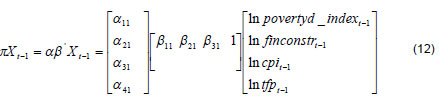
The estimated long-run technological progress equation is presented in Equation (11) with t-values in parentheses.

The entire coefficients are statistically and economically significant and are consistent with the theoretical specification in Equation (6). The results from the core specification confirm that macroeconomic instability, the level of financial development, and the level of human development are highly significant determinants of technological progress in Nigeria. The ' trend,' variable captures the possible upward trend in the time varying technological progress.
The general price level is consistent with the existing literature and implies that a 1 per cent increase in price level will lead to about 0.6 per cent decline in technology. The results shows that a rise in the level of financial development (i.e. a stronger financial system and availability of credit) by 1 per cent will lead to about 0.2 per cent rise in the level of aggregate technology in the country. The rise (5.22) in the level of poverty by 1 per cent causes aggregate technology to decline by about 1.3 per cent. The positive time trend in the longrun equation means that there was a general trend for technology to rise during the period 1970 to 2006. The magnitude ofthe coefficient of the human development sector reveals the importance of this sector in improving the level of productivity in the country.
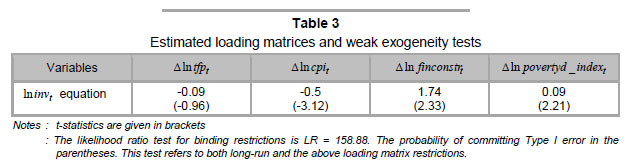
Table 3 presents the short-run adjustment coefficient (α values or loading matrices) which shows the dynamic adjustment towards the long-run equilibrium path. As expected, the α values from the error correction estimates are all within the 0 to 2 range implying that all the cointegrating vectors enter into the shortrun determination of the Nigerian technological progress, and therefore they can be regarded as not being weakly exogenous (Ender, 2004:370).
The positive and significant signs of the loading factors in both the financial and human development variables show that they tend to push the system away from its long-run equilibrium path. The technological progress and consumer price variables are found to be negative but insignificant in the former (tending to bring the system back to equilibrium). This implies that the price level plays a significant role in returning the longrun technological progress back to its equilibrium path.
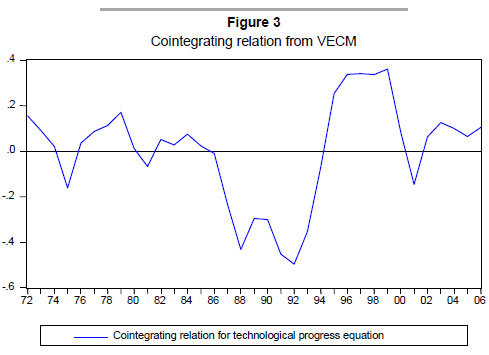
The graph of the estimated cointegrating relation in Equation (10) from the VECM is presented in Figure 3 below. The cointegrating relation is found to be appropriate since the graph reverts to equilibrium (zero).
Impulse-response functions
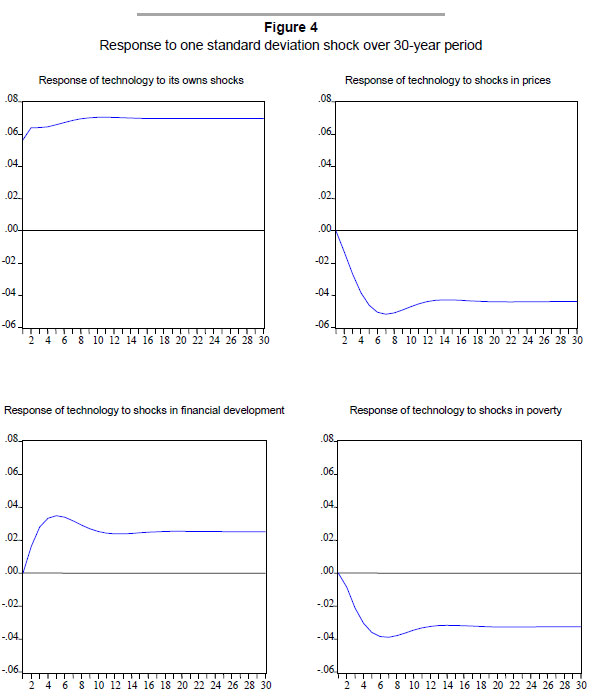
Based on the dynamic (lag) structure of the VAR, a shock to the i-th variable will not only directly affect the i-th variable but will also be transmitted to all the endogenous variables in the system. The impulse response reveals the effect of a one time shock to one of the innovations on current and future values of the endogenous variables. Using the othorgonalised Cholesky decomposition, the impulse responses are derived from the VECM as presented in Figure 4.
Figure 4 presents the responses of technology to a one standard deviation shock in the exogenous variables. The response of technology to its own shocks causes an upward revision of the forecast of technology over the 30-year period.
It is expected that technological progress declines as the level of macroeconomic instability rises. Macroeconomic stability plays a significant role in the determination of technology as revealed from a one standard deviation shock in the general price level. This led to a permanent fall in technology over the 30-year period.
A one standard deviation positive shock in the level of financial development causes technology to rise over the 30-year horizon and as the level of human development deteriorates (rise in poverty) by one standard deviation, the level of technology declines over the same horizon.
However, this confirmed the importance of the variables included in the VECM in explaining the movement in technology (factor productivity) in Nigeria over the years.
5 Conclusion
The aim of this study is to secure the macroeconomic determinants of technological progress in Nigeria. The idea of endogenous growth theory was adopted as the most suitable for estimating technology since it incorporates the human development sector as one of the drivers of economic growth.
The results from the study confirm that macroeconomic instability, the level of financial development, and the level of human development are highly significant determinants of technological progress in Nigeria. This is in line with the existing literature.
These results have critical policy implications if an increased productive capacity and future growth in technology are to be achieved in the Nigerian economy. There is an urgent need for policy makers to direct economic policies towards achieving a stable macroeconomic environment. The political environment needed to be more secure in order to attract private investment. The creation of access to credit facilities for both individuals and firms would not only enhance economic growth but also contribute significantly to the aggregate level of productivity in the economy (Khan, 2006).
Future research should attempt to correct some of the shortcomings of this study. The lack of available long-time series on most of the variables used can be overcome in the future and this may give a better parameter estimate of the effect of macroeconomic variables on aggregate productivity in the country.
Endnotes
1 Detailed review of the measurement and interpretation of total factor productivity can be found in Mahadevan (2003).
2 Labour and capital productivity are derived as the ratio of real GDP to employment and the ratio of real GDP to real capital stock respectively.
3 Labour productivity is expected to have been lower if accurate data on employment are available. See data description for detailed analysis.
4 Detailed explanations of the variables used are presented in the data description.
5 These periods can be regarded as crucial periods in the evolution of the Nigerian economy.
6 The structure of the Nigerian economy is closer to the Pakistan economy than to that of the UK.
7 See data description on financing of gross domestic investment.
8 The rate of openness is excluded from the specification since the country has not benefited much from the external sector. Over 95 per cent of its exports come from crude oil, while many of its imports are finished goods. This indicates a nondiversified economy. Therefore, openness as a variable is found to be insignificant and could not provide a correct a priori sign in the estimation process.
9 All the diagnostic tests performed are presented in the Appendix.
10 See Louw, (2008) for detailed analyses of poverty measures and indices.
References
ABEL, A.B. & BERNANKE, B.S. 2005. Macroeconomics (5thed.). New York: Pearson Education Inc. [ Links ]
ADENIKINJU, A. 1998. Productivity growth and energy consumption in the Nigerian manufacturing sector: apanel data analysis. Energy Policy, 26(3):199-205. [ Links ]
AKINLO, A.E. 2006. Macroeconomic factors and total factor productivity in sub-Saharan African countries. International Research Journal of Finance and Economics, 1:62-79. [ Links ]
BAILY, M.N. & GORDON, R.J. 1988. The productivity slowdown, measurement issues, and the explosion of computer power. Brookings Papers on Economic Activity, 2:347-420. [ Links ]
BAILY, M.N. 1982. Productivity and the services of capital and labour. Brookings Papers on Economic Activity, 2:423-54. [ Links ]
BAYRAKTAR, N. & FOFACK, H. 2007. Specification of investment functions in Sub-Saharan Africa. World Bank Policy Research Working Paper, No .4171. [ Links ]
BEDDIES, C.H. 1999. Investment, capital accumulation, and growth: some evidence from Gambia 1964-1998. IMF Working Paper, No. 99/117. [ Links ]
BISHOP, J.H. 1989. Is the test score decline responsible for the productivity growth decline? American Economic Review, 79(1):178-97. [ Links ]
BUDD, A. & HOBBIS, S. 1989. Cointegration, technology and the long-run production function. Centre for Economic Forecasting Discussion Paper . [ Links ]
DENISON, E. 1985. Trends in American economic growth. 1929-1982. Brookings Institute, Washington, DC. [ Links ]
DIKE, E. 1995. Sources of long-run economic growth in Nigeria: A study in growth accounting. African Development Revie , 7(1):76-87. [ Links ]
DU TOIT, C., KOEKEMOER, R. & GROUND, M. 2008. Estimating technological progress for South Africa. Unpublished. Department of Economics, University of Pretoria. [ Links ]
DU TOIT, C.B. 1999. A supply-side model of the South African economy: critical policy implications. Unpublished Doctoral thesis. Pretoria: University of Pretoria. [ Links ]
EDWARDS, S. 1998. Openness, productivity and growth: what do we really know? The Economic Journal , 108:383-398. [ Links ]
ENDERS W. 2004. Applied econometric time series. (2nded.) New York: John Wiley and Sons. [ Links ]
GREENWOOD, J. & YORUKOGLU, M. 1997. "1974". Carnegie-Rochester Conference Series on Public Policy, 46:49-95. [ Links ]
GURNEY, A. & ENGLANDER, A.S. 1994. Medium-term determinants of OECD productivity. OEC D Economic Studies, 22 (Spring):49-60. [ Links ]
HAMILTON, J.D. 1994. Time series analysis. United Kingdom: Princeton University Press. [ Links ]
HARVEY, A.C. 1987. Applications of the Kalman filter in econometrics, in Bewley, T.F. (ed.). Advances in econometrics, 5th World Congress, Vol.1, Econometric Society Monograph No.13, Cambridge University Press, Cambridge. [ Links ]
HAYANI, Y. 2001. Development economics, from poverty to the wealth of nations. (2nded) Oxford University Press, 140-142. [ Links ]
HOBIJN, B. & JOVANOVIC, B. 2001. The information technology revolution and the stock market: preliminary evidence. American Economic Review, 91(5):1203-20. [ Links ]
JOHANSEN, S. 1988. Statistical analysis of cointegration vectors. Journal of Economic Dynamics and Control, 12:231-54. [ Links ]
JORGENSON, D. 1990. Productivity and economic growth, in E. Berndt and J. Trilett (eds.) Fifty years o f economic measurement, Chicago: University of Chicago Press. [ Links ]
KALMAN, R.E. 1960. A new approach to linear filtering and prediction problems. Journal of Basic Engineering, Transition of the ASME series D, 82:35-45. [ Links ]
KHAN, S.U. 2006. Macro determinants of total factor productivity in Pakistan. State Bank of Pakistan Research Bulletin, 2(2):383-401. [ Links ]
KIM, J.I. & LAU L.J. 1994. The sources of economic growth of the East Asian newly industrialized countries. Journal of Japanese International Economics, 8:235-271. [ Links ]
LAU L.J. & PARK, J. 2003. The sources of East Asian economic growth revisited. Paper presented at the Conference on International and Development Economics in Honor Henry, Y. Wan, Jr., Cornell University, Ithaca, September:6-7. [ Links ]
LAWSON, T. 1980. Adaptive expectations and uncertainty. Review of Economic Studies, 47(2):305-320. [ Links ]
LOUW, J. 2008. Linking poverty indices to the macroeconomy: a case for South Africa. Unpublished Masters thesis. Pretoria: University of Pretoria. [ Links ]
LUCAS, R.E. 1988. On the mechanics of economic development. Journal of Monetary Economics, 22:3-42. [ Links ]
MAHADEVAN, R. 2003. To measure or not to measure TFP growth? Oxford Development Studies, 31:365-378. [ Links ]
MILLER, S.M. & UPADHYAY, M.P. 2000. The effects of openness, trade orientation, and human capital on total factor productivity. Journal of Development Economics, 63:399-423. [ Links ]
NORDHAUS, W. 1982. Economic policy in the face of declining productivity growth. European Economic Review, 72(2):131-58. [ Links ]
OGUNLEYE, E. & AYENI, R. 2008. The link between export and total factor productivity: Evidence from Nigeria. International Research Journal of Finance and Economics, 22:83-91. [ Links ]
OKOJIE, C.E. 1995. Human capital investment for productivity growth in Nigeria. The Nigerian Economic and Financial Review, 1(1):43-68. [ Links ]
RAMSEY, F.P. 1928. A mathematical theory of saving. Economic Journal, 38:543-49. [ Links ]
ROMER, P.M. 1990. Endogenous technological change. Journal of Political Economy, 98(5):71-102. [ Links ]
ROMER, P.M. 1986. Increasing returns and long-run growth. Journal of Political Economy, 94(5):1002-37. [ Links ]
SAID, S. & DICKEY, D. 1984. Testing for unit roots in autoregressive-moving average models with unknown order. Biometrical, 71:599-607. [ Links ]
SAMUELSON, P.A. 1958. An exact consumption-loan model of interest with or without the social contrivance of money. Journal of Political Economy, 66:467-482. [ Links ]
SENHADJI, A. 2000. Sources of economic growth: an extensive growth accounting exercise. Internationa l Monetary Fund Staff Papers, 47(1): 129-58. [ Links ]
SOLOW, R.M. 1956. A contribution to the theory of economic growth. Quarterly Journal of Economics , 70(2):65-94. [ Links ]
TAHARI, A., GHURA, D., AKINTOBY,B. & AKA, E.B. 2004. Sources of growth in Sub-Saharan Africa. International Monetary Fund Working Papers, No.176. Washington DC. [ Links ]
VERA-MARTIN, M. 1999. Long-run growth in Mali, Niger and Senegal. Unpublished. IMF, Washington [ Links ]
Accepted May 2011

