


Servicios Personalizados
Articulo
 Inglés (pdf)
 Articulo en XML
 Referencias del artículo
Indicadores

Links relacionados
-
 Citado por Google
 -
 Similares en Google
Compartir

 Permalink
South African Journal of Economic and Management Sciences
versión On-line ISSN 2222-3436
versión impresa ISSN 1015-8812
S. Afr. j. econ. manag. sci. vol.14 no.3 Pretoria ene. 2011
A comparison of inflation expectations and inflation credibility in South Africa: results from survey data
Jannie RossouwI; Vishnu PadayacheeII; Adel BoschIII
ISA Reserve Bank and Department of Economics, University of Pretoria
IISchool of Development Studies, University of KwaZulu-Natal; and Fellow, Stellenbosch Institute for Advanced Study (STIAS), Wallenberg Research Centre, Stellenbosch University
IIISA Reserve Bank
ABSTRACT
This paper reports a comparison of South African household inflation expectations and inflation credibility surveys undertaken in 2006 and 2008. It tests for possible feed-through between inflation credibility and inflation expectations. It supplements earlier research that focused only on the 2006 survey results. The comparison shows that inflation expectations differed between different income groups in both 2006 and 2008. Inflation credibility differed between male and female respondents, but this difference did not feed through to inflation expectations.
More periodic survey data will be required for developing final conclusions on the possibility of feedthrough effects. To this end the structure of credibility surveys should be reconsidered, as a large percentage of respondents indicated that they 'don't know' whether the historic rate of inflation is an accurate indication of price increases.
Keywords: inflation, inflation credibility, inflation expectations, inflation surveys, multinomial analysis
JEL: E3, 52, 58
1 Introduction
An earlier paper (Rossouw et al., 2009) assessed South African inflation expectation and inflation credibility surveys undertaken among households in 2006 and tested a hypothesis that inflation expectations and inflation credibility do not vary between gender, population group, age and other characteristics. The main finding was that female respondents recorded a lower degree of acceptance of the credibility of historic inflation figures than male respondents, but that this difference did not feed into inflation expectations. This paper expands on earlier research in that it includes the results of additional sample years and expands on the characteristics explaining inflation expectations and inflation credibility by means of a logit framework and a multinomial model. This paper tests a hypothesis that subcategories of households in the surveys exhibit the same linkages between inflation expectations and inflation credibility in 2006 and in 2008. Although preliminary conclusions can be drawn, additional surveys have to be undertaken over time before any time series conclusions will emerge.
This paper summarises in Section 2 the literature on inflation expectations and inflation credibility among individual respondents in inflation-targeting countries. Section 3 highlights South African surveys of inflation expectations and inflation credibility among individual respondents. The surveys are compared and analysed in Section 4. The conclusions are contained in Section 5.
2 Summary of literature on inflation expectations and inflation credibility1
This paper draws a distinction between inflation expectations and inflation credibility. Inflation expectations are used to describe and/or report views on the expected future trend and movement in price levels and, therefore, inflation. In this paper inflation credibility is used to describe and/or report views on past price-level movements and historic inflation, rather than to describe the credibility of monetary policy actions of central banks, as it is often used in the literature (see Mishkin, 2004).
In addition, forward-looking inflation expectations in themselves are somewhat problematic, as these are sometimes also referred to as inflation forecasts. Any distinction between inflation expectations and inflation forecasts is not immediately obvious. The former generally is regarded as subjective surveys of future inflation, while the latter is regarded as calculations of future inflation based on economic or econometric models (see for instance Collins English Dictionary, 2000, which describes expectation as anticipate and forecast as calculate). This paper attaches the same meaning to inflation expectations and inflation forecasts, as any possible differences are unimportant for this analysis.
Inflation expectations receive considerable attention in the inflation reports of central banks in inflation-targeting countries (see for instance Banco Central de Chile, 2008; SA Reserve Bank, 2008; or Sveriges Riksbank, 2008) and other literature (see for instance Berk, 1999; Forsells & Kenny, 2002; Mankiw, et al., 2003; Powers, 2005; or Samuels 1967).
It is somewhat surprising to find that the available literature pays little attention to the approaches followed in inflation-targeting countries to measure inflation expectations, given the considerable attention focused on the results of such expectations. While Fracasso et al. (2003) and the Bank of Iceland (2003) compared the monetary policy reports of twenty central banks in terms of clarity of assumptions, inflation forecasts, monetary policy decision-making process, quality of information and quantity of information, they did not assess the methodology used to obtain inflation forecasts or expectations. Likewise, Blinder et al. (2008) and Leeper (2003) assess various aspects of inflation targeting, but do not mention surveys or other techniques employed by central banks to obtain data on inflation expectations. Literature dealing with the communication strategies of central banks (see for instance Bank for International Settlements, 2008; Blinder & Wyplosz, 2005; or Ehrmann & Fratzscher, 2005) does not analyse inflation expectations of different groups in inflation-targeting countries.
The credibility of inflation figures receives little attention in inflation-targeting countries and, therefore, in the academic literature. Only New Zealand and Sweden officially survey inflation credibility (Brachinger, 2005; Jonung, 1981; Palmqvist & Stromberg, 2004; and Reserve Bank of New Zealand, [S.a.]), while representative inflation credibility surveys were undertaken independently in South Africa twice before, in 2006 and 2008 (see Rossouw, 2008; or Rossouw et al., 2009 for discussions of the first of these surveys). The international experience of differences in the credibility of inflation figures between male and female respondents was confirmed by the South African surveys (see for instance Rossouw, 2008; or Rossouw et al., 2009). These surveys are discussed and compared to South African inflation expectations surveys in the next section ofthis paper.
3 South African surveys of inflation expectations and inflation credibility among individual respondents
The SA Reserve Bank (the Bank) uses the Bureau for Economic Research (BER) to conduct quarterly inflation expectation surveys among households on its behalf (Kershoff, 2000). Household survey results are not published in the Bank's bi-annual Monetary Policy Review (see for instance SA Reserve Bank, 2008), but are published by the BER. The Bank publishes only inflation forecasts of financial market analysts, trade unionists and business enterprises, and inflation expectations calculated from interest rate differentials on different classes of traded assets. The BER uses AC Nielsen to survey individual responses through face-to-face interviews on its behalf as part of omnibus surveys.2 This approach ensures a representative survey, which would not be possible by means of telephone or postal surveys (National Gambling Board, 2005). This paper reviews only survey results for the fourth quarters of 2006 and 2008, thereby aligning it to the two domestic biennial surveys of inflation credibility undertaken during the same periods.
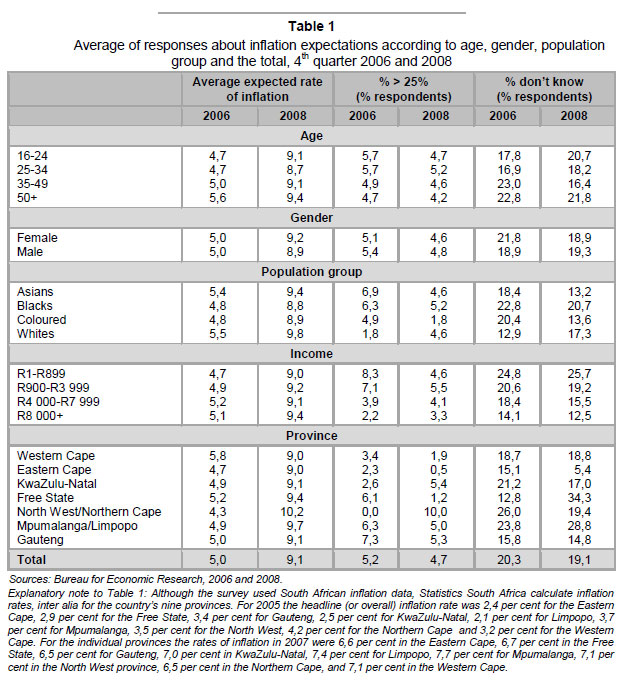
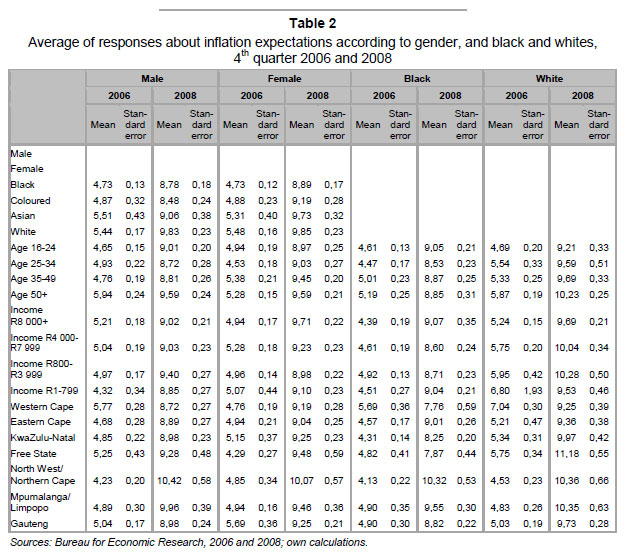
AC Nielsen interviews 2 500 individual respondents. These interviews cover black and white respondents in metropolitan areas, cities, towns and villages, and Asian and coloured respondents in metropolitan areas.3 In each instance average responses exclude the views of respondents who stated that they 'don't know' what the rate of inflation will be and expectations of an inflation rate exceeding 25 per cent. The survey results of the overall and sub-samples for the fourth quarters of 2006 and 2008 are highlighted in Table 1 and Table 2. Inflation credibility among representative samples of individual South African respondents was independently surveyed twice before, in the fourth quarters of 2006 and 2008. Similar challenges as those facing the BER had to be overcome to ensure representative surveys of individual respondents. These difficulties were overcome by using Ipsos-Markinor (known as Markinor at the time of the research undertaken in 2006) for the surveys. Ipsos-Markinor conducts biannual omnibus surveys of individual respondents by means of personal interviews. At a cost, additional questions can be added to these surveys. These surveys cover 3 5004 respondents and results can be disaggregated in terms of gender, income, employment status, etc.
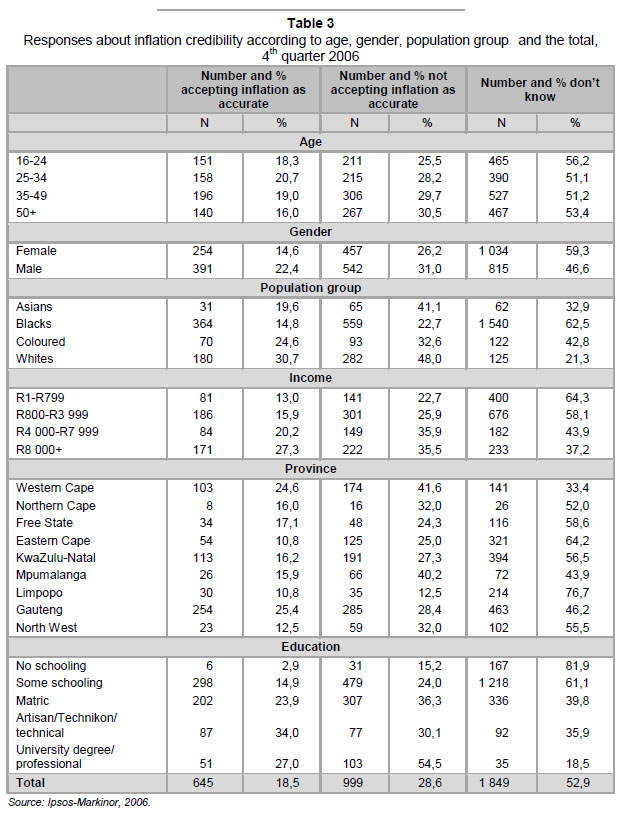
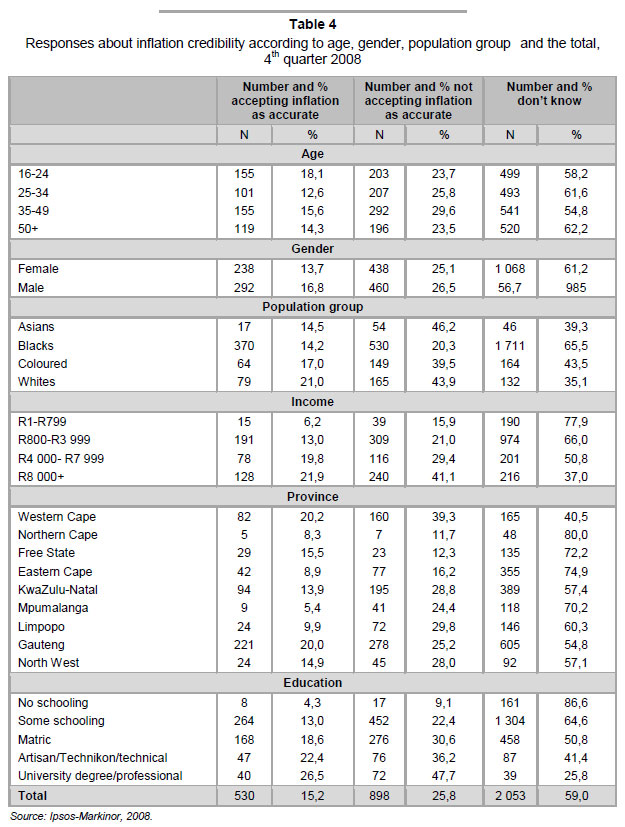
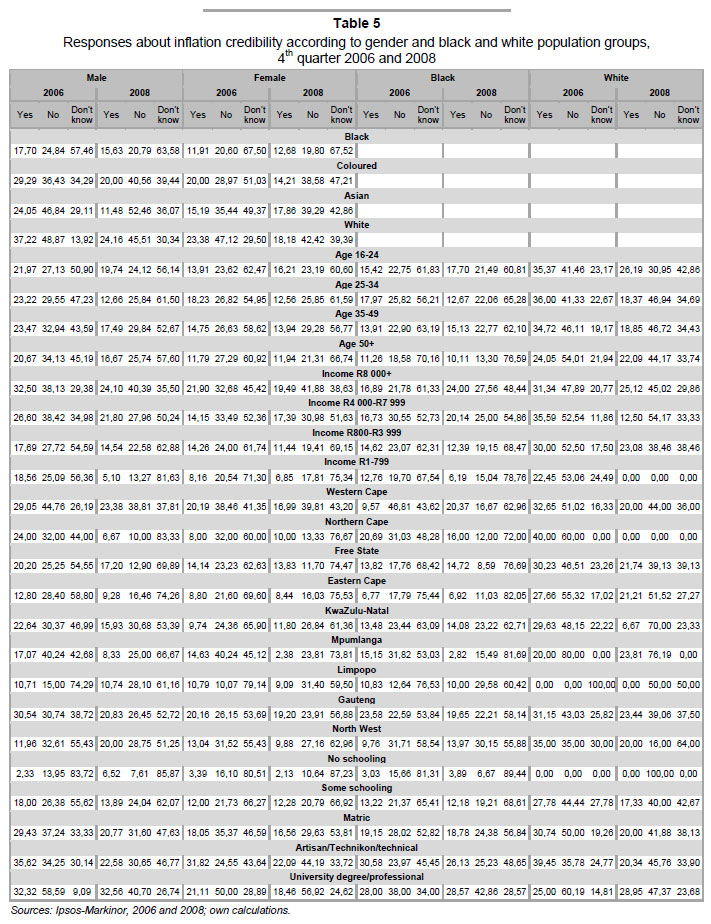
The first survey was planned between August and October 2006 and undertaken in October and November 2006. The second survey was planned in the spring of 2008 and conducted in October and November 2008. It is important to keep the planning time frame in mind, as the latest available historic inflation data at the time of planning the research was used for sampling purposes. Salient features of the sampling results are summarised in Table 3, Table 4 and Table 5. In both instances the large percentage of 'don't know' responses are quite disconcerting, particularly when compared to the considerably lower percentage of similar responses in the inflation expectation surveys. It is also not possible to ascertain whether respondents answering 'no' perceived higher or lower historic inflation.
4 Comparison and analysis of inflation expectation and inflation credibility surveys
4.1 Comparison of survey descriptions
The inflation expectation and inflation credibility surveys can be compared in terms of a number of salient features. The most obvious difference pertains to the statement and question raised with respondents. For the first period under review (the last quarter of 2006), respondents in the inflation expectations survey were asked to respond to 'over the past five years prices increased by on average 5,1 per cent per year. During 2005 prices increased by 3,5 per cent. By how much do you expect prices in general to increase in 2006?' (Bureau for Economic Research, 2006: 19). For the second review period (last quarter of 2008) respondents were asked to respond to 'over the past five years prices increased by on average 4,5 per cent per year. During 2007 prices increased by 7,0 per cent. By how much do you expect prices in general to increase in 2008?' (Bureau for Economic Research, 2008: 19).
In 2006 the statement and question put to respondents in the inflation credibility survey was 'South Africa's official rate of inflation (CPI) was 5,4 per cent in August 2006. Do you think this is a true reflection of average price increases?' (Markinor, 2006). In 2008 respondents had to respond to a statement and question that 'South Africa's official rate of inflation (CPI) was 13,7 per cent in August 2008. Do you think this is a true reflection of average price increases?' (Ipsos-Markinor, 2008).
The most interesting finding in 2006 was in respect of gender. While a larger number and percentage of male respondents than female respondents accepted the credibility of historic inflation figures, a similar difference was not recorded with inflation expectations. Male and female respondents recorded the same inflation expectations in 2006. The inflation credibility survey conducted in 2008 again shows that female respondents attach lower credibility to historic inflation figures than male respondents. In this instance the lower credibility feeds into higher inflation expectations as is evidenced by the survey results. Females expected inflation at a level of 9,2 per cent, while male respondents expected inflation at a level of 8,9 per cent.
In both 2006 and 2008, higher monthly income earners had higher inflation expectations. In 2006 respondents in the Western Cape, the Free State and Gauteng had the highest inflation expectations, while in 2008, respondents in the North West/Northern Cape, Mpumalanga/Limpopo and the Free State had the highest inflation expectations.
In terms of inflation credibility and income group in both 2006 and 2008, most of those in the R8 000+ income group accepted inflation as accurate. The largest share of those in the two lowest income groups responded that they 'don't know' in 2006 and 2008. Based on the demographical breakdown the largest share of those respondents who accepted inflation as accurate in 2006, were those in Gauteng and the Western Cape. When considering respondents' education levels, of those with no schooling and some schooling, between 60 and 80 per cent of respondents reported that they 'don't know', while of those who had higher educational attainment, around 40 per cent reported that they 'don't know' in 2006, and 50 per cent in 2008. Overall, more respondents with a higher education level reported that they accept historic inflation as accurate. It should be noted that domestic inflation was higher in 2008 than in 2006. In terms of a comparison of the responses from these two surveys, it transpires that the acceptance of historic inflation figures as accurate is lower in a lowinflation environment, than in a high-inflation environment.
4.2 Determinants of inflation expectations and inflation credibility
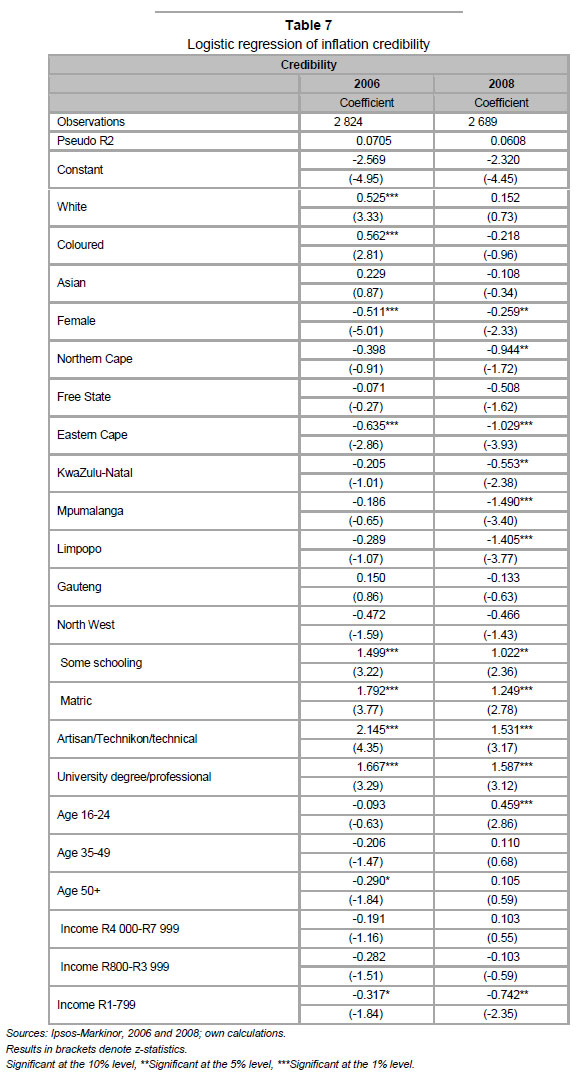
Logistic regression results are reported in Table 6 and Table 7 for inflation expectations and inflation credibility, respectively. The model for inflation expectations includes population group, gender, geography (provinces), income groups and age. The dependent variable was coded 1 for inflation expectations between 26 per cent and 100 per cent, and 0 for inflation expectations lower than or equal to 25 per cent. The categorical variables are black males between the ages of 25 and 34 living in the Western Cape, and who earned an income higher than R8 000 per month. Based on the z-statistics, the results can be interpreted as follows:
• Compared to black respondents, Asians were more likely to expect an inflation rate of between 25 per cent and 100 per cent in 2006, while white respondents were less likely. In 2008, however, Asians were less likely, compared to black respondents, to expect an inflation rate of between 25 per cent and 100 per cent.
• In 2006, compared to the Western Cape, respondents in Gauteng were more likely to expect a rate of inflation between 25 per cent and 100 per cent. In 2008, respondents in Eastern Cape were less likely to expect a rate of inflation between 25 per cent and 100 per cent, while respondents in KwaZulu-Natal
and the North West/ Northern Cape were more likely to expect inflation between 25 and 100 per cent, compared to the Western Cape.
• Those respondents who were in the lowest and second-lowest income categories were more likely to expect inflation between 25 and 100 per cent in 2006 and 2008.
Variables included in the logistic model for inflation credibility were population group, gender, province, income, age and education. The reference group is black males between the ages of 25 and 34, with no schooling, living in the Western Cape, and who earned more than R8 000 per month. The results can be interpreted as follows:
• In 2006, whites were less likely to accept the inflation rate as accurate, compared to black respondents, while coloureds were more likely to accept the inflation rate as accurate, compared to black respondents.
• Females were less likely to accept inflation as accurate compared to males in both 2006 and 2008.
• In both 2006 and 2008, respondents in the Eastern Cape were significantly less likely to accept inflation as accurate, compared to those in the Western Cape. In 2008, respondents in the Northern Cape, KwaZulu-Natal, Mpumalanga and Limpopo were also significantly less likely to accept the inflation rate as accurate.
• In both 2006 and 2008, those with some schooling, matric, an artisan/technikon/ technical qualification, and those with a university degree or other professional qualification, were more likely to accept the inflation rate as accurate compared to those with no schooling.
• In 2006, respondents older than 50 years were less likely to accept the inflation rate as accurate. In 2008, however, those between 16 and 24 were more likely to accept the inflation rate as accurate.
• In 2008, those in the lowest income category were less likely to accept the inflation rate as accurate.
4.3 Multinomial analysis5
The information from the two surveys can be used to compare the different outcomes between 2006 and 2008. In the inflation expectations survey the aim is to test whether there is a significant difference between the characteristics of those who believe inflation to be below or equal to 25 per cent, those who believe inflation to be above 25 per cent and those who responded that they 'don't know', as presented by the BER between 2006 and 2008. Similarly, by using the inflation credibility survey, it is possible to ascertain whether there are differences in the underlying characteristics of those who believe that the current inflation rate is accurate, those who do not believe that the current inflation rate is accurate and those who responded that they 'don't know' between the same two periods. Furthermore, it can also be determined whether the same characteristics which impact on inflation expectations, impact on inflation credibility, thereby determining whether there is a possible feed-through effect from inflation credibility to inflation expectations. A multinomial logit was estimated for the inflation expectations and inflation credibility surveys for both 2006 and 2008. The multinomial logit model is an expansion of a binarychoice model (Lancaster, 2004). For the inflation expectations survey, the reference group was those who believe inflation to be below or equal to 25 per cent. For the inflation credibility survey, the reference group was those who believe that the current inflation rate is accurate.
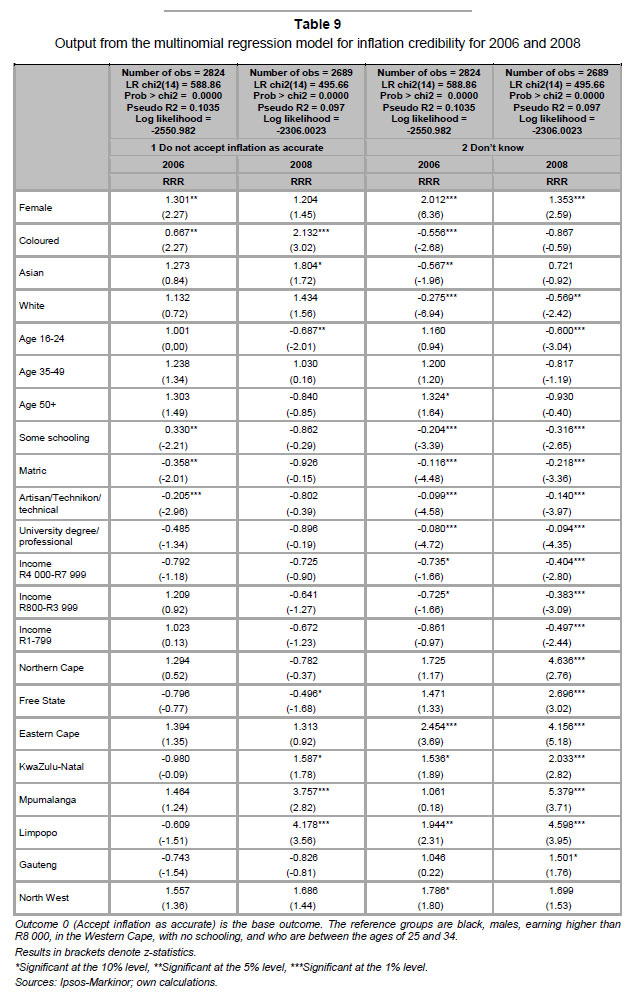
The coefficients are estimated by maximum likelihood, and the relative risk ratio (RRR) is reported in Table 8 and Table 9. First, the outcomes from the inflation expectations survey are modelled, followed by the outcomes from the inflation credibility surveys. The same independent variables and benchmark categories were used for both surveys.
The explanatory variables are based on a set of demographic characteristics that could determine how individuals see inflation. The results from the 2008 inflation expectations survey can be compared to the 2006 results as calculated by Rossouw et al. (2009), which is the first South African study against which results can be benchmarked. The variables included in the multinomial analysis were the following:
• Gender (reference = male)
• Population group (reference = Asians)
• Age, with respondents divided into age groups (16-24), (35-39) and (50+). The benchmark category is (25-34).6
• Income groups were divided into (R1R799),7 (R800-R3 999), (R4 000-R7 999), and the reference category (R8 000+).
• In terms of spatial distribution, respondents from North West and the Northern Cape are grouped together, as well as those from Mpumalanga and Limpopo, as the original survey data was grouped in this way. Western Cape was set as the benchmark category. For the inflation credibility survey, the provinces were not grouped together, but coded 1 to 8 and the benchmark province (Western Cape) was coded 0.
• Information regarding education was available for respondents in the inflation credibility survey, and was included in the credibility model. Education includes those with some schooling, matric, an Artisan/ Technikon/technical qualification and those with a University degree or other professional qualification (reference = no schooling).
Clarity about the inflation expectations of different groups and their perceptions about the credibility of historic inflation data can assist central banks in targeting their communication initiatives more accurately. This analysis might serve as an early warning of groups with overly high inflation expectations or incorrect perceptions of historic inflation rates that might lead to wage demands exceeding the rate of inflation (see for instance Forsells & Kenny, 2002, on such a link).
For both the inflation expectations and the inflation credibility surveys conducted in 2006 and 2008, the model shows a goodness of fit that is significantly different from zero. For the inflation expectations model, the Pseudo R2 in 2006 wa2s 0,0467, and 0,0593 in 2008. The Pseudo R2 for the inflation credibility model was 0,1035 in 2006 and 0,097 in 2008. As in binomial logistic models, the Pseudo R2 will more than likely fall between 0 and 0,333 (Pindyck & Rubinfeld, 1981).
4.4 Results
4.4.1 Expectations model
The relative risk ratios (RRR) for the inflation expectations model for both 2006 and 2008 were analysed at the 90 per cent confidence interval, and presented in Table 8 for the multinomial logit model for 2006 and 2008.
First, this analysis attempts to determine what percentage of which population group thinks that the expected inflation rate is higher than 25 per cent, as opposed to less than 25 per cent. The output presented in Table 8 suggests that the odds in this respect are 171 per cent [i.e. 100(1-0,365)] less for whites than for blacks in 2006. In 2008, however, there was no significant difference between whites and blacks. In 2006 the odds were higher for Asians perceiving the inflation rate to be higher than 25 per cent, compared to blacks. However, during the 2008 survey round, the odds were 78,2 per cent less for Asians than for blacks in this regard.
Similarly, in 2006 there was no significant difference between the inflation expectations of males and females, and only a statistically insignificant difference in 2008, although mean inflation expectations for females were higher than for males.
The same structure is applied to determine what percentage of which age group thinks that expected inflation will be higher than 25 per cent, rather than less than 25 per cent, for both 2006 and 2008. Similar to gender, in both 2006 and 2008 age did not influence respondents' decisions.
In terms of the income variable, in 2006 the odds of perceiving the inflation rate to be higher than 25 per cent increased by 197,8 and 258,9 respectively, for those who earned in the bottom two income brackets, compared to those who earned in the highest income bracket. A similar result was obtained during 2008, although the increase in the odds was slightly less.
The odds of expecting an inflation rate above 25 per cent for respondents in Gauteng increased by 126, compared to those in the Western Cape. In 2008, however, the odds were higher for KwaZulu-Natal and North West/Northern Cape to expect inflation above 25 per cent, compared to the Western Cape. In 2008, the odds of expecting inflation above 25 per cent decreased by 86 for those in the Eastern Cape.
Second, this analysis attempts to draw a comparison between 2006 and 2008 in terms of what percentage of which population group 'did not know' what they expected the inflation rate to be, over those who expected an inflation rate lower than 25 per cent. The odds for whites were 42,7 per cent less in this regard, compared to blacks. In 2008, however, there was no significant difference between whites and blacks. Furthermore, the odds in 2006 were 60,4 per cent higher for respondents in the age group 35-49 than for those in the age group 25-34. Moreover, the odds increased by 44,7 per cent for people older than 50 years, in comparison with those in the age group 25-34. In 2008, different age group had no significant impact on inflation expectations. No significant difference between inflation expectations was found between male and female respondents in both survey years.
When considering the income variable, in 2006 the odds were more by 34,3 and 71,6, respectively that the two lowest income groups 'did now know' what they expected the inflation rate to be, as opposed to those who thought that the expected inflation rate was lower than 25 per cent. In 2008, the odds were significantly higher that the two lowest income group individuals responded that they 'did not know', compared to those in the highest income group. In 2008 the odds for respondents in the income group R4 000 to R7 999 was also significantly higher that they 'did not know'.
The odds were higher by 50,5 for respondents in the Free State to respond that they 'did now know' what they expected the inflation rate to be, as opposed to those who thought that the expected inflation rate was lower than 25 per cent. The odds were around 37,4 less for respondents in Gauteng in 2008.
4.4.2 Credibility model
The RRR were calculated for the two outcomes of the inflation credibility surveys for both 2006 and 2008 and evaluated at the 90 per cent confidence interval. Table 9 displays the results of an inflation credibility multinomial logit regression model for 2006 and 2008.
First, this analysis attempts to determine what percentage of which gender group did not accept the inflation rate as accurate, in comparison with those who did accept it as accurate. The odds in this respect in 2006 were 30,1 per cent higher for females than for males. In 2008, however, there was no significant difference between male and female participants. In 2006 the coefficient for the age group 16-24 was not significant; however, in 2008 the odds were 31,3 per cent lower for this group. Furthermore the odds in 2006 were 41,5 per cent higher for participants over 50 years to not accept inflation as accurate than for those between 25-34. In 2008, the odds for this group, however, was 28,6 per cent less. In 2006, the odds increased by 33,3 for coloureds to not accept the inflation rate as accurate, compared to blacks. In 2008, the odds increased even more, by 113,2 per cent for coloureds not to accept the inflation rate as accurate, compared to blacks. In 2008, the odds were also 80,4 per cent higher for Asians to not accept the inflation rate as accurate, ceteris paribus, and compared to the benchmark category, blacks.
In 2006, the odds were significantly less for those with any type of education to not accept the inflation rate as accurate, compared to those with no education. However, in 2008, none of the education coefficients were found to be significant.
In 2008, the odds decreased by 50,1 per cent for respondents in the Free State to not accept the inflation rate as accurate, compared to those in the Western Cape. In the same period, the odds were higher for KwaZulu-Natal (58,7 per cent), Mpumalanga (275,7 per cent) and Limpopo (317,9 per cent) to not accept the inflation rate as accurate.
Second, this analysis attempts to determine the difference between the 2006 and 2008 survey results in terms of what percentage of which gender group 'did not know' whether they accepted the inflation rate as accurate or not, compared to those who did accept it as accurate. The results show that in 2006 and 2008 the odds increased by 101,2 per cent and 35,3 per cent, respectively, for female participants, as compared to males in this regard. The output further shows that the odds decreased by 72,5 per cent for whites to 'not know', as opposed to blacks in 2006. In 2008 the odds decreased by 43,1 for this group, compared to the reference group. On the other hand the odds in 2006 were 43,3 per cent more for Asians, than for blacks to 'not know'. In 2008, the coefficient for Asians was not significant. In 2006, the odds for coloured respondents to 'not know' was also lower with 44,4 per cent, compared to blacks. This coefficients was, however, not significant in 2008.
This analysis also show that the odds to 'not know' in 2006 increased by 32,4 per cent for participants older than 50 years, compared to those between 25-34 years. In 2008, there was no significant difference between those older than 50 years and those 25-34. In 2008, however, the odds decreased in this respect for those between 16-24 by 40,0 per cent, compared to the benchmark category 25-34.
In both 2006 and 2008, the odds were significantly less for those with any type of education to respond that they 'did not know', as opposed to accepting the inflation rate as accurate, compared to those with no education.
In 2006, the odds were higher that respondents in the Eastern Cape (145,4 per cent), KwaZulu-Natal (53,6 per cent), Limpopo (94,4 per cent) and the North West (78,5 per cent), would respond that they 'did not know' if they accepted the current rate of inflation as accurate, compared to those in the Western Cape. In 2008, however, compared to the Western Cape, all provinces showed significant increases in the odds of 'not knowing' if they accepted the inflation rate as accurate, except for the North West.
Furthermore, the odds that respondents 'did not know' decreased by 26,5 and 27,5 respectively, for those who earned between R800-R3 999 and R4 000-R7 999. In 2008, the odds in this regards were significantly lower for all income groups, ceteris paribus.
It transpires that sub-categories increase the use of information within surveys of inflation credibility in both 2006 and 2008. This approach highlights considerable differences in perceptions between sub-categories of respondents, as well as changes in perceptions between different survey periods. The results show that in 2006, when the average inflation rate was 5,4 per cent, respondents seemed less likely to believe that the inflation rate is likely to believe that the inflation rate is accurate, whereas in 2008, when the average inflation rate was 13,7 per cent, respondents were more likely to accept the inflation rate as accurate.
5 Conclusions
The main conclusion in terms of inflation expectations is that inflation expectations differ between different income groups. Although some results were not robust between 2006 and 2008, the difference between income groups was consistent over this period.
In terms of inflation credibility, credibility differed between male and female respondents, although this did not seem to feed through to higher inflation expectations. This could partly be explained by the high percentage of respondents who 'did not know' what they expected the inflation rate to be.
Income significantly affected inflation credibility, and also had a feed-through effect to higher inflation expectations. Education also had an impact on whether respondents perceive the inflation rate as credible, although due to data limitations, the feed-through effect to inflation expectations could not be determined.
The statement and question used in the inflation credibility surveys should be amended to ensure a better alignment with the statement and question used in inflation expectation surveys. This can be achieved through the use of two statements/questions in the next biennial inflation credibility survey, one of which will be aligned to the statement/question used in inflation expectation surveys. This reformulation will provide some respondents with an opportunity to indicate whether they think prices increased at a rate higher or lower than the historic rate of inflation.
It is striking that the acceptance of historic inflation figures as accurate is low in a lowinflation environment. This seems to indicate that respondents confuse price levels and price increases (i.e. inflation). Greater clarity will only emerge after similar biennial surveys have been conducted over a number of high and low inflation cycles. This is an area for further research, as it might have implications for inflation targeting as a policy regime.
Endnotes
1 This section draws on Rossouw (2008), Rossouw and Joubert (2005), and Rossouw et al. (2009).
2 The use of omnibus surveys to limit sampling costs is accepted as a research practice (Camponovo, 2006; Lindenmann, 2001).
3 This paper uses the same terminology, classifications and descriptions for population groups as Statistics South Africa (Statistics SA, 2005).
4 The number of respondents in the first survey was reduced to 3 493 (Markinor, 2006) and to 3 481 in the second survey (Ipsos-Markinor, 2008) after a 20-per-cent back-check to validate the results.
5 See Rossouw et al. (2009) for a description of the model.
6 The benchmark category is automatically selected by the software package.
7 During the 2006 inflation expectations survey, the category was grouped R1-R899, which could have resulted in a higher proportion of respondents being grouped in the lowest income group, that actually belonged to the second-lowest income group.
Acknowledgement and disclaimer
The authors would like to thank Economic Research Southern Africa (ERSA) for generous financial support for this paper, which appeared as ERSA Working Paper no. 173 in an earlier format.
The views and opinions expressed in this paper do not necessarily reflect the views and opinions of the SA Reserve Bank or any of the Universities.
References
BANCO CENTRAL DE CHILE. 2008. Monetary policy report. January. [ Links ]
BANK FOR INTERNATIONAL SETTLEMENTS. 2008. Monetary policy decisions: preparing the inputs and communicating the outcomes. BIS papers No 37. Bank for International Settlements, February. [ Links ]
BANK OF ICELAND. 2003. Monetary Bulletin, 5(3), August. [ Links ]
BERK, J.M. 1999. Measuring inflation expectations: a survey data approach. Applied Economics, 31(11), November. [ Links ]
BLINDER, A.S., EHRMANN, M., FRATZSCHER, M., DE HAAN, J. & JANSEN, D-J. 2008. Central Bank communication and monetary policy: a survey of theory and evidence. Working Paper Series No 898 . European Central Bank, May. [ Links ]
BLINDER, A.S. & WYPLOSZ, C. 2005. Central Bank talk: committee structure and communication policy . Paper presented at the session 'Central Bank communication' at the ASSA meetings. Philadelphia, 9 January. [ Links ]
BRACHINGER, H.W. 2005. Measuring perceived inflation: a prospect theory approach. International Statistical Institute, Voorburg, The Netherlands. 55th session in Sydney, 5-12 April. [ Links ]
BUREAU FOR ECONOMIC RESEARCH. 2006. Survey of inflation expectations - results report: 4th quarter of 2006. University of Stellenbosch: Stellenbosch. [ Links ]
BUREAU FOR ECONOMIC RESEARCH. 2008. Survey of inflation expectations - results report: 4th quarter of2008. University of Stellenbosch: Stellenbosch. [ Links ]
CAMPONOVO, G. 2006. Conceptual models for designing information systems supporting the strategi c analysis of technology environments. Unpublished PhD thesis. University of Lausanne: Lausanne. [ Links ]
COLLINS ENGLISH DICTIONARY. 2000. 4th edition updated. HarperCollins Publishers: Glasgow. [ Links ]
EHRMANN, M. & FRATZSCHER, M. 2005. How should central banks communicate? Working Pape r Series No 557, European Central Bank, November. [ Links ]
FORSELLS, M. & KENNY, G. 2002. The rationality of consumers' inflation expectations: survey-based for the Euro Area. Working Paper No 163, European Central bank Working Paper Series. [ Links ]
FRACASSO, A., GENBERG, H. & WYPLOSZ, C. 2003. How do central banks write? ICMB: Geneva. [ Links ]
IPSOS-MARKINOR. 2008. Project inflation credibility: results presentation, December. [ Links ]
JONUNG, L. 1981. Perceived and expected rates of inflation in Sweden. American Economic Review. 71(5), December. [ Links ]
KERSHOFF, G. 2000. Conductinginflation expectation surveys in South Africa. Publication ofthe Bureau for Economic Research: University ofStellenbosch, 24 October. [ Links ]
LANCASTER, T. 2004. An introduction to modern Bayesian econometrics. Blackwell Publishing: Oxford, UK. [ Links ]
LEEPER, E. M. 2003. An Inflation Reports report. Economic Review 3. Swedish Riksbank. [ Links ]
LINDENMANN, W. K. 2001. Research does not have to put you in the poorhouse. [Online] Available at: people.ku.edu/~dguth/Lindenmann.pdf- Supplemental result. [Accessed 2007-03-07] [ Links ].
MANKIW, G., REIS, R & WOLFERS, J. 2003. Disagreement about inflation expectations. Working Pape r 9796. National Bureau of Economic Research, June. [ Links ]
MARKINOR. 2006. Project inflation credibility: results presentation. December. [ Links ]
MISHKIN, F.S. 2004. The economics of money, banking and financial markets (7th ed.) Addison-Wesley Publishing Company, Inc: United States of America. [ Links ]
NATIONAL GAMBLING BOARD. 2005. Socio-economic impact of legalised gambling in South Africa . National Gambling Board: Pretoria. [ Links ]
PALMQVIST, S. & STROMBERG, L. 2004. Households' inflation opinions - a tale of two surveys. Economic Review 4 [Online] Available at: Kat_ publicerat/Artiklar_PV/ER042.pd [Accessed on various dates] [ Links ].
PINDYCK, R.S. & RUBINFELD, D. 1981. Econonometric models and economic forecasts. New York: McGraw-Hill. [ Links ]
POWERS, C. 2005. Inflation targeting: a comparative assessment of South Africa's early experience . Unpublished M Com dissertation, University of Johannesburg: Johannesburg. [ Links ]
RESERVE BANK OF NEW ZEALAND. [S.a.]. J5 marketscope survey - expectations of inflation [Online] Available at: http//www.rbnz.govt.nz [Accessed on various dates] [ Links ].
ROSSOUW, J. 2008. Inflation in South Africa: 1921 to 2006. History, measurement and credibility . Unpublished PhD thesis, University of KwaZulu-Natal: Durban. [ Links ]
ROSSOUW, J. & JOUBERT, F. 2005. Supporting an inflation-targeting policy with the measurement of inflation credibility. South African Journal of Economics, 73(2), June. [ Links ]
ROSSOUW, J. & PADAYACHEE, V. 2007. A study on inflation credibility among students at the University of Pretoria. South African Journal of Economic and Management Sciences, 10(1), March. [ Links ]
ROSSOUW, J., PADAYACHEE, V. & BOSCH, A. 2009. Links or disconnect: a first comparison of inflation expectations and inflation credibility, with specific reference to South Africa. South African Journal o f Economic and Management Sciences, 12(4), December. [ Links ]
SA RESERVE BANK. 2008. MonetaryPolicyReview. May. [ Links ]
SA RESERVE BANK. 2009. MonetaryPolicyReview. May. [ Links ]
SAMUELS, L.H. 1967. Control of inflation. South African Journal of Economics, 35(4), December. [ Links ]
STATISTICS SA. 2005. Census 2011: Appendix A - Questionnaire for census publicity. [Online] Available at: http://www.statssa.gov.za/census2011/index.asp [Accessed on 2009-11-23] [ Links ].
SVERIGES RIKSBANK. 2008. Monetarypolicyreport. 2/2008. [ Links ]
WINKELMANN, R. & BOES, S. 2006. Analysis ofmicrodata. Springer: Berlin and Heidelberg. [ Links ]
Accepted May 2011

