


Servicios Personalizados
Articulo
 Inglés (pdf)
 Articulo en XML
 Referencias del artículo
Indicadores

Links relacionados
-
 Citado por Google
 -
 Similares en Google
Compartir

 Permalink
South African Journal of Economic and Management Sciences
versión On-line ISSN 2222-3436
versión impresa ISSN 1015-8812
S. Afr. j. econ. manag. sci. vol.14 no.3 Pretoria ene. 2011
An analysis of specialist surgeons and their practices
Steven F Koch; Jean D Slabbert
Department of Economics, University of Pretoria
ABSTRACT
A purposive sample of South African specialist doctors provided data for an empirical analysis of revenues, costs and earnings associated with specialist surgical medicine. The empirical analysis includes both parametric and nonparametric regression. Parametric estimates of revenues per new patient range between R689 to R818, while cost per new patient estimates range between R694 and R749; average surgeon income per new patient falls within a similar range. Furthermore, costs per surgery follow a cubic specification, implying increasing marginal costs at the practice level. Returns to experience are estimated to be quadratic, although imprecisely so, given limited observations. Due to the low response rate in the survey, there is a need to conduct further research into this topic, to provide better information to both specialists and the South African Department of Health, which sets pay packages for public sector health workers.
Key words: specialist doctors, specialist practice revenues, specialist practice costs, specialist practice earnings, parametric and nonparametric regression/analysis, income/profit regression, returns to experience
JEL: D21, I11
1 Introduction
The Lancet (2000) reports that South Africa incurred a cost of nearly $37 million, due to the migration of health workers, and, although recent research examines emigration to places like Canada (Labonté, Packer & Klassen, 2006), the United States (Hagopian, Thompson, Fordyce, Johnson & Hart, 2004), the United Kingdom (Eastwood, Conroy, Naicker, West, Tutt & Plange-Rhule, 2005), and Australia (Mullan, 2005), there is little specific information with respect to the drivers of South African health worker emigration. To this end, the South African Medical Association (SAMA), in conjunction with the Foundation for Professional Development (FPD), sponsored a study of private specialists in Gauteng Province, South Africa. SAMA and the FPD are seeking insight into physician emigration from South Africa, as well as the economic and social realities associated with private practice in South Africa, which are expected to influence emigration decisions. In line with SAMA's and FPD's objectives, we present evidence related to the revenues, the costs and the profitability of specialist physician practitioners in Gauteng Province. Further, we present estimates of the returns to experience for practitioners operating in a province with one of the highest concentrations of specialist doctors in the country.1 Through the further understanding of profitability and returns to experience, this analysis provides information on the financial rewards associated with specialist medicine in South Africa, and could, along with further concentrated analysis of health care professional attitudes towards practicing medicine in South Africa, help construct policies that keep doctors, specialist or otherwise, in South Africa.
The available data suggest that emigration has been extensive.2 According to American Medical Association data from 2002 and Canadian Medical Association data from 2003, reported in Hagopian et al. (2005), there were 3788 South African trained doctors working in either the United States or Canada. Within the United Kingdom and Australia, there were a further 3233 South African trained doctors (Mullan, 2005). When the emigration figures are combined with additional World Health Organization data, such as that reported in Hagopian et al. (2005), a rough picture of emigration emerges. Accordingly, 23 844 South African trained doctors remained in South Africa, while just over 7 000 emigrated; therefore, approximately 25 per cent of the trained stock has left the country. Despite the large proportion that has left, little is known about the reasons for departure, although Labonte et al. (2006) interview seven South African emigre doctors, as well as a number of Canadian health organizations and stakeholder organizations. In their study, they identified a number of push factors, including: low salaries, non-payment of salaries, significant stress and exceedingly large patient-health care provider ratios. Our analysis, below, provides information related primarily to salaries and earnings.
The supply-side of the health sector in South Africa has not received much attention in the literature. Studies that do exist focus on the efficiency of public health care delivery in specific regions, typically finding low levels of efficiency. For example, Zere, Mclntyre and Addison (2005) examine public hospitals in the Cape area. They find efficiency levels just less than 50 per cent, while efficiency in public clinics in Kwazulul-Natal is not much better; see Kirigia, Sambo and Scheel (2001) and Kirigia, Lambo and Sambo (2000). Although Kibambe and Koch (2007), who examine public hospitals in Gauteng, find evidence that public health care delivery is inefficient, flexible estimators lead to less dire conclusions regarding inefficiency, compared to the Cape and Kwazulu-Natal studies. In addition to the public health care studies, Koch and Slabbert (2010) present evidence related to the efficiency of privately provided surgical procedures. Similar to what was estimated for the public sector, Koch and Slabbert (2010) find that surgical procedures are inefficiently delivered in the private sector, although they find less inefficiency in their sample, than was found in the previously noted public sector samples.
Although both the efficiency and the inefficiency of health care delivery in South Africa have featured in the literature, very little is known about economic returns in the sector. Therefore, this analysis contributes to our understanding of the economics of private health care delivery in South Africa, especially revenues, costs and earnings. The focus of the analysis is on specialist surgeons and their practices; specialists include vascular surgeons, cardiothoracic surgeons, neurosurgeons and orthopaedic surgeons. Analysis ofthe data, primarily exploratory in nature, collected through the SAMA and FPD sponsored survey, consists of both nonparametric and parametric regression. In general, as size of the practice increases, both costs and revenues increase, and, since both increase, the effect of practice size on income is not as clear. Given the small sample, although experience does influence earnings, the estimates are not precise enough to provide certainty.
The remainder of the paper is structured in the usual fashion. In Section 2, a short examination of the relevant economic theory is provided, while the empirical strategy is outlined in Section 3. Following the empirical methodology, Section 4 contains a description of the survey and data used in the analysis. The results from the empirical analysis are presented in Section 5, and conclusions follow, in Section 6.
2 Economic theory
This research considers the profitability of specialist doctor practices, and, further, provides estimates of the returns to specialist experience. Profits are specified as a function of output, q. Although the most appropriate measure of output is the improvement in the health of the patient, this measure of output is not available, a standard refrain in the health production literature (Hollingsworth, 2003). Since the data does not contain any indicators of the improvement in patient health, the analysis, instead, focuses on patient throughput in the form of the total number of patients served, the number of new patients seen by the specialist, and the total number of surgeries performed by the specialist.
Profits for the practice are a simple function of revenues and costs, each of which are a function of a vector of outputs, q, as in equation (1).

In general, revenues, R, are expected to be a convex combination of prices and units of output, and that convex combination is expected to be linear.

Costs, C, on the other hand are not expected to be linear in output. Output, which is a function of the inputs, may or may not be driven by constant returns to scale technology, while inputs may or may not be purchased in a competitive market. Importantly, specialist time is limited, such that the opportunity cost of an additional patient or surgery would rise as the time constraint binds, leading to costs that are convex in output. Therefore, it is plausible that profits are also a nonlinear function of outputs; see equation (3) and the descriptions surrounding nonparametric regression.
Specialist practice profits, derived from (1), are combined with reported salaries to calculate a measure of income for the specialist. Economic theory suggests that income (or earnings) is a function of education, experience and ability. The available data comes from specialist physicians, such that education is reasonably similar across all observations, although the type of specialty differs. Unfortunately, neither ability nor an instrument for ability is available in the data. Therefore, the analysis includes only experience and specialty in the returns to experience regressions.
3 Empirical methodology
The data, to be described below, contains a wide range ofinformation from a small sample of specialist doctor practices, including: practice type, revenues, costs, outputs and physician experience. This data is used to explore the cost, revenue and profit functions for the practice. The analysis concludes with an examination of the returns to physician experience. The empirical methodology includes both nonparametric and parametric (linear) regression, which has been informed by the nonparametric results.
Consider the nonparametric regression function in equation (3), assuming that m(x) is the conditional mean of Y assuming a specific realization of X, where X is a vector of covariates, and observations are assumed to be independent. The nonparametric estimation of (3) allows for mixed data, i.e., data that is both continuous and discrete, as outlined by Racine and Li (2004).

Often, nonparametric analysis only includes continuous regressors; however, our data also includes an unordered categorical variable, the type of specialty. Although it is possible to split the data into different categories, and estimate the functions for each specialty, the limited number of observations in the data would raise serious efficiency concerns. Instead, the analysis follows Racine and Li (2004), who propose a natural extension of Aitchison and Aitken (1976) to develop a discrete kernel.3 For continuous data, on the other hand, a number of different univariate kernels are available, such as the Gaussian and Epanechnikov kernels. In this analysis, the second-order Gaussian kernel is applied; other kernels were also considered, but did not influence the reported results. The discrete and continuous kernels are combined into a product kernel, simply the multiple of each of the kernels.
Nonparametric estimation follows an approach that is similar to weighted least squares regression, except that the analysis is performed within small windows of the data, as defined by the bandwidth. There are a number of benefits that can be derived from a nonparametric regression. In particular, since the function is not defined a priori, the analyst can allow the data to determine the functional form, which can then be used to inform an appropriate linear regression. Importantly, efficiency is improved by specifying the functional form. However, the efficiency benefits derived from defining the functional form come at the cost of potential bias in the estimates. The nonparametric estimates provide some indication of the appropriate functional form, which we use, along with economic theory, to specify more efficient linear regressions that are, ideally, less affected by functional form bias.4
Since bandwidths determine the size of the window used in the calculation of the nonparametric estimator, appropriate bandwidths are paramount. In this research, bandwidths are estimated via least squares cross-validation; see Hall, Racine and Li (2004). Cross-validation, or jack-knifing, yields optimal bandwidths, under certain conditions.5 The consistency and efficiency of nonparametric regressions are theoretically justified under asymptotic theory. However, the survey data available for this analysis is not extensive; in some estimation samples, only 40 observations were available. Given the small sample sizes, raising potential concerns over the small sample properties of the nonparametric estimates presented, the empirical analysis was extended to include parametric (linear-in-the-parameters) specifications suggested by the nonparametric regression results.
Empirically, when considering profits and, especially, returns, one worry that arises is whether or not there are omitted variables that might be correlated with the regression error. In this analysis, the most likely endogenous unobserved covariate is the ability of the specialist, especially the administrative ability. Specialists receive much of their income from third-party insurance firms. These payments could be accessed more easily for administratively capable specialists, or for those with other abilities that cannot be observed in the data. Despite that concern, it is not possible to control for endogeneity in the analysis.6
4 Data
This analysis is based upon a purposive survey collected during 2007 and 2008. The survey was sent to all registered private specialist physicians in Gauteng. Specialist physician participation in the study was both voluntary and anonymous. The survey queried doctor and clinic characteristics, including costs and revenues. Our analysis focuses only upon single doctor practices and makes use of information related to practice type, costs, revenues and the doctor's experience. An analysis of practice productivity is undertaken elsewhere; see Koch and Slabbert (2010).
4.1 Data collection
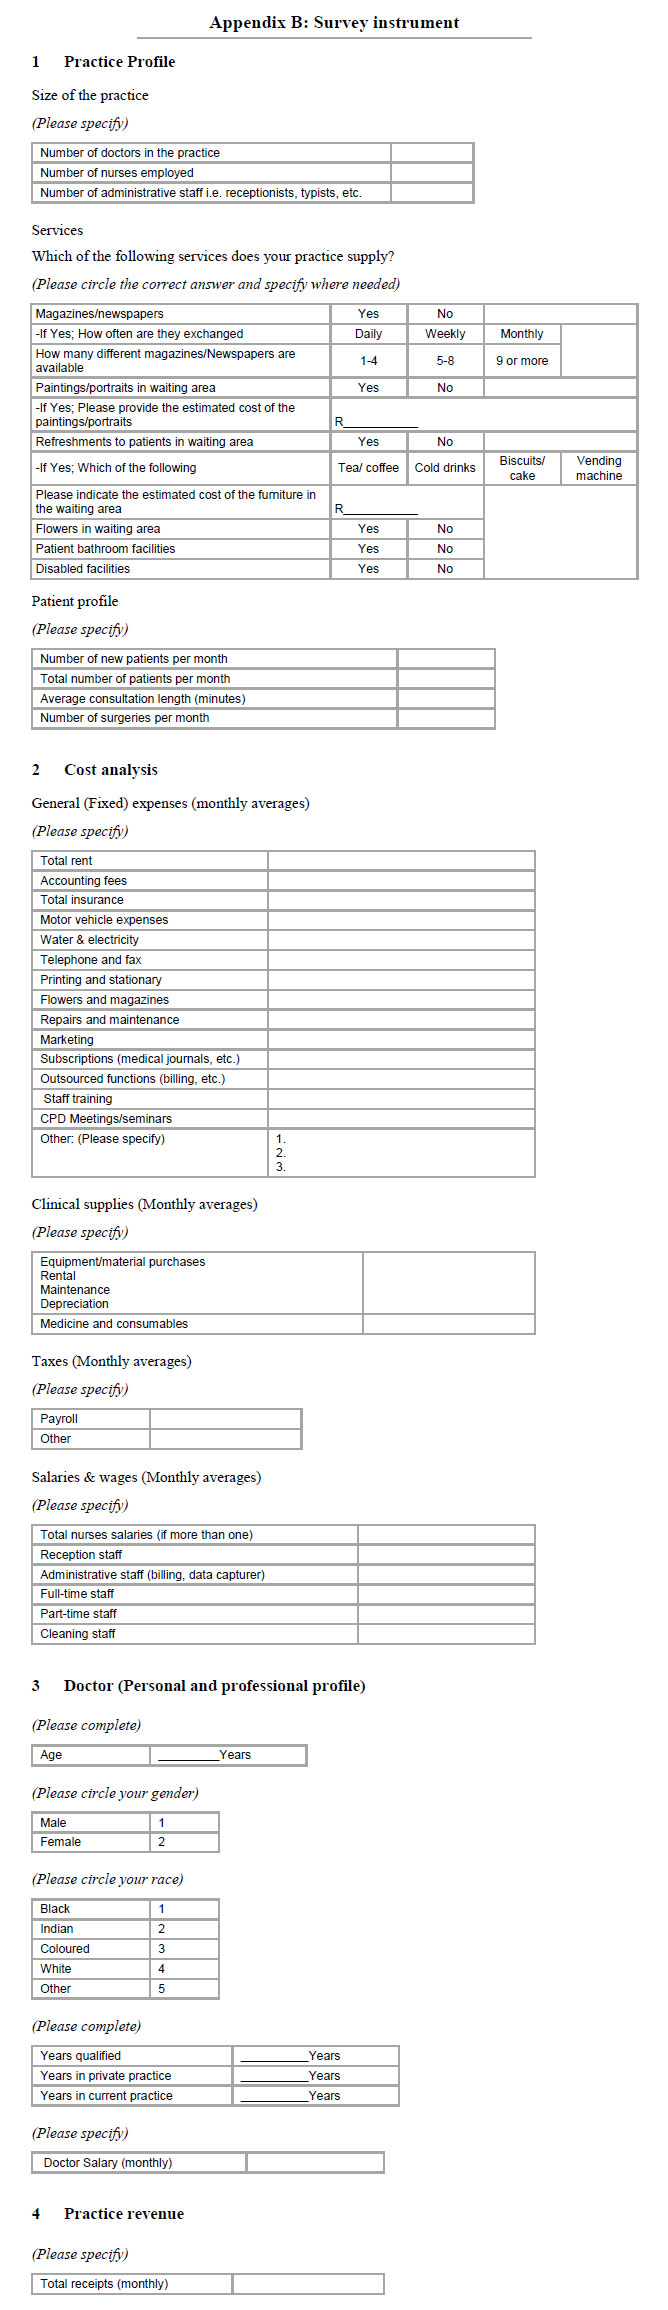
Originally, 260 specialist physicians were contacted, and requested to complete a confidential survey. The survey/questionnaire (Appendix B) was designed to collect information related to practice expenditures. Similar research of this nature conducted in South Africa and around the world was helpful in determining the appropriate questions and the appropriate process for surveying specialist practitioners. Research by Weiss (2002, 2003), Brentnall (2007) and Needleman (2005) were important contributions to the structure of the questionnaire. A number of guidelines related to questionnaire construction were also followed, especially those suggested by Leedy and Ormond (2001) and Joubert, Bam and Cronje (1999). In order to conform to their suggestions, the questionnaire was kept short and simple; the questions were not leading; the questions were ordered from simple to important, and the questionnaire concluded with sensitive questions.
Question 1 dealt with the practice and its patient profile, including practice size, attention to patient comfort, the number of patients, consultation length, number of surgeries, etc. Question 2 provided a breakdown of all the practice expenditures during the month. More specific questions related to the doctor's personal and professional profile were addressed in Question 3, while the most sensitive questions related to revenue were requested in Question 4.
The questionnaires were sent to potential respondents by registered post. The parcels contained a covering letter (explaining the premise and potential benefits of the research and, importantly, ensuring confidentiality of the reported information), the questionnaire and an envelope with pre-paid postage to minimize respondent costs. The option to fax responses through to FPD offices was offered, as well. In order to increase the number of responses, potential respondents were contacted by telephone, fax and e-mail to remind and encourage participation. The responses were tallied and the questionnaires were sent out again in three months to those who did not respond, initially. In order to further increase buy-in into the research, the South African Orthopaedic Association (SAOA) and the Vascular Society of Southern Africa (VASSA) were contacted and invited to take part in the research. The response to their introduction into the research process was highly satisfactory, as it added an additional twenty respondents.
4.2 Data concerns
Of the original surveys, responses were received from 69 specialists representing a response rate of 26.5 per cent. There were 15 vascular surgeons, 45 orthopaedic surgeons, five neurosurgeons and four cardiothoracic surgeons. Most practices were single physician practices - only three practices contained more than one physician - so the analysis was limited to single physician clinics. Furthermore, only data with complete information was used, which also reduced the sample size, although the number of complete observations depends upon the empirical model being estimated. Given the limited sample sizes, power statistics were also computed and are discussed with respect to the results.
Despite the response rate being much higher than the 5 per cent managed by Brentnall (2007), even though she received a total of 5869 responses compared to our 69, the small number of responses could raise concerns about the reliability of the results reported herein. The low response rate could be attributable to participation reluctance and the method of data collection used. Future research of this nature might consider using registered post to distribute the questionnaires (as was done here) together with e-mail distributions as was done by Weiss (2002, 2003), or through other web-based interfaces. Also, face-to-face interviews and greater buy-in from various specialists or special interest groups could help increase the response rate. Finally, paying respondents to participate, as is done by pharmaceutical companies, would likely increase the response rate.7
In addition to broad concerns over the response rate, a non-zero set of respondents submitted incomplete questionnaires. The omission of particular information could have been due to the sensitive nature of these questions or for other reasons, and may have created sources of bias in the analysis. For example, tax avoidance could lead to an understatement of practice profit or, alternatively, an overstatement of practice costs. The purchase of motor vehicles, the cost of fuel and cell phone expenses, inter alia, for personal use, could decrease profits and, ceteris paribus, reduce tax liability. Behavioural choices of this nature are problematic in this research, since they directly affect reported profits. Therefore, we always note the number ofcomplete responses used in the analysis, and further accept that our results are only relevant for the respondents, for which we have complete information and, which we hope, is truthfully reported.
Finally, with any voluntary questionnaire, there will always be concerns over sample selection. Unfortunately, it is not possible to examine, through external data sources, whether the respondents were significantly different from the population of specialists in Gauteng, in general. However, we can report on some concerns that we have observed. Specifically, only eight respondents (11.5%) had been in private practice for five years or less, whereas 37 (53.6%) had been in private practice for fifteen years or more, implying that very few inexperienced practitioners responded. Further, only two respondents were under the age of 40 (both 37), and only two were female. Finally, all but five respondents were white. Therefore, all of our reported results are only accurate for the respondents, and cannot be generalized to the population of specialist physicians practicing in Gauteng or beyond; see Appendix Table A1 for a description ofthe analysis data.
5 Results
In this section, the results of the empirical analyses, both nonparametric and parametric are described. The nonparametric model allows for mixed data, although mixed data is not always used, and the nonparametric models, due to the sparseness of the data, are used to suggest functional forms for linear models. The nonparametric bandwidths are determined via least squares cross-validation, while the underlying kernels are the second order Gaussian kernel for continuous data and a categorical kernel for discrete data. The nonparametric estimates are computed using the np package (Hayfield & Racine, 2008), installed in R (R Core Development Team, 2008). Bootstrapped confidence intervals for the estimates are calculated using 399 replications with replacement, and crosssections of the nonparametric results are graphed to illustrate the estimated relations.8 For purposes of presentation in the figures, the data has been trimmed by removing the top and bottom 10 per cent to alleviate concerns over the sparseness ofthe data.9
5.1 Specialist practice revenues
As previously noted, the accounting and economic definitions of revenues for a firm are determined by a simple summation of the price of each output multiplied by the quantity of each output. In the first part of our empirical analysis, we consider whether or not that definition holds, and provide estimates of the per unit price. Of the 53 specialist practices, for which we had revenue data, revenues averaged R135 963 per month (SD = 79 871).
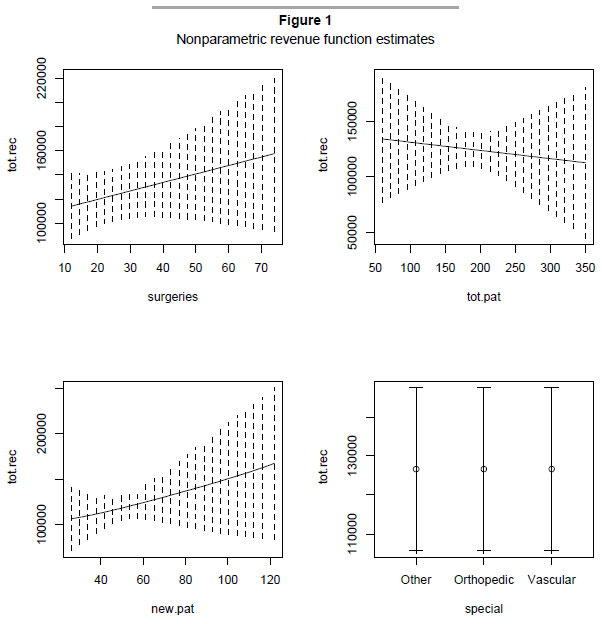
The nonparametric results are presented in Figure 1. For the continuous data, the solid line represents the conditional relationship between each output measure and the practice's total receipts, while the dotted lines present bootstrapped confidence intervals. However, for the discrete data, circles represent the nonparametric estimates, while the bars represent the confidence intervals for the estimates. Partly due to the sparseness of the data, a linear relationship between total revenues and each unit of output cannot be rejected.10 Furthermore, given the confidence bands surrounding the estimated relationship, it is also not possible to reject the hypothesis that there is no relationship between revenues and outputs.
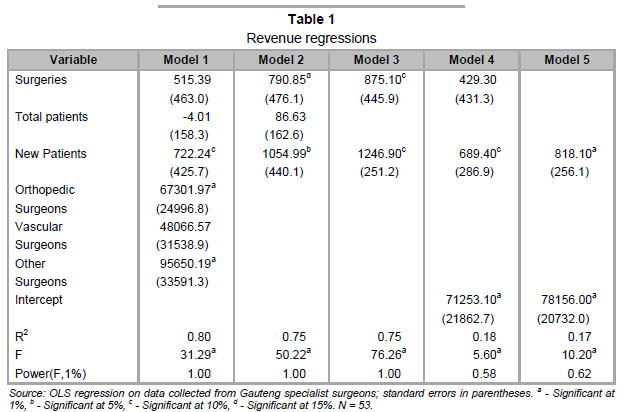
Given the linearity suggested by the nonparametric regression, linear regressions between revenues and output were also estimated. A number of alternative specifications were estimated, all of which are presented in Table 1. In all cases, the regression was significant, meaning that there is an underlying relationship between revenues and outputs. However, intercepts were not included in all of the regressions, and, therefore, regression significance should be treated with caution. Specifically, the resulting R2 is high for the first three regressions, as is the power of the F test for a 1 per cent significance level. Once the intercept is included, both the regression R2 and the power of the F test fall to levels that are more realistic for such a small sample. Accordingly, in the last two columns, the probability of failing to reject the null hypothesis (that the included variables are uncorrelated with total practice revenues) when it is false is near 60 per cent. It should also be noted that power statistics associated with any particular parameter were also investigated; however, due to the extremely large effect sizes (parameter estimates), the power rarely deviated from one regardless of regression model.
Although the small sample sizes impact on statistical power related to model fit, sample size does not impact on individual parameter effect sizes, to which we now turn. The only consistent pattern arising from the regressions is that the number of new patients arriving at the practice in the last month significantly increases revenues. Depending upon the specification, each additional patient is worth between R689 and R1250 of additional revenue. On the other hand, average revenues were estimated to be on the order of R70 000 to R78 000. Considering specialty-based averages, orthopaedic surgeons and other surgeons (cardiothoracic surgeons and neurosurgeons) are estimated to earn more, on average, than vascular surgeons.
Given the range of estimates, the ability to separate across models would be quite useful. ANOVA tests yield that Model 1 is preferred to both Model 2 (F=3.83, p=0.02) and Model 3 (F=2.95, p=0.03), and that Model 4 is preferred to Model 5 (F=0.99, p=0.32); furthermore, neither Model 4 (F=0.55, p=0.68) nor Model 5 (F=0.61, p=0.65) can be statistically differentiated from Model 1. In other words, the models are not easily separated. Theoretically, however, revenues should only be a function of outputs, and, as such, should not include an intercept. Technically, Models 1 through 3 do not include intercepts, although, since there are only three specialties, the intercept in Model 1 is implied. Furthermore, since there are three different types of specialties, and all of these specialists are operating in the same region, it is reasonable that there will be differences in earnings across specialist types. Combining theory, practicality with respect to the data limitations and statistical results yields Models 1, 4 and 5 as the most plausible. Therefore, revenues per new patient average between R689 and R818, while the base average specialist earnings exceed R70 000.
5.2 Specialist practice costs
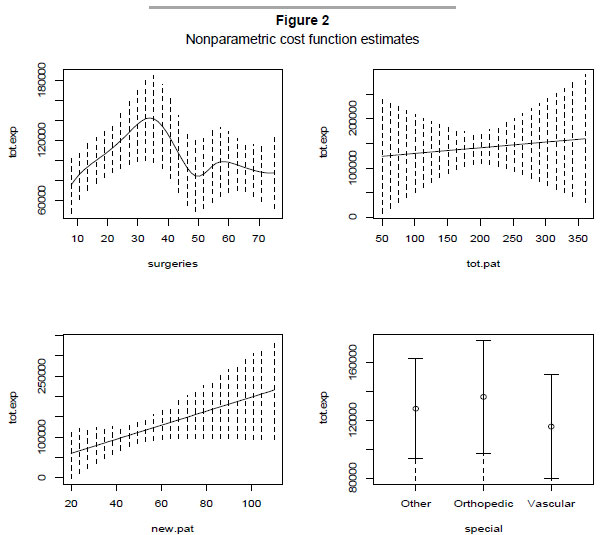
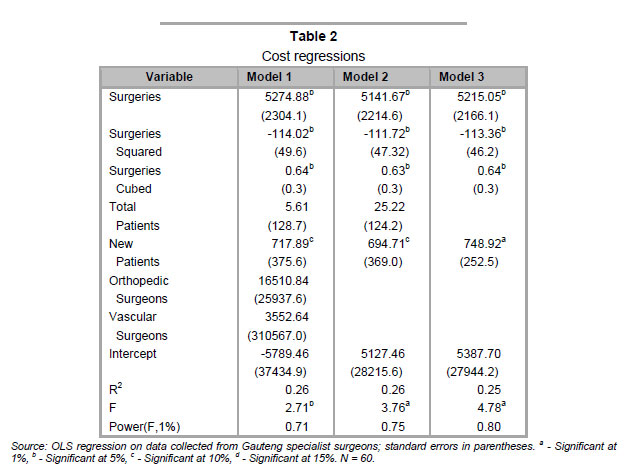
In addition to empirically examining the relationship between revenues and output at the practice level, we also examined the relationship between costs and output. In addition to the nonparametric model, linear specifications were also considered. For the 66 practices for which we had cost data, total costs per doctor at each practice average 108 933 per month (SD = 73 950). As with the revenue regressions, reported above, we first estimate a nonparametric regression to see if costs are constant, increasing or decreasing with output. Unlike revenues, costs are expected to include both a fixed component and a variable component, and, therefore, an intercept should be included in the regression to account for the average fixed cost of output. The nonparametric regression is presented in Figure 2, and the figure includes bootstrapped confidence intervals, while the linear regression results are presented in Table 2.
The nonparametric relationships between costs and outputs, illustrated in Figure 2, appear to be cubic in the number of surgeries, linear for both the total number of patients and the number of new patients and quite similar across specialty.11 However, it is also quite clear in Figure 2, as it was in Figure 1, that there is a fair bit of noise in the nonparametric regressions, such that a number of other relationships cannot be ruled out. The linear cost regression, the specification of which was informed by the nonparametric results, does support the nonparametric analysis. Three model specifications were examined, and the regression results for each specification are presented in Table 2. Each of the models is significantly different from a model based solely on the mean of observed costs, and the models cannot be statistically differentiated; Models 1 and 2 are statistically similar (F=0.31, p=0.73), as are Models 2 and 3 (F=0.22, p=0.88), although Model 3 has the most statistical power, and is, therefore, the preferred specification. According to Model 3, new patients increase costs, by approximately R750, while there is a pronounced cubic relationship between surgeries performed and total costs. Finally, average fixed costs are estimated to be insignificant across all specifications.
5.3 Specialist earnings
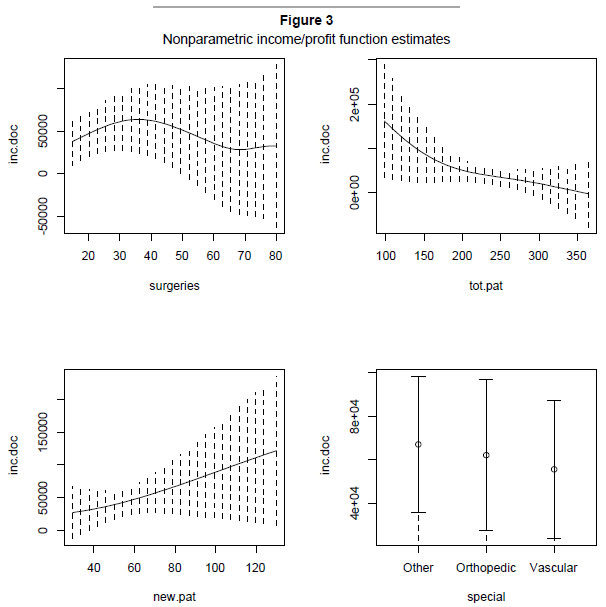
In the next empirical analysis, the preceding two analyses are combined to consider the relationship between profits and output. However, rather than calculating simple profits, the doctor's reported salary is also included to create a measure of income for the practicing specialist, on the assumption that the majority of profits from single specialist practices are paid to the specialist. Specialist income, according to this measure, averages 64 807 (SD=65 569) for the sample of 40 specialists. As before, nonparametric regression informs the functional specification for the subsequent linear models. The estimated nonparametric relationship, with confidence bands, is illustrated in Figure 3.
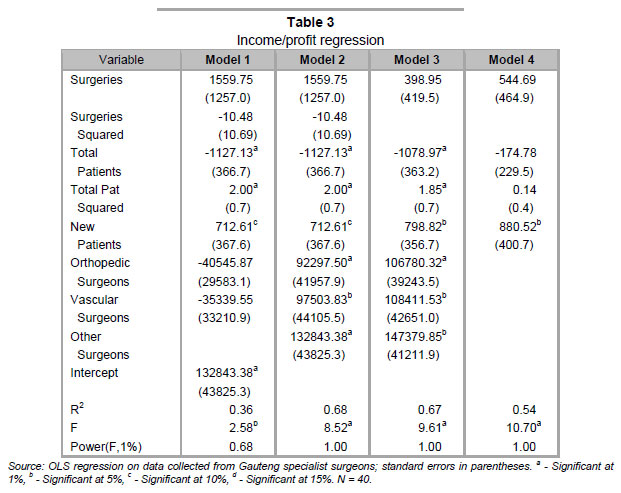
The nonparametric results illustrated in Figure 3 suggest that income is quadratic and concave in the number of surgeries. Income is decreasing and quadratic in the total number of patients, and income is linear in the number of new patients.12 However, compared to the revenue and cost regressions, the income data is sparser. Due to that sparseness, the bootstrapped confidence intervals cannot rule out a number of other empirical relationships. A series of linear regressions, informed by the nonparametric results reported in Table 3, are examined.
The results in Table 3 are based on numerous specifications; however, Models 1 and 2 are isomorphic. Differences in the reported results reveal the problems associated with relying on R2 and power statistics, when the regression does not include an intercept. Although the power in Model 1 is acceptable, it should be identical to the power in Model 2, given that they are the same models. The differences in power arise from the differences in the R2 (adjusted or not) values associated with the models, due to the inherent difficulties of calculating the R2 in a model without an intercept. In terms of comparison, as noted, Models 1 and 2 are identical, while Models 2 and 3 cannot be statistically separated (F=0.96, p=0.33); however, Models 3 and 4 can be separated, and Model 3 is preferred to Model 4 (F=4.27, p=0.01). With respect to these results, although Models 1, 2 and 3 are statistically similar, Model 3 is the easiest to interpret. Using Model 3, the results suggest that income increases with the number of new patients, at the rate of approximately R712 per patient. Furthermore, there is a convex relationship between income and total patients. Finally, average income, before practice outputs are included, ranges from R106 780 per month for orthopaedic surgeons to R147 380 for other surgeons, including cardiothoracic surgeons and neurosurgeons.
5.4 Returns to experience
Finally, the previously calculated measure of specialist income is used to consider returns to experience for these specialists. The nonparametric regression prediction, with confidence bands, is illustrated in Figure 4, and the linear regression results are presented in Table 4.

The estimated relationship between years of experience in the current practice and doctor's income is seemingly quadratic in nature, at least for these specialist surgeons.13 Therefore, the linear regression results, reported in Table 4, allow for experience and its square. Regardless of regression choice, a quadratic relationship was estimated; however, more data is needed to increase the precision of the estimates of the relationship between earnings and years of experience. Although the results are not precise in all models, precision is increased, when an intercept is not included. Furthermore, the reported models are quite similar; see below.
As with the results in the preceding subsection, the models reported in the first two columns are isomorphic. Despite the modelling similarity, both the R2 and the power of the F test are very different. However, from that base of similarity, it is also possible to compare Models 1 and 2 with Models 3 and 4. Models 1 and 3 are statistically indistinct (F=0.46, p=0.63), as are Models 2 and 4 (F=0.87, p=0.46). Despite the imprecision, it is reasonable to conclude that, in this sample, returns to experience are quadratic, especially considering that Model 4 cannot be statistically distinguished from any of the other models.14 According to the reported estimates in Model 4, productivity appears to decline following 19 years of experience.
6 Concluding remarks
The research presented in this paper is based on a purposive survey of Gauteng-based specialist doctors, primarily surgeons. The survey was undertaken between 2007 and 2008, with the support of the South African Medical Association and the Foundation for Professional Development, whose interest in the survey was partly driven by the need to understand emigration of South African doctors. Although neither the survey nor the empirical analysis directly addressed emigration, since all of the responding specialists are still based in South Africa, the survey and analyses provide information on revenues, costs and income. Specialists can use these results to determine if they are doing better or worse than average. Furthermore, government can use these results to better inform their pay policies for specialists working in the public sector.
The results of the analysis show that new patients and the number ofsurgeries performed drive revenues. The same factors drive costs, although the shape of the relationship differs. In terms of income, both new patients and total patients are the most important factors, which is interesting, because the total number of patients is not empirically related to either costs or revenues. Finally, specialist income has only been weakly linked to earnings, at least for this sample of Gauteng surgeons.
Unfortunately, the response rate was low, resulting in low precision in most of the regressions. Furthermore, since the survey relied upon voluntary response, and voluntary response might be driven by factors that cannot be included in the empirical analysis, the results can be generalized neither to all specialists operating in Gauteng nor to all specialists operating in South Africa.
Therefore, we conclude by arguing that further research is needed in this area, as is the need for access to more data. Creating incentives for participation would have the potential to increase the amount of data available for analysis, although such incentives could also affect the analysis. One option would be for the South African Medical Association to set-up a website upon which all doctors, and not just specialists, can record information related to their practices, possibly requiring submission in order for the doctor to keep their medical license updated. Although it might not be ethical to require submission for license maintenance, it would be possible to award Continuing Professional Development points for their participation. By providing an incentive to participate, it would be possible to collect much more data than we are currently able to access.
Acknowledgement
The authors would like to thank the South African Medical Association and the Foundation for Professional Development, Dr Gustav Wolvaardt, and the participating physicians for their help with this research. The authors would also like to thank Economic Research Southern Africa for their support of this research. Finally, although taking responsibility for any of the remaining errors, the authors would like to thank two anonymous reviewers for a number of comments that have greatly improved our exposition and presentation.
Endnotes
1 Our survey only covers doctors working in South Africa, and, therefore, cannot provide direct evidence related to emigration choices pursued by South African doctors.
2 In addition to international migration, South Africa, like most developing countries, faces serious concerns related to internal migration, especially from rural regions to urban regions. Although de Vries and Reid's (2003) cohort study suggests that targeting admissions to include more candidates from underserved regions would lead to increased physician service to these underserved regions, we were unable to locate a similar study related to international migration.
3 A more detailed discussion of the nonparamametric regression is included in Koch and Slabbert (2011).
4 It should also be noted that a similar bias-efficiency trade-off exists within the context of nonparametric regression. Generally, bias depends on the bandwidths, which shrink as n increases, although local linear regression has better bias properties than the local constant regression in many instances (Fan & Gijbels, 1996).
5 In most applications, optimal bandwidths differ significantly from the plug-in bandwidths, and, given computing power, cross-validated bandwidths can often be calculated. The conditions require that h l → 0, while nh1  hm → ∞ . See Li and Racine (2007).
6 Another concern that arises is the relationship between ability and emigration. If the most able physicians were the most likely to emigrate, the most experienced surgeons in the sample would be the least able. In other words, the most experienced (in the sample) would be expected to have relatively low earnings. Therefore, the returns to experience would be underestimated.
7 We thank a reviewer for pointing out that pharmaceutical companies often pay physicians to participate in research projects.
8 Details related to replication can be found in Hayfield and Racine (2008). See figures 1-4. Since a few of the regressions include up to three independent variables, the overall relationship would require a four-dimensional plot, and therefore, a cross-section plot is, instead, illustrated.
9 The regressions continue to make use of all of the data; however, the illustrations only present the results for a subset of the data. We thank an anonymous reviewer for the suggestion.
10 The R2 from the nonparametric regression is 0.26, suggesting a fairly good fit from such a small cross-section, while the estimated bandwidths are 669091589, 1062139349, 52.29 and 0.67, for surgeries, total patients, new patients and specialty types, respectively.
11 The R2 from the nonparametric regression is 0.66, an even better fit than for the revenue regression, while the estimated bandwidths are 8.2, 42910328, 9092821 and 0.33, for surgeries, total patients, new patients and specialty type, respectively.
12 The R2 from the nonparametric regression is 0.74, suggesting exceptional fit for such a small cross-section, while the estimated bandwidths were 16.2, 68.7, 47.8 and 0.5 for surgeries, total patients, new patients and type of specialty, respectively.
13 The nonparametric regression including specialty type is available upon request; however, specialty type, as in all of the previous nonparametric regressions, is not related to earnings. Regardless of whether or not specialty is included, the R2 of 0.05 from the regression is rather low. The cross-validated bandwidth for years of experience at the current place of employment is 11.8, and that for the specialty is 0.67.
14 Regressions were also run for different measures of experience, including years qualified to practice and years operating in private practice. In each case, the results were similar; the results are available from the authors upon request. Given the fact that the majority of the doctors in the sample were operating in the same practice the entire time, the similarity of results across various measures of experience is not surprising.
References
AITCHISON, J. & AITKEN, C.G.G. 1976. Multivariate binary discrimination by the kernel method. Biometrika, 63:413-420. [ Links ]
BRENTNALL, V.F. 2007. Exclusive survey - expenses: rising costs hit all physicians. Medical Economics , 84:26-31. [ Links ]
DE VRIES, E. & REID, S. 2003. Do South African medical students of rural origin return to rural practice? South African Journal of Medicine, 93(10):789-793. [ Links ]
EASTWOOD, J.B., CONROY, R.E., NAICKER, S., WEST, P.A., TUTT, R.C. & PLANGE-RHULE, J. 2005. Loss of health professionals from sub-Saharan Africa: the pivotal role of the UK. The Lancet , 365(9747):1893-1900. [ Links ]
FAN, J. & GIJBELS, I. 1996. Local polynomial modelling and its applications. London: Chapman and Hall. [ Links ]
HAGOPIAN, A., THOMPSON, M.J., FORDYCE, M., JOHNSON, K.E. & HART, L.G. 2004. The migration of physicians from sub-Saharan Africa to the United States of America: measures of the African brain drain. Human Resources for Health, 2(17) doi:10.1186/1478-4491-2-17. [ Links ]
HALL, P., RACINE, J. & LI, Q. 2004. Cross-validation and the estimation of conditional probability densities. Journal ofthe American Statistical Association, 99:1015-1026 [ Links ]
HAYFIELD, T. & RACINE, J.S. 2008. Nonparametric econometrics: the np package. Journal of Statistica l Software, 27(5), http://www.jstatsoft.org/v27/i05/. [ Links ]
HOLLINGSWORTH, B. 2003. Nonparametric and parametric applications measuring efficiency in health care. Health Care Management Science, 6(4):203-218. [ Links ]
JOUBERT, G., BAM, R.H. & CRONJE, H.S. 1999. How to write a protocol. Bloemfontein: University of the Free State. [ Links ]
KIBAMBE, J.N. & KOCH, S.F. 2007. South African hospital efficiency: DEA applied to a Gauteng sample of South African public hospitals. South African Journal of Economics, 75(2):351-368. [ Links ]
KIRIGIA, J.M., LAMBO, E. & SAMBO, L.G. 2000. Are public hospitals in Kwazulu-Natal province of South Africa technically efficient? African Journal of Health Sciences, 7(3-4):5-11. [ Links ]
KIRIGIA, J.M., SAMBO, L.G. & SCHEEL, H. 2001. Technical efficiency of public clinics in Kwazulu-Natal province of South Africa. East African Medical Journal, 78(3 Supp):S1-S13. [ Links ]
KOCH, S.F. & SLABBERT, J.D. 2010. Semiparametric Stochastic frontier analysis of specialist surgeon clinics. University of Pretoria Working Paper, No. 2010-20 . [ Links ]
KOCH, S.F. & SLABBERT, J.D. 2011. An analysis of specialist surgeons and their practices. Economi c Research Southern Africa Working Paper, No. 212 . [ Links ]
LABONTE, R., PACKER, C. & KLASSEN, N. 2006. Managing health professional migration from sub - Saharan Africa to Canada: A stakeholder inquiry into policy options. Human Resources for Health, 4(22), doi:10.1186/1478-4491 -4-22. [ Links ]
LEEDY, P.D. & ORMOND, J.E. 2001. Practical research: planning and design. Ohio: Merrill Prentice Hall. [ Links ]
LI, Q. & RACINE, J.S. 2007. Nonparametric econometrics. Princeton: Princeton University Press. [ Links ]
MULLAN, F. 2005. The metrics of physician brain drain. The New England Journal of Medicine , 353(17):1810-1818. [ Links ]
NEEDLEMAN, R. 2005. Private practice or not: economic considerations for the physician assistant. Th e Internet Journal ofAcademic Physician Assistants, 4(2). [ Links ]
R DEVELOPMENT CORE TEAM. 2008. R: A language and environment for statistical computing . [ Links ]
R Foundation for Statistical Computing, Vienna, Austria. ISBN 3-900051-07-0, http://www.R-project.org. [ Links ]
RACINE, J. & LI, Q. 2004. Nonparametric estimation of regression functions with both categorical and continuous data. Journal of Econometrics, 119(1):99-130. [ Links ]
THE LANCET 2000. Medical migration and inequality of care. Lancet 356(9225):177 [ Links ]
WEISS, G.G. 2002. Expense survey: what it costs to practice today. Medical Economics, 79(23):36-41. [ Links ]
WEISS, G.G. 2003. Practice expenses. Medical Economics, 80(21):31-37. [ Links ] ZERE, E., MCINTYRE, D. & ADDISON, T. 2005. Technical efficiency and productivity of public sector hospitals in three South African provinces. South African Journal ofEconomics, 69(2):336-358. [ Links ]
Accepted June 2011


