


Servicios Personalizados
Articulo
 Inglés (pdf)
 Articulo en XML
 Referencias del artículo
Indicadores

Links relacionados
-
 Citado por Google
 -
 Similares en Google
Compartir

 Permalink
South African Journal of Economic and Management Sciences
versión On-line ISSN 2222-3436
versión impresa ISSN 1015-8812
S. Afr. j. econ. manag. sci. vol.14 no.2 Pretoria ene. 2011
ARTICLES
Travel service exports as comparative advantage in South Africa
Johan Fourie
Department of Economics, University of Stellenbosch
ABSTRACT
World service exports have grown at a rapid rate over the past few decades. While some countries have benefited from the surge in service exports, others have been left behind. This paper provides a snapshot of South Africa's comparative performance in service exports, using a new measure of revealed comparative advantage, the normalised revealed comparative advantage (NRCA). Countries are ranked according to their performance in 10 service export sectors. South Africa is found to reveal a strong comparative advantage in travel service exports (tourism). A discussion of the travel services sector follows, with historical, theoretical and empirical evidence to support the NRCA findings.
Keywords: services trade, normalised revealed comparative advantage, Balassa index, tourism, developing countries
JEL: F14
1 Introduction
While world service exports have increased rapidly over the past three decades, often surpassing the high growth rates of merchandise exports, the high growth rates have not been shared by all; country experiences differ by region, development level, country size and over service sector. Understanding the growth in service exports is important because a growing service sector is associated with a rise up the per capita income ladder and improvement in the level of the country's development. One avenue for this to occur is through the contribution of service exports to a country's economic growth (Mattoo & Hoekman, 2008).
This paper provides a comparison of services exports on a global scale. It ranks countries' normalised revealed comparative advantage performance by sector in 2005, which allows a comparative analysis of 10 service sectors for 147 countries. Following this, South Africa's performance is assessed. It is found that, in 2006, South Africa revealed a comparative advantage in only two sectors, namely communications and travel services, with travel services the stronger of the two. This is followed by a discussion of travel service exports in South Africa, providing historical, empirical and theoretical evidence to support the comparative results.
2 Definition and measurement
The World Trade Organisation (WTO) classifies four modes of service trade: Mode 1 is defined as the supply of a service from the territory of one member (country) into the territory of another member (also known as cross-border supply); Mode 2 is the supply of a service in the territory of one member to the service consumer of any other member (consumption abroad); Mode 3 is the supply of a service by a service supplier of one member, through commercial presence in the territory of any other member (commercial presence); and Mode 4 is the supply of a service by a service supplier of one member, through the presence of natural persons of a member in the territory of any other member (presence of natural persons) (UN, 2002).
The measurement of trade-in-services has been a serious constraint on sound research. The only source for accurate service trade statistics is the current account of the balance of payments (BOP), compiled in South Africa by the Reserve Bank and published in the Quarterly Bulletin. The fifth edition of the International Monetary Fund (IMF) Balance of Payments Manual (BPM5) proposes that statistics disaggregate trade-in-services between residents and non-residents into 11 sectors: transportation, travel, communications services, construction services, insurance services, financial services, computer and information services, royalties and license fees, other business services, personal, cultural and recreational services, and government services (WTO, 2006:10). The South African Reserve Bank currently publishes only two categories, transportation services (5700Y) and travel services (5043Y), with other services (5051Y) the difference of total services (5002Y) and transportation and travel. Transportation services are split into passenger fares (5041Y) and other transportation services (5042Y), while travel services are split into business travel (5701Y) and other travel (5702Y). The Reserve Bank is in the process of expanding the existing selection of service categories.
Yet, even if access were available to the full coverage of service categories as proposed by BPM5, no feasible disaggregation would be possible between the different modes of supply. To do this, the Manual on Statistics of International Trade in Services (MSITS) proposes the measurement of services by foreign affiliates within the framework of Foreign Affiliates Trade in Services (FATS) statistics. This framework describes the operations of foreign affiliates (including indicators such as turnover, exports and imports of goods and services, number of enterprises, etc.) with a particular, but not exclusive, focus on services (WTO, 2006). Amalgamating FATS with BPM5 will make trade-in-service exports and imports available for all 11 categories over the four modes of supply. However, very few countries, including South Africa, currently compile FATS datasets.
3 World service exports
World service exports have grown at a rapid rate over the past few decades. Between 1980 and 2006, world service exports grew by 7.88 per cent annually (UNCTAD, 2008). This rate has increased towards the end of the period; between 2000 and 2006 an annual rate of 10.60 per cent was achieved (UNCTAD, 2008).1 The dramatic growth in merchandise exports has, however, overshadowed the nevertheless impressive growth rates of service exports. In fact, service exports increased faster than merchandise exports until the early 1990s, after which growth was relatively similar, with merchandise reclaiming a bigger share towards the end of the period.
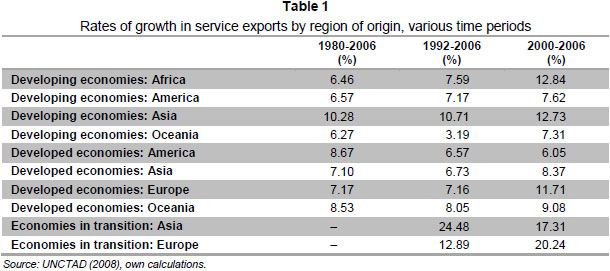
However, while some countries have benefited from the surge in service exports, others have been left behind. Table 1 provides an overview of the growth in service exports across the globe. Asian countries have seen the highest growth in service exports since 1980, at 10.28 per cent annually throughout the period, with most of the rest of the world achieving only moderate rates. This resulted in a warning by Langhammer (2002) that such growth will be limited to country-specific episodes, such as the growth in Indian IT exports. Since 2000, however, African countries have exhibited remarkably high growth rates in service exports, at an annual rate of 12.84 per cent over six years. Although such growth is from a small base, it is in sharp contrast to the modest growth rates of the preceding two decades.
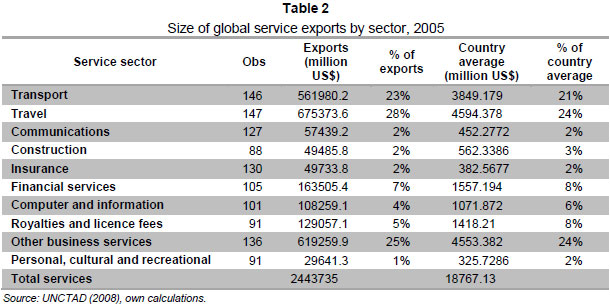
Table 2 gives the breakdown of service exports by type. Transport, travel and other business services cover more than 75 per cent of total service exports. These categories are also the most reported per country (146 countries for transport, 147 for travel and 136 for other business services), and therefore reveal the most reliable comparative advantage figures (see later). Fewer countries report complete disaggregated data over all categories; only 87 countries reported construction service exports. While this may influence the results, the countries excluded are of relatively moderate size compared to the leading industrial nations, and would therefore have little significance on the comparative advantage as calculated for the other countries.
4 South African service exports
The first service export data that are available for South Africa come from 1946 (SARB, 2008). The South African Reserve Bank publishes two series of service exports: the value of service receipts (KBP5002J) and exports of services (KBP6609J), both in current prices. It is not clear what the difference is between them. From 1960 the two sets of data are similar. Between 1946 and 1959, exports of services (KBP6609J) are significantly above the value of service receipts (KBP5002J), and implausibly so. If the KBP6609J data are to be believed, service exports saw a drop of more than 80 per cent between 1959 and 1960. KBP5002J is therefore used here.
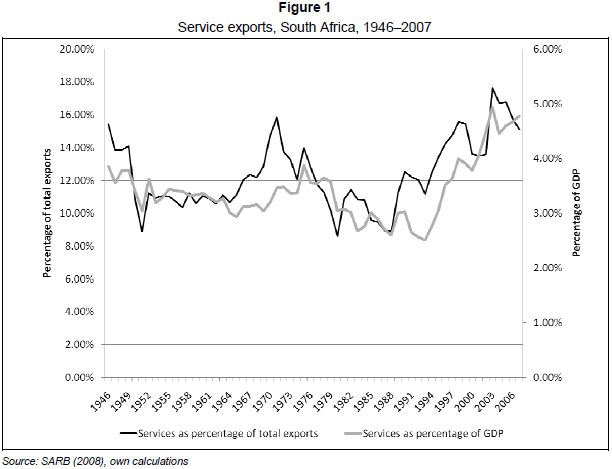
Figure 1 reports service exports as a share of total exports (goods and services). During the first few years for which data are available, service exports was an important component of total exports (more than 15 per cent in 1946). This share soon declined, to stabilise at around 11 per cent for most of the 1960s. The 1970s, especially during the early years, saw rapid gains in service exports vis-a-vis goods exports. The political sanctions and economic turmoil, however, resulted in stagnating and declining service exports during most of the 1980s. The trend reversed again in the late 1980s, with sporadic periods of growth but higher volatility. Since the 1990s, especially after the political transition to a full democracy in 1994, service exports have again shown higher growth than goods exports. Figure 1 also reports service exports' share of gross domestic product (GDP). In 1946, 3.86 per cent of GDP consisted of service exports. This share declined steadily until 1993 (reaching 2.51 per cent), with some growth exceptions during the late 1970s. Since 1994, the trend has been reversed, with service exports reaching 4.78 per cent of GDP in 2007. In a recent study for the South African Government, Edwards and Lawrence (2006) describe service exports as the 'bright part' of South Africa's post-apartheid trade performance, with average growth between 2000 and 2005 of 8.6 per cent.
5 Revealed comparative advantage
The theory of comparative advantage is derived from David Ricardo's insight that trade benefits countries that specialise in the production of goods and services with the lowest opportunity costs. Empirically, comparative advantage is revealed through the Balassa index (Balassa, 1965).2 The RCA measure is derived from the following formula:
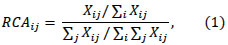
where Xij represents exports of sector i form country j. The numerator represents the percentage share of a given service sector in national exports. The denominator represents the percentage share of a given service sector in world exports. When RCAij is above 1, country i's competitiveness in product j is greater than its average competitiveness, in other words country i's comparative advantage is revealed.
The normalised RCA measure was developed by Yu, Cai and Leung (2009) to calculate an RCA measure that allow for more precise comparisons across time, country and sector. The NRCA formula is given as:

Where Xij represents actual exports and (ΣiXij)(ΣiXij) denotes the comparativeadvantage-neutral level in exports of commodity j for country i. Although not as intuitive as the Balassa index, the normalised RCA corrects for the asymmetry problem of the standard RCA. This also makes the NRCA a more appropriate variable for regression analysis: -0.25 < NRCAij < 0 suggests that country i's actual export of commodity j is lower than the comparative-advantage-neutral point, while 0 < NRCAij < 0.25 suggests that the country i has a comparative advantage in the export of commodity j.
This paper uses the new measure to calculate South Africa's comparative performance, the first paper to do so for the services sector. Data were obtained from the United Nations Conference on Trade and Development (UNCTAD) 2007 Handbook of Statistics (UNCTAD 2008). All 11 categories are reported in the UNCTAD data for 186 unique countries and territories from 1980 to 2006. Government services are excluded from this analysis, as they are usually considered non-tradable. The snapshot view is taken for 2005, the year for which data are available for the largest number of countries in the sample.
6 comparative results
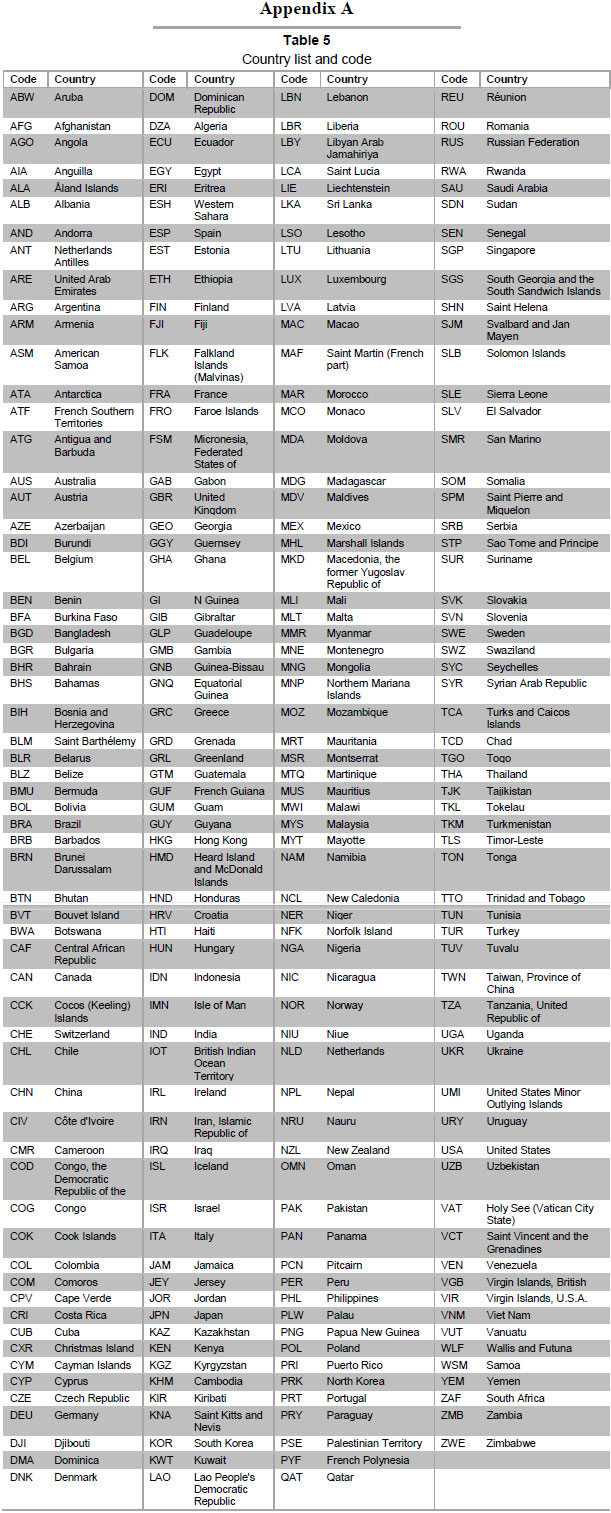
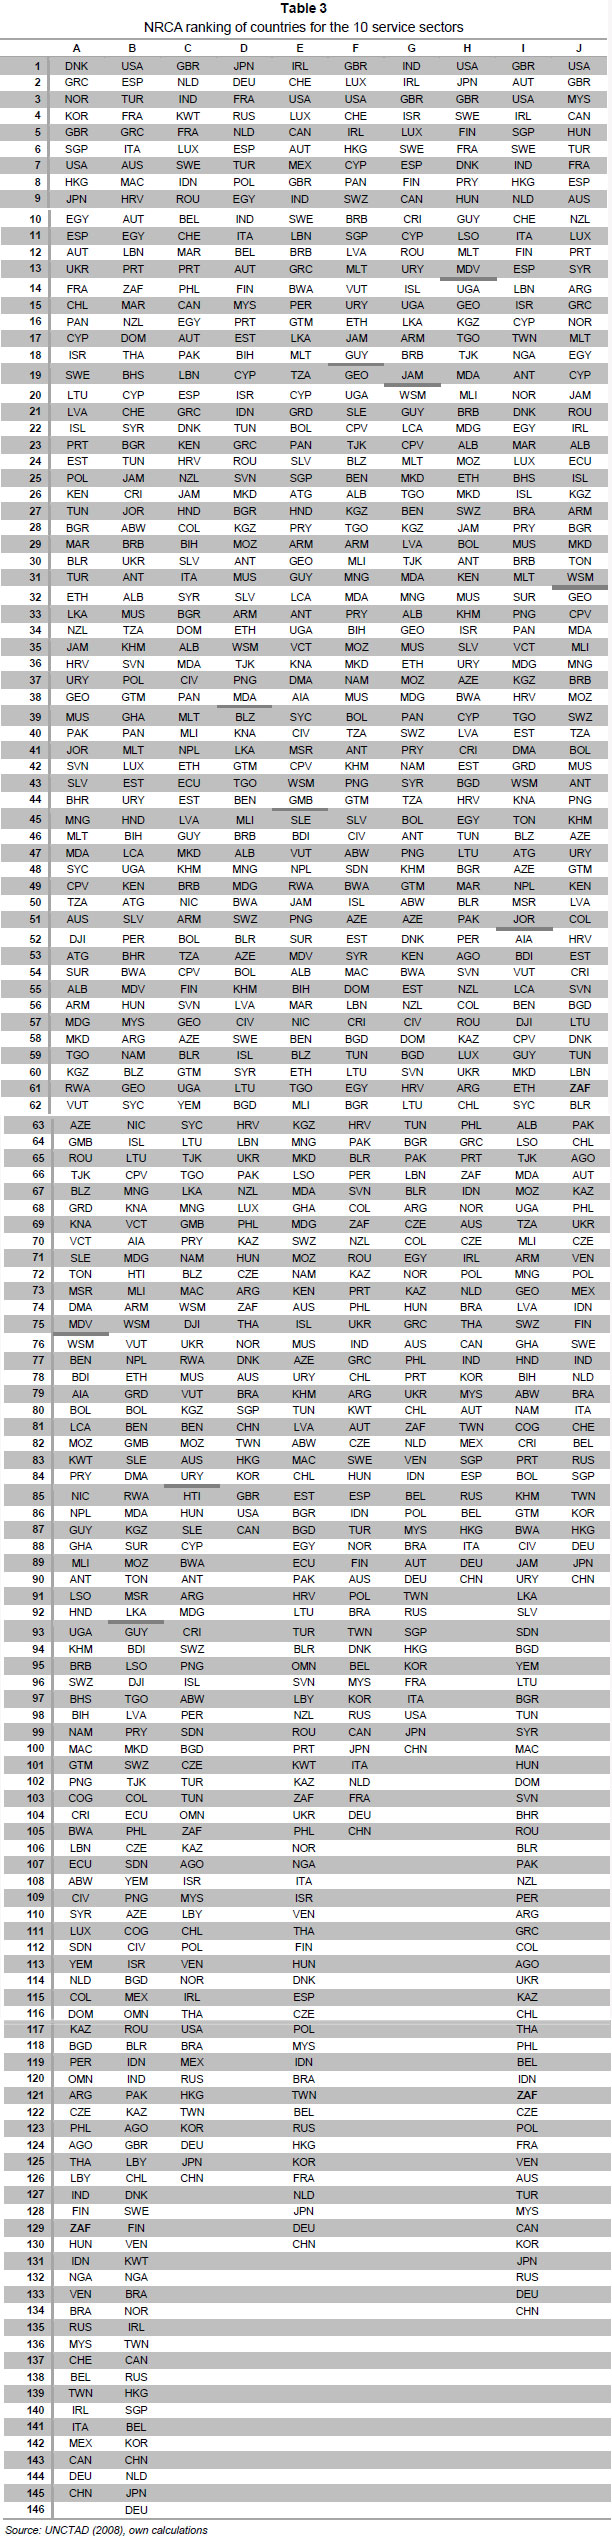
The results are reported in Table 3. The 10 sectors are transport (A), travel (B), communication (C), construction (D), insurance (E), financial services (F), computer and information services (G), royalties and license fees (H), other business services (I), and personal, cultural and recreational services (J). The appendix lists the countries and their international ISO 3166-1 alpha-3 code (used in Table 3). Countries located above the dark line all reveal a comparative advantage (i.e. positive NRCA), while those below the line do not reveal a comparative advantage (i.e. negative score).
A number of countries that specialise strongly in service exports can be identified from the results: Denmark, Greece, Norway and South Korea in transport services; the USA, Spain, Turkey, France and Greece in travel services; the UK, the Netherlands, India, Kuwait and France in communication services; Japan, Germany, France, Russia and the Netherlands in construction services; Ireland, Switzerland, the USA, Luxembourg and Canada in insurance services; the UK, Luxembourg, the USA, Switzerland and Ireland in financial services; India, Ireland, the UK, Israel and Luxembourg in computer and information services; the USA, Japan, Britain, Sweden and Finland in royalties and licence fees; the UK, Austria, the USA, Ireland and Singapore in other business services; and the USA, the UK, Malaysia, Canada and Hungary in personal, cultural and recreational services.
The G8 countries perform relatively well on the rankings of RCA service exports. The UK, for example, is decidedly a service export economy. It reveals comparative advantage in eight of the ten service sectors, six of them with a high NRCA score. The largest developing countries are not as specialised as the G8 countries in the export of services. China, for example, currently has no revealed comparative advantage in the services sector. Brazil and Mexico have only weak comparative advantage in 'Other business services' and insurance. In line with the literature (D'Costa, 2003; Gordon & Gupta, 2004; Tharakan, Van Beveren & Van Ourti, 2005), India is remarkably specialised in computer and information services. Further-more, India also has a high ranking in communication service exports, as well as a positive NRCA in construction, insurance and other business services. Some smaller developing countries seem to specialise in service exports: Egypt, for example, ranks high in various sectors, including transport, travel, communications, construction, and personal, cultural and recreational services.
Trade theory suggests a number of possible determinants of a country's comparative advantage. Ricardian comparative advantage, for example, explained through differences in technology, may explain India's strong performance in computer and information services or Britain, Luxembourg and Switzerland's dominance in financial service exports, while the Heckscher-Ohlin theorem, predicting that countries will export products that intensively use the its most abundant resource, may explain countries comparative advantage in construction or travel services. Linder's demand-side theory and Krugman's new trade theories may also be applicable. However, these can only be speculations and should be empirically evaluated.
Moreover, Table 3 shows that South Africa reveals a strong comparative advantage in only one service sector: travel service exports3. The results for South Africa are discussed below.
7 South Africa's comparative advantage in service exports
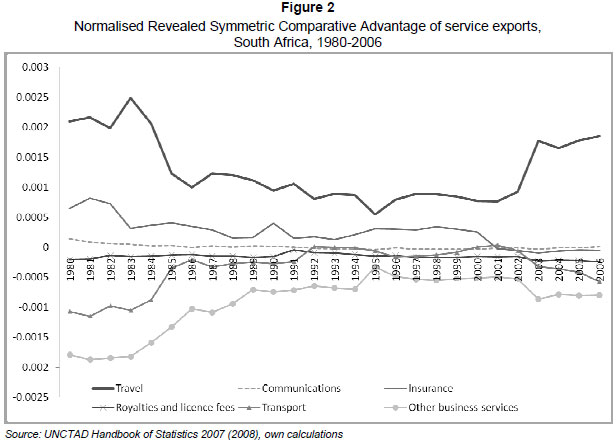
A number of studies have investigated South African service sectors, including the financial sector (Butterworth & Malherbe, 1999), construction (Teljeur & Stern, 2002), transporttation (Naude, 1999), distribution services (Achterberg & Hartzenberg, 2002) and communications (Hodge, 1999).4 These studies find some growth in the post-1994 period, but due to the nature of the analysis (sector-specific) they cannot conclude whether such a sector has a relative trade advantage. That is one aim of this study. While Table 3 has shown South Africa's normalised revealed comparative advantage for 2005, Figure 2 reports the changes in South Africa's service sectors over the period 1980 to 2006, given the UNCTAD dataset.5
Apart from the fall in the RCA of insurance services in 2001 (which is due to an inexplicable but dramatic decrease in South African insurance service exports, from $450.9 million in 2000 to $53.5 million in 2001 in the dataset) and a growing RCA for government services, the time trends seem to be relatively stagnant, suggesting that a country's comparative advantage is a slow-moving variable. Communication services revealed a rather strong, but declining, comparative advantage over the first decade. This may simply be due to more countries with higher average communication service exports being added to the analysis. However, it is noteworthy that communication services in the last year of analysis again revealed a comparative advantage, although a relatively weak one.
The time trends in Figure 2 clearly show that travel service exports maintained a strong comparative advantage throughout the period under analysis. Even during economic sanctions and isolation, South Africa maintained a strong, although declining, RCA. Since 1995, however, the RCA has increased significantly, even as more countries were added to the analysis.
8 Travel service exports from South Africa
Unlike other traded service industries, travel services are defined by the user of the service and not by the type of good or service sold: the consumer (user or traveller) moves to a different country to obtain goods and services.6 Travel services entail all goods and services that are acquired by travellers in an economy during visits of less than one year (except patients and students, who may exceed the one-year limit) (UN, 2002). These services exclude transportation services provided by carriers not resident in the particular economy being visited, as well as international carriage of travellers, both of which are included under passenger services in the transportation service industry (UN, 2002). Also excluded are purchases of goods for resale in the traveller's home economy or elsewhere.
Travel service exports accounted for more than 65 per cent of South Africa's total service trade in 2006, significantly higher than the world average of 38 per cent (UNCTAD 2008). Is there any historical, theoretic or empirical evidence to support this strong comparative advantage in travel service exports?
South Africa has a unique history of travel service exports. The first Europeans settled in the Cape to provide basic necessities to passing Dutch ships sailing between Holland and the East Indies. Apart from stocking these ships with provisions, which included fresh water, food and firewood, the sailors and soldiers aboard these ships also took time to relax and enjoy themselves, and rebuild their strength in time for the second leg of their journey. Cape Town became known as the 'Tavern of the Seas' (Ward, 2007). Nearly every house in Cape Town was used to provide travel service exports - accommodation, food and drinks, and entertainment (Schutte 1980). Injured and sick travellers were also treated by the Dutch East India Company (VOC) hospital. According to Van Duin and Ross (1987), an average of between 9 700 and 11 600 men visited Cape Town every year from 1720 to 1780 on the ships of the VOC, and this had an important impact on the Cape economy (Boshoff & Fourie 2008). Given that the European male population for the entire Cape Colony equalled 2 913 in 1780, and that the entire population, including children and slaves, equalled 22 257, the number of visitors is staggering (Van Duin & Ross, 1987). A survey conducted in 1732 shows that close on 60 per cent of the people employed in Cape Town were involved in the service sector (Schutte, 1980). Not only were travel service exports important for employment creation, but they had significant spin-offs in related industries (such as agriculture and viticulture) during the period of Dutch rule in the Cape (Boshoff & Fourie, 2010).
A lack of sufficient statistical evidence undermines any attempt to discuss the role of travel service exports during much of the nineteenth century. The economy of South Africa changed rapidly after the discovery of diamonds (1867) and gold (1886). The diamond and gold mines brought with them a wave of travellers and immigrants, resulting in fast-growing cities in the interior, most notably Kimberley and Johannesburg. The size and significance of travel exports during the early period of the twentieth century is unclear, although it is expected to be small in comparison with the rich mineral exports.7
Mainly as a result of the improvement in air transport, travel service exports performed well during the 1960s and early 1970s. According to Van Staden (1988), tourists to South Africa grew at an average of 13.2 per cent per annum between 1968 and 1975. However, the period of political unrest also had a strong negative impact on the travel services industry. The 1976 Soweto uprisings caused a significant slowdown, with overseas visitors dropping by 12 per cent (Van Staden, 1988). Since the democratic transition, tourism has increased at exponential rates. While 1 029 094 visitors of ficially arrived in 1990, 8 508 805 did so in 2006 (StatsSA, 2008).
What were the reasons that attracted these visitors? Already in 1982, and before the exponential growth in post-apartheid tourist arrivals, Anton Rupert (1982:7-8) wrote in his Priorities for coexistence: 'What is this diversity which makes South Africa such a sought-after trading partner and an increasingly popular tourist attraction?' He attempts an answer by noting the 'varying climatic conditions which are clearly reflected in a striking variety of flora ... [The] lovely scenery, a glorious sunny climate, unparalleled mineral wealth and an exciting variety of animals... Table Mountain alone boasts a greater number of botanical species than are to be found in the entire British Isles' (Rupert, 1982:7-8). Furthermore, 'the population... is made up of people with completely different backgrounds and origins. Among this heterogeneous mixture of peoples there is a unique diversity of life-styles, cultures, languages, faiths and social systems' (Rupert, 1982:7-8). He summarises: 'We have a diversity of peoples and of natural resources which invite the construction of an economic model appropriate for the world as a whole. In its ethnic, cultural, sociological and economic complexity, South Africa is a microcosm of the world. Diversity... affords wonderful opportunities' (Rupert, 1982:12). Even then Rupert's sentiments were supported by empirical evidence. Of the 5 053 questionnaires completed in a tourism survey in 1978, 77 per cent noted 'Scenery and Landscape' as the most important reason for their visit (Ferrario, 1978). 'Wild life' and 'Natural vegetation' were the second and third most important reasons listed. South Africa's unique natural and cultural attributes are also noted by contemporary travel research (Rogerson, 2006; Rogerson & Kiambo, 2007; Rogerson & Visser, 2004; Saayman & Saayman, 2003; Saayman & Saayman 2008).8
It is not only the natural environment that attracts foreign visitors; on the supply side South Africa's built environment is larger and of better quality than many other developing countries. South Africa has relatively well-developed infrastructure (Bogetic & Fedderke, 2006; Fourie, 2006) and, due to its relative size, can accommodate more foreign visitors than any other African country. It also of fers visitors a wide selection of direct international flights to the country. In 2004, South Africa won the rights to host the 2010 Soccer World Cup, arguably the largest sporting event worldwide. This follows the successful 1995 Rugby World Cup, 1996 African Cup of Nations, 2003 Cricket World Cup and other events, providing further proof that the country can supply quantity and quality accommodation, food and beverage, and entertainment services for higher tourism demand.9
In addition to the physical supply attributes of the country, there are relatively few trade barriers to travel service exports. Netshitomboni and Stern (2002) note that, of all the service categories, travel service exports do not appear to face significant barriers to entry in the four largest service importing countries. The South African government has made several commitments in almost all of the sub-categories in the tourism and travel sector by signing the GATS agreement of the WTO. The only sub-sector where no commitments were made is the sub-sector designated as ' D. Other'.10 This category is reserved for travel and tourism services not included in the other sub-categories. The implication is that, when a service sector is omitted from a schedule, that country has no obligations regarding market access and national treatment in the specific sector. This means South Africa is free to introduce new measures to deny market access to or the operation of services in those omitted sectors.11 Table 4 provides an overview of South Africa's commitments in tourism and travel-related services. The liberalisation of South Africa in the travel service sector is consistent with the international experience (Hoekman, 2006).
Travel service exports from South Africa have received relatively little attention from an international trade perspective.12 Hodge (1997), using 1994 data, finds that travel service exports is the only service sector in which South Africa had a comparative advantage. He identified migrant labour as an important contributor to this service export, especially in the period of international sanctions against South Africa's apartheid regime, and predicted that this would be an important service export category for the future (Hodge, 1997). More recently, Saayman and Saayman (2008) empirically identified the determinants of South African Mode 2 travel exports. In agreement with the international literature, they found that income in the importing country is a main determinant of tourist arrivals (Saayman & Saayman, 2008). Price competitiveness (as measured by the real exchange rate) and transport costs were also found to be significant determinants of tourism. Interestingly, climate (measured as the number of sunny days in Cape Town) is found to be positive and significant, except for visitors from Australia and Latin America. In more recent work, Fourie (2009) and Fourie, Du Toit and Trew (2010) find a positive and significant coefficient on a natural resource variable (measured as the number of UNCTAD Natural World Heritage sites per country) in a cross-country study using the NRCA measure. This lends some credence to the hypothesis that the natural environment contributes to South Africa's comparative advantage. It may further suggest that the South African tourism experience is substitutable with countries sharing similar natural attributes. Stern (2002), however, finds that education and infrastructure are key determinants in travel service exports, while population, gross domestic product, per capita income, technology and land per worker have a negative impact on tourism. This supports his earlier finding that 'wealthy countries are less likely to specialise in travel, sea transport, construction and communication services' (Stern, 2002:8). Yet the results of the comparative analysis above - specifically in the transport, construction and communication services sectors - seem to contradict Stern's findings.
Is there any theoretical support for the hypothesis that South Africa has a comparative advantage in travel service exports? As mentioned before, the Ricardian model of comparative advantage is based on the idea that the opportunity costs of production determine the good that a country should specialise in. Therefore, in a two-country, two-sector model, even though a country might have an absolute advantage at producing both products, Ricardo argues that trade will still benefit both countries as long as the opportunity costs of production are different. A country should therefore specialise in the good with the lowest opportunity cost. The Hecksher-Ohlin theory of comparative advantage, given a number of limiting assumptions (such as zero transport costs), propose that a country will reveal a comparative advantage in those products where it has higher relative factor endowments, usually capital and labour. While the Hecksher-Ohlin theorem finds little empirical support (e.g. the Leontief paradox), an extension of the Hecksher-Ohlin theorem to: 1) include three factor inputs, namely natural resources, capital and labour (where natural resources are broadly defined to include scenery, landscapes and the fauna and flora), and 2) do away with the assumption of zero transport costs, could suggest that South Africa may have a comparative advantage in service exports and, specifically, in travel service exports. Intuitively, because South Africa is a capital-scarce country relative to our main trading partners, labour-intensive products should be exported. Unfortunately, South Africa faces high transport costs for products to international markets (Chasomeris, 2005; Fourie, 2008; Naude & Krugell, 2007), which tend to undermine its comparative advantage, leaving Asian countries to dominate world exports of labour-intensive goods. Given that transport costs have less of an impact on the service industry (transactions are done electronically and people use airports, whereas most goods use seaports13), it follows that South Africa would have a comparative advantage in exporting services, rather than goods. Provided that travel services are the only service sector to benefit from the broadly defined natural resources factor endowment (as found by Fourie et al., 2010), and given the natural resource-intensive factor allocation, travel services are the sector likely to have a comparative advantage vis-a-vis the other service sectors.
South Africa ranks 14th in the travel service export sector (as reported in Table 3). Large countries that share South Africa's strong comparative advantage in travel service exports are the USA, Spain, Turkey, France, Greece, Italy, Australia and Portugal. While this study considers the comparative advantage (the economic interpretation as per Ricardo) of countries and not the competitive advantage (the 'product of fering' as in the marketing literature), these results may indicate which countries compete for the same market share internationally. It is interesting to note that a Global Competitiveness Study by the Monitor Group and South African Tourism in 2004 (DEAT, 2005) highlighted five countries as main competitors: Australia, Thailand, Brazil, Kenya and the USA. Considering Table 3, a number of non-island countries may also vie for 'competitor status': Turkey, Greece, Croatia, Austria, Egypt, Lebanon, Portugal, Morocco, New Zealand and the Dominican Republic.
A further important result is that a large number of these countries share borders with countries that also reveal a strong comparative advantage in travel service exports. While these countries may be 'competing' for the same tourist markets, countries with neighbours that have a high RCA may benefit from agglomeration effects in attracting tourists. A case in point is the high normalised RCA scores calculated for South Africa's neighbours, including Namibia, Botswana and Mozambique. While not revealing a comparative advantage, tourism in both Lesotho and Swaziland has a relatively larger impact on the economy than the world average. In the mould of the new trade theory, this may provide some evidence of agglomeration effects in southern Africa and, more broadly, in sub-Saharan Africa. Transfrontier parks, such as the Great Limpopo Frontier Park that link four protected areas in South Africa, Mozambique and Zimbabwe, may try to capitalise on this.
The South African government has emphasised the role tourism can play in promoting economic growth and development. The tourism sector is one of two priority service sectors in the government's ASGISA programme (Republic of South Africa, 2006).14 The results reported here support this emphasis on the travel service sector.15 South Africa and Mauritius were the only SADC member states actively participating in the successive services rounds to progressively liberalise trade in services. On 29 March 2006, South Africa submitted its conditional initial of fer in the framework of the ongoing negotiations on services under the GATS.16 Although South Africa made several additional commitments, the situation in the tourism and travel sector remained unchanged. This is a clear indication that the sector is already regarded as being substantially liberalised.
Such an open trade policy suggests that the South African government has committed to promoting travel service exports.17 Other industrial policies to support the sector may include both demand- and supply-side measures, including brand marketing, advertising, attending trade fairs and sponsorships, improving air access and transport infrastructure, ensuring a safe travel environment, training travel personnel and improving skills, hosting mega-events and protecting natural and cultural resources, amongst others.
9 Conclusions
This paper ranks the revealed comparative advantage of 10 service export sectors across 147 countries. The rankings help to identify which countries are competitive in the export of certain services. South Africa only revealed a comparative advantage in one service sector in 2005. Travel service exports have yielded persistently strong NRCA scores since 1980, and these are also consistent with the historical, empirical, theoretical and policy evidence.
These comparative results can help countries to identify service sectors in which they have comparative advantage and enable them to plan trade and industrial policy accordingly. Given the importance of service exports for economic growth, such policies can have important implications for a country's growth and development trajectory. The South African government has correctly identified travel service exports - or tourism - as a trade sector with potential.
Acknowledgements
The author would like to thank the following people for valuable contributions and comments: Rachel Jafta, Paul Kruger, Colin McCarthy, Devon Trew, Leon du Toit, Servaas van der Berg, Melissa van Rensburg, Dieter von Fintel and two anonymous referees. All remaining errors are those of the author.
Endnotes
1 This resembles growth in merchandise exports. Between 1980 and 2006, merchandise exports maintained a growth rate of 7.09 per cent annually, while this increased to 10.98 per cent annually between 2000 and 2006.
2 Various alternative measures have been proposed in the literature (Baldwin 1956; Laursen 1998; Vollrath 1991). Until recently, the Balassa index remained the most popular (Cai & Leung 2008).
3 Seyoum (2007) also investigates the RCA of four service industries - business, financial, transport and travel services - for all developing economies. For the years 1998 to 2003, South Africa only reveals a comparative advantage on the three RCA measures of travel service exports, supporting the results of this study.
4 Hodge (1998) provides an overview of South Africa's trade in services during the 1990s.
5 The graphs show revealed symmetric comparative advantage, calculated from the revealed comparative advantage measures (Laursen 1998), where a score > 0 is said to reveal a comparative advantage. This is simply for presentation purposes.
6 Tourism, of ten thought to be a synonym, is not equivalent to travel services. Travel services encompass tourism - which only consists of Mode 2 trade - but also include trade in the other three modes. Tourism (Mode 2) is, however, of ten used as a proxy for travel service exports, and vice versa. For a comprehensive definition of travel services, consult the United Nations Manual on Statistics of International Trade in Services (UN 2002:37-39).
7 There is some evidence to suggest that travel service exports were not completely insignificant. The Kruger National Park, South Africa's largest national park, was founded in 1924 as a means to protect the fauna and flora, especially the larger mammals. This may indicate some recognition among policy makers of the benefits of environmental protection to sustain South Africa's natural advantages.
8 A number of African countries also reveal a strong comparative advantage in travel service exports (see Fourie (2009) and Naude and Saayman (2005)).
9 The DFL Indian Premier League and Champions Trophy was moved to South Africa at short notice in 2009 after security concerns in India and Pakistan. At the opening ceremony of the IPL, the then South African president, Mr Kgalema Motlanthe, summarised the importance of such events: 'It is a vote of confidence in South Africa's ability to host the world's premier sporting events like the IPL, the Confederations Cup and, in 2010 the FIFA World Cup ... It is a vote of confidence in our many institutions to manage various major events...', available at: http://www.polity.org.za/article/sa-motlanthe-remarks-by-the-president-of-south-africa-at-the-opening-ceremony-of-the-dlf-indian-premier-league-18042009-2009-04-18
10 See the W120 classification list for a detailed breakdown of all the core services sectors and sub-categories, available at: http://www.wto.org/english/tratop_e/serv_e/mtn_gns_w_120_e.doc
11 It is generally advisable to exclude the "Other" sub-categories from services liberalisation. Activities that cannot be classified in any of the specific sub-sectors will automatically be categorised under 'Other'. Blanket liberalisation of an 'Other' category might have the implication of unintentionally providing market access or national treatment for a novel services activity.
12 The notion that travel services were not considered an important industry during much of the twentieth century is supported by the fact that references to the travel service industry (or tourism) are completely absent in a number of overview articles and books on twentieth-century South African economy. See, for example, Franzsen and Reynders (1963) and Jones (1991).
13 Chang and Ying (2008) suggest that air transport may be vitally important for African economic growth.
14 The other sector is business process outsourcing (BPO), categorised under communications services.
15 In fact, the two sectors that the South African government prioritised in 2006 are the only two sectors that reported a revealed comparative advantage for that year.
16 The initial conditional of fer is available at: http://www.esf.be/pdfs/gats_initial_offers/South%20Africa%20Initial%20Offer%20-%20April%202006.doc
17 Further support can be found in the new 34-member cabinet announced on 10 May 2009, which includes a ministry dedicated entirely to tourism.
References
ACHTERBERG, R. & HARTZENBERG, T. 2002. Trade in distribution services in South Africa. 2002 Annual TIPS Forum. Muldersdrift: Trade and Industrial Policy Strategies. [ Links ]
BALASSA, B. 1965. Trade liberalization and 'revealed' comparative advantage. The Manchester School of Economic and Social Studies, 32:99-123. [ Links ]
BALDWIN, R. 1956. Patterns of development in newly settled regions. Manchester School of Economic and Social Studies, 24:161-179. [ Links ]
BOGETC, Z. & FEDDERKE, J. 2006. International benchmarking of South Africa's infrastructure performance. Policy Research Working Paper Series 3830. Washington, D.C.: World Bank. [ Links ]
BOSHOFF, W.H. & FOURIE, J. 2008. Explaining the ship traffic fluctuations in the early Cape settlement: 1652-1793. South African Journal of Economic History, 23:1-27. [ Links ]
Boshoff, W. & Fourie, J. 2010. The significance of the Cape trade route to economic activity in the Cape Colony: a medium-term business cycle analysis. European Review of Economic History. Forthcoming. [ Links ]
BUTTERWORTH, B. & MALHERBE, S. 1999. The South African financial sector: background research for the Seattle round. Working Paper. Pretoria: Trade and Industrial Policy Strategies. [ Links ]
CAI, J. & LEUNG, P. 2008. Towards a more general measure of revealed comparative advantage variation. Applied Economics Letters, 15(9)723-726. [ Links ]
CHANG, C.-P. & YING, Y.-H. 2008. The generative power of air freight in the trade openness - economic growth nexus in African countries. South African Journal of Economics, 76(3):493-512. [ Links ]
CHASOMERIS, M. 2005. Assessing South Africa's shipping costs. Journal of Development Perspectives, 1(1):125-141. [ Links ]
D'COSTA, A.P. 2003. Uneven and combined development: understanding India's software exports. World Development, 31(1):211-226. [ Links ]
DEPARTMENT OF ENVIRONMENTAL AFFAIRS AND TOURISM (DEAT). 2005. Global competitiveness report for the tourism industry in South Africa, 2005-2010. [Online] Available at: http://www2.southafrica.net/satourism/research/viewResearchDocument.cfm?Action=Download&FileID=29689&ResearchDocumentID=362 [Accessed2010-02-16].
EDWARDS, L. & LAWRENCE, R.Z. 2006. South African trade policy matters: trade performance & trade policy, CID Working Paper No. 135. [ Links ]
FERRARIO, F.F. 1978. An evaluation of the tourist resources of South Africa. Department of Geography Publication No. 1. Cape Town: University of Cape Town. [ Links ]
FOURIE, J. 2006. Economic infrastructure in South Africa: a review of definitions, theory and empirics. South African Journal of Economics, 74(3):530-556. [ Links ]
FOURIE, J. 2008. A note on infrastructure quality in South Africa. Development Southern Africa, 25(4): 481-494. [ Links ]
FOURIE, J. 2009. Evaluating Africa's comparative advantage in travel service exports. Working Paper 06/2009. Departmental Working Paper Series: Stellenbosch. [ Links ]
FOURIE, J., DU TOIT, L. AND TREW, D. 2010. The sources of comparative advantage in tourism. Working Paper 01/2010. Departmental Working Paper Series: Stellenbosch. [ Links ]
FRANZSEN, D.G. & REYNDERS, H.J.J. (eds.) 1963. Die ekonomiese lewe van Suid-Afrika. Pretoria: J.L. Van Schaik. [ Links ]
GORDON, J.P.F. & GUPTA, P. 2004. Understanding India's services revolution. IMF Working Papers 04/171. Washington D.C.: IMF. [ Links ]
HODGE, J. 1997. Towards an understanding of world and South African trade in services. Cape Town: Trade and Industrial Policy Strategies. [ Links ]
HODGE, J. 1998. Developing a trade and industry policy agenda for service sectors in South Africa. Working Paper. Pretoria: Trade and Industrial Policy Strategies. [ Links ]
HODGE, J. 1999. The state of the telecommunications industry in South Africa and the potential costs/benefits of further liberalisation. Working Paper. Pretoria: Trade and Industrial Policy Strategies. [ Links ]
HOEKMAN, B. 2006. Liberalizing trade in services: a survey. World Bank Policy Research Working Paper No. 4030. Washington D.C.: World Bank. [ Links ]
JONES, S. 1991. Real growth in the South African economy since 1961 - Part II: The tertiary sector. South African Journal of Economic History, 6(1):34-60. [ Links ]
LANGHAMMER, R.J. 2002. Developing countries as exporters of services: what trade statistics suggest. Journal of Economic Integration, 17(2): 297-310. [ Links ]
LAURSEN, K. 1998. Revealed comparative advantage and the alternatives as measures of international specialisation. DRUID Working Paper No. 98-30. Copenhagen: Danish Research Unit for Industrial Dynamics. [ Links ]
MATTOO, A. & HOEKMAN, B. 2008. Services trade and growth. Policy Research Working Paper Series No. 4461. Washington D.C.: World Bank. [ Links ]
NAUDE, W. 1999. Trade in transport services: South Africa and the General Agreement on Trade in Services. Pretoria: Trade and Industrial Policy Strategies. [ Links ]
Naude, W.A. & Krugell, W.F. 2007. Investigating geography and institutions as determinants of foreign direct investment in Africa using panel data. Applied Economics, 39(10):1223-1233. [ Links ]
NAUDE, W.A. & SAAYMAN, A. 2005. Determinants of tourist arrivals in Africa: a panel data regression analysis. Tourism Economics, 11(3):365-391. [ Links ]
NETSHITOMBONI, N. & STERN, M. 2002. Identifying South Africa's interests in WTO services negotiations. 2002 Annual TIPS Forum. Muldersdrift: Trade and Industrial Policy Strategies. [ Links ]
REPUBLIC OF SOUTH AFRICA. 2006. Background document: a catalyst for accelerated and shared growth - South Africa (ASGISA). Availble at: http://www.info.gov.za/speeches/briefings/asgibackground.pdf. [ Links ]
ROGERSON, C. 2006. Pro-poor local economic development in South Africa: the role of pro-poor tourism. Local Environment, 11:37-60. [ Links ]
ROGERSON, C. & KIAMBO, W. 2007. The growth and promotion of regional tourism in the developing world: the South African experience. Development Southern Africa, 24(3):505-521. [ Links ]
ROGERSON, C. & VISSER, C. (eds.) 2004. Tourism and development issues in contemporary South Africa. Pretoria: Africa Institute of South Africa. [ Links ]
RUPERT, A. 1982. Priorities for coexistence. Cape Town: Tafelberg. [ Links ]
Saayman, M. & Saayman, A. 2003. An economic analysis of international and African tourism markets of South Africa. African Insight, 33(1):93-98. [ Links ]
SAAYMAN, A. & SAAYMAN, M. 2008. Determinants of inbound tourism to South Africa. Tourism Economics, 14(1):81-96. [ Links ]
SARB. 2008. QuarterlyBulletin. Pretoria: South African Reserve Bank. [ Links ]
SCHUTTE, G. 1980. Company and colonists at the Cape, in R. Elphick & H. Giliomee (eds.) The shaping of South African society, 1652-1820. Cape Town: Longman Penguin Southern Africa. [ Links ]
SEYOUM, B. 2007. Revealed comparative advantage and competitiveness in services. Journal of Economic Studies, 33(5):376-388. [ Links ]
STATSSA. 2008. Tourism 2007. Report No. 03-51-02 (2007). Pretoria: Statistics South Africa. [ Links ]
STERN, M. 2002. Predicting South African trade in services. 2002 Annual TIPS Forum. Muldersdrift: Trade and Industrial Policy Strategies. [ Links ]
TELJEUR, E. & STERN, M. 2002. Understanding the South African construction services industry: towards a GATS negotiating strategy. 2002 Annual TIPS Forum. Muldersdrift: Trade and Industrial Policy Strategies. [ Links ]
THARAKAN, P., VAN BEVEREN, I. & VAN OURTI, T. 2005. The determinants of India's software exports and goods exports. The Review of Economics and Statistics, 87(4):776-780. [ Links ]
UN. 2002. Manual on statistics of international trade in services. Series M No. 86. Geneva: United Nations. [ Links ]
UNCTAD 2008. Handbook of statistics 2007. Geneva: UNCTAD. [ Links ]
VAN DUN, P. & ROSS, R. 1987. The economy of the Cape Colony in the 18th century. Leiden: Centre for the Study of European Expansion. [ Links ]
VAN STADEN, A.M. 1988. Past patterns - possible future developments of tourism in South Africa. Stellenbosch: Stellenbosch University. Master of Business Administration. [ Links ]
VOLLRATH, T. 1991. A theoretical evaluation of alternative trade intensity measures of revealed comparative advantage. Weltwirtschafliches Archiv, 127:265-280. [ Links ]
WARD, K.R. 2007. 'Tavern of the Seas?' The Cape of Good Hope as an oceanic crossroads during the seventeenth and eighteenth centuries, in Bentley, J., Wigen, K. & Bridenthal, R. (eds.) Seascapes, littoral cultures, and trans-oceanic exchanges. Honolulu: University of Hawai'i Press. [ Links ]
WTO. 2006. Measuring trade in services. Geneva: WTO. [ Links ]
YU, R., CAI, J. & LEUNG, P. 2009. The normalized revealed comparative advantage index. The Annals of Regional Science, 43(1 ):267-282. [ Links ]
Accepted February 2010

