


Servicios Personalizados
Articulo
 Inglés (pdf)
 Articulo en XML
 Referencias del artículo
Indicadores

Links relacionados
-
 Citado por Google
 -
 Similares en Google
Compartir

 Permalink
South African Journal of Economic and Management Sciences
versión On-line ISSN 2222-3436
versión impresa ISSN 1015-8812
S. Afr. j. econ. manag. sci. vol.14 no.2 Pretoria ene. 2011
ARTICLES
Factors threatening the survival of independent financial advisers in their organisational life cycle: an exploratory study
Estelle van TonderI; Lene EhlersII
IDepartment of Marketing Management, University of Johannesburg
IIDepartment of Marketing and Communications Management, University of Pretoria
ABSTRACT
This study investigates various threats to the survival of independent financial advisers in their organisational life cycle. Telephone interviews were conducted to gain more insight into the demographic data of the respodents and to attempt to group them into life-cycle stages. Personal interviews were conducted to investigate the respondents' problems. The contribution of this study is twofold. First, general life-cycle stages applicable to the businesses of independent financial advisers were determined. Secondly, the study identified the important problems as well as those that ought to be considered in the advisers' businesses. The findings could be of assistance to independent financial advisers in analysing both their current business position and their planning for future requirements as the business develops from one stage to the next.
Key words: organisational life cycle, independent financial advisers, small business problems, small business survival
JEL L25, 26
1 Introduction
As businesses progress through the various stages of organisational growth, various problems have to be solved (Hanks, Watson, Jansen & Chandler, 1993). The estimated 55 per cent failure rate for small businesses in their first five years and 81 per cent within ten years indicates that, if they do not address these problems, find possible solutions and implement the necessary strategies to address the factors hindering their growth, they will not survive (Dodge & Robbins, 1992). According to the Global Entrepreneurship Monitor report (Bosma, Acs, Autio, Coduras & Levie, 2008:20), the prevalence rate for new businesses in South Africa is only 2,1 per cent, while for established owner-manager businesses it is a mere 2,3 per cent.
While many factors could contribute to the downfall of a small business, Moores and Mula (1998) are of the opinion that one of the major reasons for business failure is the lack of managerial experience and capabilities. More specifically, the small business sector shows weak innovation and absence of financial acumen, marketing, entrepreneurial flair, practical knowledge and human resource management. These pitfalls mean that many small businesses fail to reach their full potential and to grow (Sha, 2006).
Independent financial advisers form part of the small business population in South Africa. They are individuals or businesses that sell financial products. They normally operate small businesses and are expected to give "best advice" when recommending products to clients (UK Association of Independent Financial Advisers, 2001; Wright, 2008).
These advisers are further subject to the regulations of the Financial Advisory and Intermediary Services Act (2002), but would not be able to survive and grow their business sales should they focus predominantly on compliance-related activities (Swanepoel, 2004:25-26).
The organisational life-cycle concept presents a viable tool that could be of assistance to independent financial advisers experiencing a variety of business problems. Kiriri (2004) indicates that the organisational life-cycle model can be used to analyse a business's current position and to plan what will be required as the business develops from one stage to the next. The model could be a tool for long-term planning, where management with an understanding of the issues, current and future challenges and problems at each stage would review the plans and strategies of the business to prepare for the future. According to Hill, Nancarrow and Wright (2002:363), organisational life-cycle models provide a framework for gaining more insight into the various options available to small business owners at a given time. An understanding of the life cycle of an organisation and the management imperatives associated with it could help small business owners through the uncharted course of firm growth (Hanks et al., 1993; Sha, 2006). A diagnostic growth model could help small business owners to learn from the survival and growth of other businesses with the same business features operating in similar industrial climates (Poutziouris, Binks & Bruce, 1999:139).
Accordingly, if independent financial advisers are to survive and grow, they need more guidance on the various threats to their survival and growth in their organisational life cycle. This would include various strategies that could be implemented in managing problems proactively and anticipating future challenges. To date, no formal research study in South Africa has proposed such guidelines.
In addressing the problem, this study focuses on the first requirement, which is to investigate different factors that could threaten the survival of independent financial advisers in their organisational life cycle.
2 Literature review
To accomplish the aim of this study, a general organisational life-cycle model for all businesses was first identified in the literature review. The empirical section of this study then aimed to verify whether these general life-cycle stages are applicable to the businesses of independent financial advisers or whether, alternatively, they progressed through another set of life-cycle stages. The second section of the literature review focused on the various problems that independent financial advisers could possibly experience in their organiational life cycle. These problems were investigated further in the empirical section of this study.
2.1 The organisational life-cycle concept
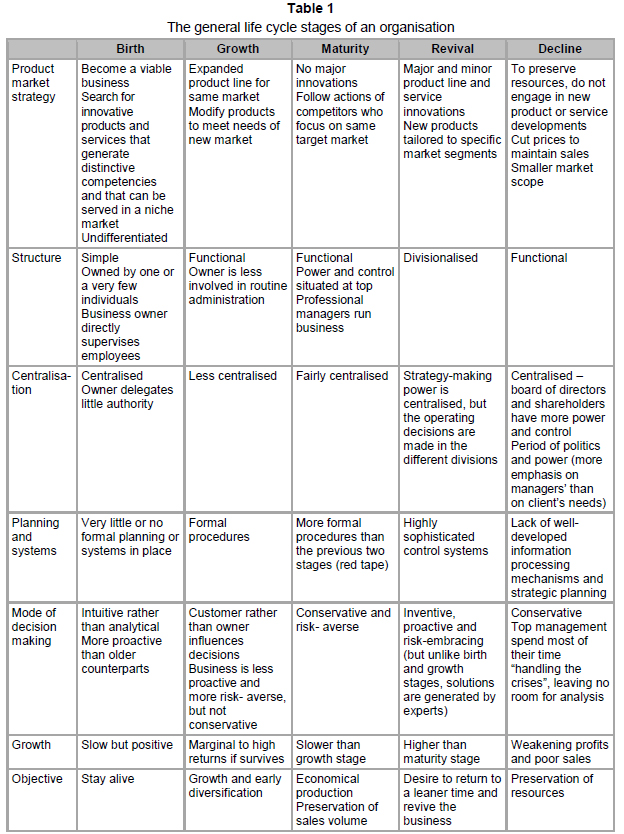
In the search for a justifiable general life-cycle model that could be representative of the businesses of independent financial advisers, it was decided to compare the organisational life-cycle models proposed by Miller & Friesen (1984); Smith, Mitchell & Summer (1985); Lester & Parnell (2008); Ferreira (2000) and Churchill & Lewis (1983). The older models were selected first because their contribution to the literature theory is still acknowledged today (Hill et al., 2002:362-363; Lester & Parnell, 2008:540-553; Lester, Parnell & Carraher, 2003:339-353) and secondly because the researcher wanted to ensure that there was a substantial review of all the major contributions to the organisational life-cycle concept. The models proposed by Miller and Friesen and by Smith et al. are based on previous organisational life-cycle models, while those proposed by Lester and Parnell and by Ferreira represent more recent research studies. Finally, in addition to representing small, large and general organisational life-cycle models, all five models have been empirically tested.
The results of the investigation are depicted in Table 1 below. It appears that businesses can progress through five general life-cycle stages:
The next question requiring further investigation is whether businesses relentlessly progress in a sequential manner through these five general life-cycle stages.
The sequential nature of organisational life cycle stages
According to Quinn and Cameron (1983:33), organisational life-cycle stages are "...sequential in nature, occur as a hierarchical progression that is not easily reversed, and involve a broad range of organizational activities and structures". Other researchers argue that the progression of a business from one life-cycle stage to another is a matter of strategic choice, expertise and resources. Not all small businesses want (Scott & Bruce, 1987:45) or have the resources and expertise to grow their businesses (McMahon, 1998; Phelps, Adams & Bessant, 2007).
It is, however, in the results of the longitudinal research study conducted by Miller and Friesen (1984:1175-1177) that more clarity about this matter can be gained. Miller and Friesen's study revealed that some businesses did display a long-term evolutionary pattern that was roughly in line with the life-cycle literature. These businesses progressed from birth, to growth, to maturity and then to revival in a sequential manner. However, there were many exceptions. Some of the businesses in the revival stage reverted to the maturity phase. (An unsuccessful attempt to diversify the business was given as a possible reason.) Further, there were businesses in the decline stage that progressed to the maturity and revival stages. Miller and Friesen concluded that "...while the stages of the life cycle are internally coherent and very different from one another they are by no means connected to each other in any deterministic sequence". The maturity stage could, for example, be followed by the decline, revival or even growth stage; the growth stage could be followed by the maturity or the decline stage; the revival stage may be before or after the decline stage, and so on. There is no common corporate life cycle, but there are indeed life-cycle stages common to every business which are different from one another.
It therefore appears that, while there are general life-cycle stages common to businesses, organisations do not progress relentlessly through them in a sequential manner. The development of the business can assume any form. According to the contributions by Phelps et al. (2007); McMahon (1998); Siu and Kirby (1998:49-50); Scott and Bruce (1987:45); Mount, Zinger and Forsyth (1993:111) and Churchill and Lewis (1983), it seems that the business's resources, as well as its expertise and strategic choices, play an important role in determining, at any point, whether it will progress to the next stage, remain at the current stage or deteriorate and perhaps die.
Finally, it appears that businesses that stop growing at a specific stage seem to keep the structure of that particular stage. According to Miller and Friesen (1984:1177), "...the structures of no-growth firms may become arrested at the life-cycle stage in which strategy and size become fixed. Firms may then be similar to others within their stage but fail to progress to a different phase of the life cycle".
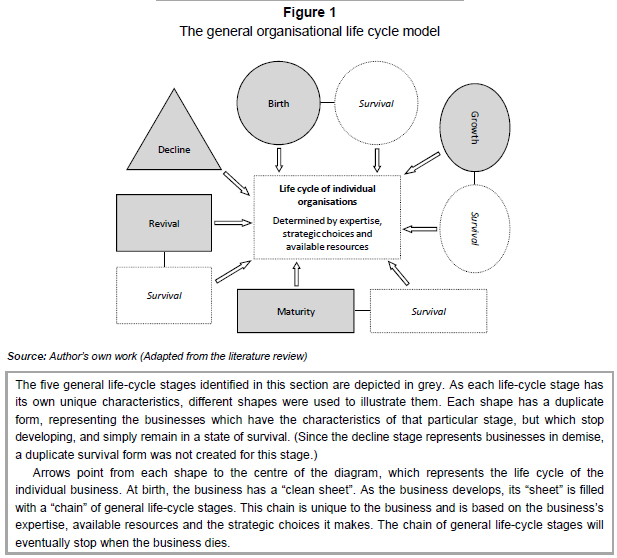
Based on these findings, it is possible to provide a graphical illustration of the general organisational life-cycle model:
Following the literature investigation, the empirical section of this study aimed to verify whether these general life-cycle stages were applicable to the businesses of independent financial advisers. However, because a more detailed investigation process is required to obtain an adequate understanding of the decline stage (Mellahi & Wilkinson, 2004), this stage was excluded from the investigation.
2.2 Business obstacles
According to Timmons and Spinelli (2007: 260-261, 536-538, 618-621), certain business obstacles can be specifically associated with the different life-cycle stages of a business. Lack of empirical evidence rendered the organisational life-cycle model proposed by Timmons and Spinelli unsuitable for consideration in the investigation of the general organisational life-cycle stages. However, based on the findings of the previous section, it seems that the business context of four of the life-cycle stages proposed by Timmons and Spinelli correlates with the business context of the birth, growth, maturity and revival generallife-cycle stages. Table 2 below provides a summary of this correlation as well as a list of the problems Timmons and Spinelli believe can occur in each particular stage:
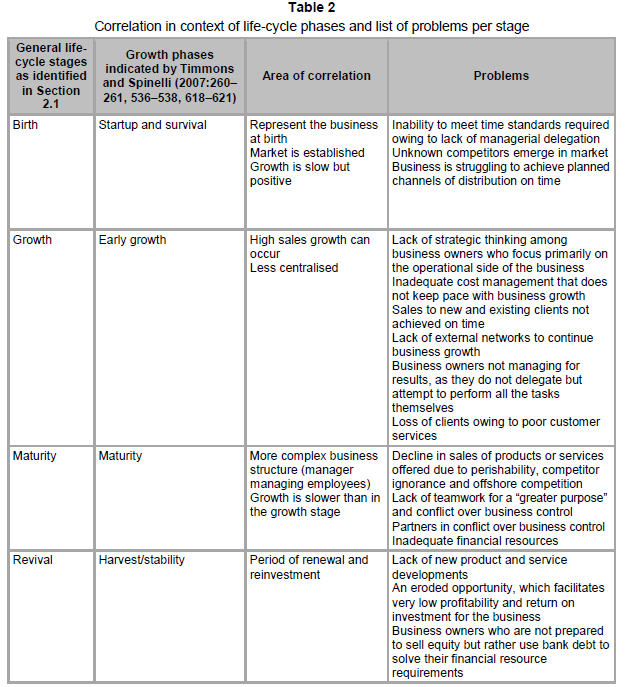
Based on the similarities in Table 2, it appears that the problems depicted in Timmons and Spinelli's life-cycle stages could also be present in the general life-cycle stages proposed in Figure 1: birth, growth, maturity and revival. Subsequent to this, there is the possibility that independent financial adviser businesses could experience these problems in their life-cycle stages.
Timmons and Spinelli (2007:536) further postulate that there is a range of problems on which a business may have to concentrate. The problems they mention are particularly important and if they are not overcome they could imperil the business.
The researcher therefore investigated mainly the problems pointed out by Timmons and Spinelli (2007:260-261, 536-538) as far as they concerned the independent financial advisers in this study.
3 Research objectives and propositions
Following the literature review, two research objectives could be stated to investigate the various factors that could threaten the survival of independent financial advisers in their organisational life cycle:
• To obtain clarity on the organisational life-cycle phases of independent financial advisers;
• To determine the problems actually posing a threat to the business survival of independent financial advisers in their organisational life cycle;
The following research propositions were tested to assist in addressing the objectives:
• Independent financial advisers do progress through the birth, growth, maturity and revival life-cycle stages identified in the literature review;
• Independent financial advisers experience the potential problems (factors) in the life-cycle stages discussed in the literature review.
4 Methodology
The field study was conducted in two phases.
First, telephone interviews were conducted to determine whether the respondents qualified for participation in this study and to increase insight into the demographic profiles of the advisers and subsequently their life-cycle stages.
The population of this study was comprised of independent financial advisers in Johannesburg operating small businesses advising on and selling financial products during the period 1 August 2006 to 31 July 2007. Since it was not possible to obtain an exact list of the population, the researcher used the names and contact details provided by the Financial Services Board of the 1 024 registered independent financial advisers in Johannesburg who had taken on the business form of a natural person. The first three questions of the telephone interview then verified whether the respondent formed part of the population of the study and therefore qualified for participation in the investigation.
The non-probability convenience sampling technique was used for the telephone interviews.
This study was exploratory in nature and no scientific representative conclusions were made. The limitations of the convenience sampling method, as highlighted by Stevens, Wrenn, Sherwood and Ruddick (2006:188), would therefore not affect the research objectives of this study. Further, the data were collected by a professional interviewer who made use of a structured questionnaire. The respondents all had to answer the same series of questions. Only every second person on the list provided by the Financial Services Board was contacted for a telephone interview. The sample size of 512 respondents (1 024/2) was affordable and was in accordance with the guidelines presented by Stevens et al. (2006:191-192). A total of 133 respondents were successfully interviewed by telephone (response rate 27.14 per cent).
In the second phase of the field study, information on the problems experienced by the respondents was collected by means of personal interviews.
Only independent financial advisers who indicated in the telephone interviews that they had experienced commission growth in their businesses (for the period 1 August 2006 to 31 July 2007) were interviewed in the second phase of the field study. The rationale for this approach was that, according to Mellahi and Wilkinson (2004), a detailed investigation would be needed to gain an adequate understanding of the behaviour of businesses in the decline stage. However, the main intention of this study was to conduct a small-scale exploratory investigation into the problems experienced by financial advisers. A thorough investigation into the actions of businesses in the decline stage would have been costly and fell outside the ambit of this study.
In phase one, a total of 76 respondents indicated that they had experienced commission growth in their businesses. All 76 respondents were contacted for a personal interview. However, only 50 of these respondents were willing to discuss the obstacles they had experienced relating to their businesses. Forty-four of the interviews were conducted in person. The other six respondents had extremely busy schedules and were willing only to be interviewed by telephone. These six respondents were asked the same questions posed in the personal interviews and great care was taken to ensure that the respondents understood the questions properly and that the answers were probed in full. Based on the number of financial advisers contacted and the number of interviews completed, the response rate for the second phase of the field study was 65,79 per cent.
Although only 50 respondents participated in the second phase of the field study, the use of this relatively small sample size for analysis can be justified:
• Stevens et al. (2006:190-191) point out that, in practice, numerous research institutions use a typical sample size of between 50 and 200 respondents when conducting research among region-specific business respondents, while between null and four subgroups are involved. The sample of 50 interviews in the second phase of the field study matches the lower end of this range.
• Moreover, this study was also exploratory in nature and involved mainly the investigation of business obstacles experienced by independent financial advisers. The study did not propose any scientifically representative conclusions.
The fieldwork was conducted in Johannesburg from September to November 2007. The validity of the study was ensured by pre-testing the telephonic and personal interview questionnaires among a small number of independent financial advisers whose businesses had characteristics similar to those of the respondents in this study.
5 Results
5.1 Telephone interviews
The telephone interview results showed that the oldest business examined in this study was more than four decades old (44 years) while the youngest was less than one year old. Half of the respondents' businesses were between seven and 19 years of age. Of the 133 respondents who participated in the telephone interviews, 89, 47 per cent had no employee growth in their businesses (for the period 1 August 2006 to 31 July 2007). The respondents' businesses had either one or two organisational levels and carried out a maximum of three specialised functions.
Although all the authors discussed in the literature review identified essentially the same organisational life-cycle stages, they followed different research approaches. Ferreira's (2000) approach is particularly worth noting. He collected the demographic data of the respondents and then grouped them according to similarities displayed. Hanks et al. (1993) also made use of this approach in their investigation of the small business life cycle. They believe that, "by employing this methodology to multiple samples, patterns of life-cycle stages can be systematically explored". Accordingly, this study followed Ferreira's research approach and applied Ward's minimum variance clustering method (1963) to the demographic data of the respondents who had experienced commission growth in an attempt to group them into different life-cycle stages.
It should also be noted that in the previous section it was mentioned that a total of 76 respondents earned more commission over the period 1 August 2006 to 31 July 2007 than in the previous year. However, cluster analysis could be conducted only on the results obtained from the 75 respondents who were willing to disclose their actual achieved percentage commission growth.
The four criteria were measured, using Ferreira's methodology:
The business age was determined by subtracting the year in which the business was founded from 2007 (the year in which fieldwork was conducted). The reporting structures of the respondents' businesses were studied to determine the number of organisational levels. The duties of each employee were examined to assess the number of specialised functions. For example, if the employee performed only an administrative role, it was regarded as a specialised function.
Ferreira measured the sales growth of the small businesses. Independent financial advisers earn their income on the sale of financial products in the form of commission. However, both the sale of a manufactured product and the commission earned from a policy can be viewed as a business owner's source of income, from which overheads must be paid and profit taken. Consequently, Ferreira's sales criterion is measured as commission growth (percentage).
Although the initial intention was to incorporate the employee growth of the respondents into the cluster analysis (the fifth criterion considered by Ferreira), more than 89 per cent of the respondents who participated in the telephone interviews had not experienced any employee growth. These data were therefore initially excluded from the analysis to determine whether mutually exclusive clusters could be identified. Employee growth was determined as follows:

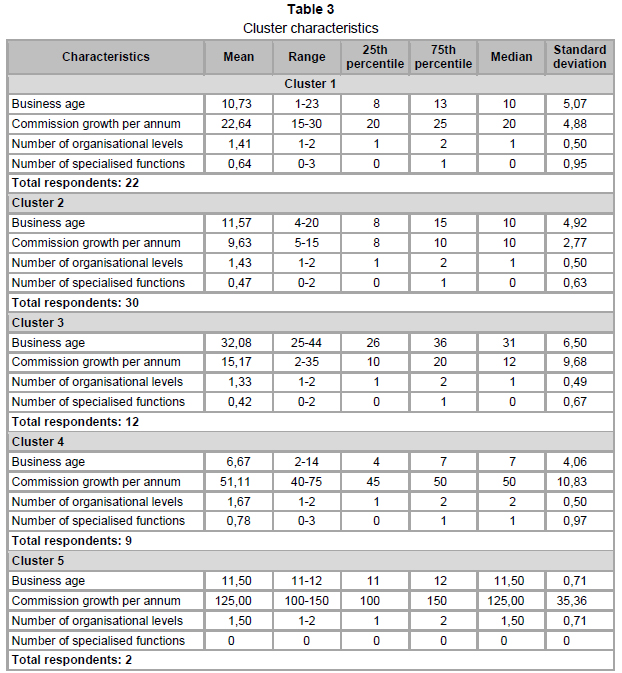
The following insights can be gained from the results depicted in Table 3:
• Business age
The average business age of cluster 1 is 10,73 years. This is close to the average business age of cluster 2 (11,57 years) and cluster 5 (11,50 years). Cluster 1 has a standard deviation of 5,07 years and cluster 2 has a standard deviation of 4,92 years. The median value for both clusters 1 and 2 is 10 years, while for cluster 5 it is 11,50 years.
The business age range for clusters 1 and 2 is very similar, i.e. 1-23 years for cluster 1 and 4-20 years for cluster 2. The business age of 50 per cent of the respondents in cluster 1 is between eight and 13 years and that of 50 per cent of the respondents in cluster 2 is between eight and 15 years. Cluster 2 has the highest number of respondents (30 respondents).
Businesses in cluster 3 are older than those in the other clusters. The minimum business age in cluster 3 is 25 years and the maximum .is 44 years. The median value is 31 years and the business age of 50 per cent of the respondents in cluster 3 is between 26 and 36 years. Cluster 3 has the highest average business age (32,08 years) and the standard deviation is 6,50 years.
The business age range of cluster 4 is from two to 14 years. This range overlaps that of clusters 1 and 2. The median value is seven years and the business age of 50 per cent of the respondents in cluster 4 is between four and seven years. Cluster 4 has the lowest average business age (6,67 years) and the standard deviation is 4,06 years.
Cluster 5 has the smallest business age range (11-12 years), explaining why the business age of 50 per cent of the respondents in cluster 5 is between 11 and 12 years and the standard deviation is 0,71 years. However, only two respondents were grouped into cluster 5.
The Kruskal-Wallis one-way analysis of variance test statistic (for age) was determined as 35,14 and the associated p-value as 0,0000 (the actual p-value calculated was very small and was then rounded off by the SAS software package used to four zeros after the decimal). Although the above discussion highlighted a few similarities, the results of the p-test suggest that there is a significant difference between the mean business ages of the five clusters.
• Commission growth
Cluster 2 has the lowest average commission growth (9,63 per cent) and the lowest standard deviation (2,77 per cent). The commission range is 5-15 per cent and 50 per cent of the respondents in cluster 2 experienced between 8 per cent and 10 per cent commission growth. The average commission growth for cluster 1, which has almost the same business age range as cluster 2, is 22,64 per cent and the standard deviation is 4,88 per cent. The commission range is 15-30 per cent and 50 per cent of the respondents in cluster 1 experienced between 20 per cent and 25 per cent commission growth. The median commission growth value for cluster 1 is 20 per cent, while that for cluster 2 is 10 per cent.
The average commission growth for cluster 3 is 15,17 per cent and the standard deviation is 9,68 per cent. The commission range for cluster 3 is from 2 per cent to 35 per cent. This range overlaps with that of clusters 1 and 2. The median commission growth value for cluster 3 is 12 per cent and is close to the median commission value of cluster 2. However, 50 per cent of the respondents in cluster 3 experienced commission growth of between 10 per cent and 20 per cent.
The average commission growth for cluster 4, which overlaps in business age range with clusters 1 and 2, is 51,11 per cent. This is more than double the commission growth indicated for cluster 1 and more than five times the commission growth indicated for cluster 2. Cluster 4 also has a larger standard deviation than clusters 1 and 2 (10,83 per cent). The commission growth range for cluster 4 is 40-75 per cent and 50 per cent of the respondents in cluster 4 experienced commission growth between 45 and 50 per cent. The median commission growth value is 50 per cent.
Cluster 5 has the greatest average commission growth (125 per cent) as well as the largest standard deviation (35,36 per cent). However, only two respondents were grouped into cluster 5. The commission growth of the first respondent was 100 per cent and that of the second respondent was 150 per cent, explaining the commission growth range of 100 per cent to 150 per cent. The median value was calculated to be 125 per cent.
The Kruskal-Wallis one-way analysis of variance test statistic (for commission growth) was determined to be 55,56 and the associated p-value as 0,0000 (actual small p-value was also rounded off by the computer package to fourzeros after the decimal). Despite the fact that the discussion above highlighted a few similarities, the results of the p-test suggest that there is a significant difference between the mean commission growth of the clusters identified.
• Number of organisational levels
All the respondents who experienced commission growth had either one or two organisational levels. This explains why the organisational level range for each cluster is one to two organisational levels. The 25th percentile is one organisational level and the 75th percentile is two organisational levels.
The median value for clusters 1, 2 and 3 is 1 organisational level. Cluster 1 has an average of 1,41 organisational levels. This is close to the mean number of organisational levels for cluster 2 (1,43). Clusters 1 and 2 have the same standard deviation value (0,50 organisational levels). The standard deviation for cluster 3 (0,49 organisational levels) is close to the standard deviation of clusters 1 and 2. Cluster 3 has an average of 1,33 organisational levels.
Cluster 4 has the highest average number of organisational levels (1,67 organisational levels). Cluster 4 has the same standard deviation value as clusters 1 and 2 (0,50 organisational levels). The median value for cluster 4 is two organisational levels. Cluster 5 has the second-highest average number of organisational levels (1,50 organisational levels). Cluster 5 has the highest standard deviation (0,71 organisational levels). The median value for cluster 5 is 1,50 organisational levels.
The Kruskal-Wallis one-way analysis of variance test statistic (for organisational levels) was calculated as 2,52 and the associated p-value as 0,6417. Consistent with the above discussion, these findings also indicate that there is no significant difference between the mean number of organisational levels among the different clusters.
• Number of specialised functions
The average number of specialised functions for cluster 1 is 0,64 (standard deviation 0,95 functions). This is slightly lower than the average number of specialised functions identified for cluster 4 (0,78 functions with a standard deviation of 0,97 functions). The median number of specialised functions for cluster 1 is zero functions and, for cluster 4, one function. The specialised functions range for both clusters 1 and 4 is 0-3 functions. The mean number of specialised functions for cluster 2 is 0,47 functions (standard deviation is 0,63 functions). This is close to the mean number of specialised functions for cluster 3 (0,42 functions with a standard deviation of 0,67 functions). Clusters 2 and 3 have the same median number of specialised functions (0 functions) and also the same specialised functions range (0-2 functions).
Fifty per cent of the respondents in clusters 1, 2, 3 and 4 have between 0 and one specialised function.
The average number of specialised functions for cluster 5 is 0 functions. No additional descriptive statistics could thus be calculated for cluster 5.
The findings of the Kruskal-Wallis one-way analysis of variance test (for specialised functions) suggest that there is no significant difference among the mean number of specialised functions of the different clusters. The test statistic was calculated as 2,40 and the associated p-value as 0,6627.
Based on these findings, it appears that it was not possible to identify a series of mutually exclusive clusters using Ward's minimum variance method. Although the Kruskal-Wallis one-way analysis of variance test for age and commission growth did indicate that there is a significant difference between the mean business age and mean commission growth of the five proposed clusters, there is also a high number of similarities between the groups that cannot be ignored. This study can therefore not accept the five proposed clusters established with Ward's minimum variance test as a valid representation of the individual business phases of the respondents who experienced commission growth.
Given the number of similarities between the different clusters, it further might appear that the independent financial advisers who experienced commission growth could be grouped into a single organisational life-cycle stage.
Each of the five proposed clusters represents a segment of the commission growth experienced by the respondents, together constituting the entire commission growth range (2-150 per cent) and business age range (1-44 years) of the respondents who experienced commission growth. Within each cluster, the range of organisational levels is 1-2 levels and the range of specialised functions is 0, 0-2 functions or 0-3 functions. Consequently, advisers who experienced a low amount of commission growth and/or who were relatively young had about the same number of organisational levels and specialised functions as advisers who experienced more commission growth and/or who were relatively older. Statistical tests also indicate that there is no connection between the number of organisational levels present in the respondents' businesses and the level of commission growth they experienced (chi-square value is 3,5807 and the associated p-value is 0,0585). There is also no connection between the number of specialised functions and the level of commission growth experienced (Fisher's exact test shows a p-value of 0,1295).
It can then be argued that the respondents who experienced no commission growth were in the same business phase as the respondents who did experience commission growth. The advisers who experienced no commission growth also had either one or two organisational levels and a maximum of three specialised functions, and did not really show employee growth. There is also no significant difference between the mean business age of the respondents who experienced commission growth and those who did not. (The t-test value is 0,35 and the associated p-value is 0,7278.)
It is tempting to claim that all the independent financial advisers who participated in this study had the features of the birth general life-cycle stage. Similar to the structural characteristics of this stage, the independent financial advisers also had a simple organisational structure and directly supervised their employees.
However, these viewpoints might not be completely valid, since there is a possibility that independent financial advisers in general have a simpler organisational structure and could still be grouped into the other general organisational life-cycle stages, based on the remaining six factors listed in Table 1. Consequently, even though the respondents investigated in this study have a number of structural characteristics in common, it will not be claimed that their businesses are all still in the same organisational life-cycle stage.
5.2 Personal interviews
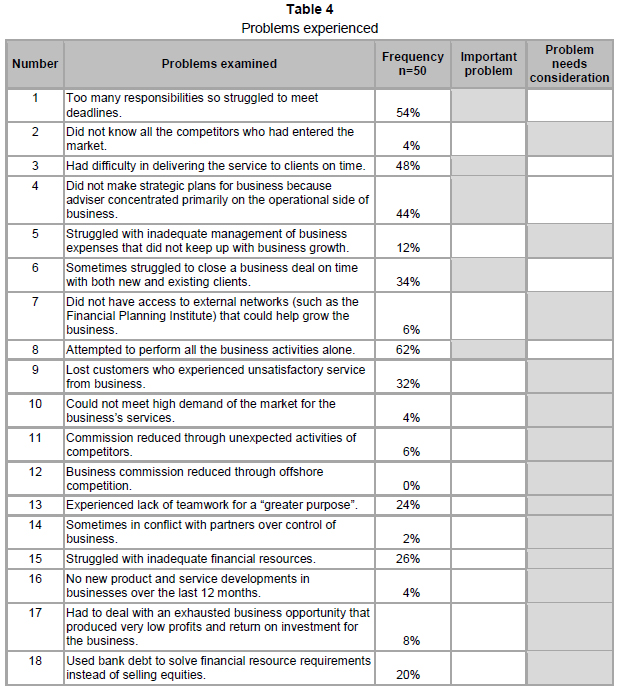
Given the fact that it was not possible to cluster the respondents who experienced commission growth into life-cycle stages, the data obtained from the field could not be grouped and are presented in Table 4 mainly as problems experienced by the advisers in their businesses.
The problems investigated were divided into groups according to the number of responses obtained. If the obstacle was experienced by less than one-third of the respondents (i.e. 0 per cent-33,33 per cent of the advisers), it was regarded as a problem that needed consideration only. Similarly, obstacles experienced by more than one-third but less than two-thirds of the respondents (i.e. 33,34 per cent-66,67 per cent of the advisers) were regarded as important problems, while obstacles experienced by more than two-thirds of the respondents (i.e. 66,68 per cent-100 per cent of the advisers) were regarded as critical.
Based on this approach, five of the 18 problems investigated could be classified as important, and the remaining 13 could be regarded as problems that would need consideration only. This study was therefore not able to identify any critical problems.
6 Discussion
6.1 Organisational life-cycle stages of respondents
In Section 5.1 it became evident that Ferreira's variables were not sufficient to help classify the respondents into life-cycle stages.
Ferreira investigated small businesses whose mean employment in the birth stage was recorded as 16,33 employees, in the expansion stage as 27,62 employees, in the maturity stage as 159,6 employees and in the diversification stage as 30,6 employees. Most of the respondents who participated in the telephone interviews (62,41 per cent) had no employees in their businesses from 1 August 2006 to 31 July 2007 (the year in which the respondents' businesses were evaluated). The average number of organisational levels in the businesses investigated by Ferreira ranged from 2,33 levels at the birth stage, 4 levels at the expansion stage, 4,27 levels at the maturity stage and 4,71 levels at the diversification stage. This study's respondents had either one or two organisational levels. The majority of the respondents who experienced commission growth (55,26 per cent) had only one organisational level. The number of specialised functions in the businesses investigated by Ferreira ranged from 2,04 functions (birth stage), 4,69 functions (expansion stage), 6 functions (maturity stage) and 8,8 functions (diversification stage). The independent financial advisers had a maximum of three specialised functions. More than half of the respondents who experienced commission growth (59,21 per cent) had no specialised function.
Ferreira therefore seems to have examined small businesses operating on a larger scale (with more employees, organisational levels and specialised functions than the respondents of this study. Consequently, and because Ferreira's data had a broader range, it was easier for him to make use of the different variables and group the respondents into a number of life-cycle stages. By contrast, the independent financial advisers had little variability in terms of the number of organisational levels, specialised functions and employees in their businesses, which made it very difficult to group them according to Ferreira's variables.
Although it appears that all the advisers interviewed had a simple organisational structure, this study cannot claim that they were all in the same organisational life-cycle stage. It was not possible to provide empirical evidence that the general life-cycle stages depicted in Figure 1 apply to the businesses of independent financial advisers. These stages, however, are based on the common life-cycle patterns displayed by small and larger businesses in different time periods, regions and industries. Table 1 also lists a number of characteristics that can be used to describe these general life-cycle stages (of which the structure of the business formed only one component). This study will therefore conclude instead that the general life-cycle stages should, in fact, also be associated with the businesses of independent financial advisers, but with one exception: it seems that independent financial advisers have a more simple organisational structure which they do not really attempt to develop further.
Research proposition 1 should therefore be partially accepted.
The implication is that a more appropriate set of variables is needed to assist in grouping independent financial advisers into the different general life-cycle stages. Independent financial advisers in the interim can make use of the summary of the general life-cycle stages to help them identify their own stage in the life cycle and to gain more insight into their businesses.
6.2 Problems encountered
As indicated in Table 4, only five of the 18 problems investigated were categorised as important. Three of the important problems listed are related to the financial advisers' having insufficient time for delivering the service (problems number 1, 3 and 6). It is possible that the advisers concentrated primarily on the operational side (subsequently failing to make strategic plans for the business), because they did not have time to do anything else.
The root of the time dilemma might be that the financial advisers lacked the necessary staff members to help them perform their duties. Those who did employ staff allotted them administrative duties rather than specialist roles. A total of 62 per cent of the respondents personally interviewed indicated that they were attempting to perform all the business activities personally. Most of the respondents who participated in the telephone interviews (62,41 per cent) had no employees in their business and most of them (89,47 per cent) experienced no employee growth in the relevant period.
The respondents had a maximum of three specialised functions in their businesses. The majority of the respondents (67,67 per cent) indicated that they had no specialised function. Most of them employed an administrative worker, which was the most popular type of specialised role performed (total percentage of 58,82 per cent).
Table 4 further indicated that the remaining 13 problems were classified as problems needing consideration only. Based on these problems, it seems that the respondents were also struggling with competitors, financial resources, customers, employees, product offerings and a lack of external networks.
The implications are that independent financial advisers would have to pay attention to their employment practices if they were to overcome the important problems they were experiencing. They should also pay attention to competitors, financial resources, customers, employees, product offerings and networking in order to address the problems needing consideration.
Since this study could identify only the important problems and those requiring consideration, the critical problems experienced by independent financial advisers remain unknown and would also need further investigation.
Finally, because the respondents did not experience all the problems listed in Table 4 (the offshore competition problem was not experienced), research proposition 2 can be only partially accepted.
7 Conclusion
This study identified the important problems and problems requiring consideration only in the businesses of independent financial advisers.
As the general life-cycle stages can be associated with the businesses of independent financial advisers, it is possible to conclude that the problems experienced by the respondents do occur in these general life-cycle stages.
A future, more comprehensive examination of the organisational life cycle of independent financial advisers in South Africa is necessary. Researchers should identify more practical criteria that could assist in grouping independent financial advisers into the various general life-cycle stages. The businesses should be studied over a longer period and financial statements could be analysed to gain a more in-depth view. Following this investigation, the problems listed in Table 4 could then be further examined as experienced by the independent financial advisers in each cluster to verify the obstacles that can occur in each life-cycle stage.
References
BOSMA, N., ACS, Z.J., AUTIO, E., CODURAS, A. & LEVIE, J. 2008. Global entrepreneurship monitor. Executive report. [Online] Available at: http://www.gemconsortium.org/download/1287850267108/GEM_Global_08.pdf [Accessed: 2010-10-23] [ Links ].
CHURCHILL, N. & LEWIS, V. 1983. The five stages of small business growth. Harvard Business Review, 61(3):30 (20p). [Online] Available at: EBSCOHost: Business Source Premier: http://search.global.epnet.com/ [Accessed: 2008-09-01] [ Links ].
DODGE, H. & ROBBINS, J.E. 1992. An empirical investigation of the organizational life cycle model for small business development and survival. Journal of Small Business Management, 30(1):27 (11p). [Online] Available at: http://proquest.umi.com/login [Accessed: 2008-08-29] [ Links ].
FERREIRA, J.J. 2000. Development and study of a taxonomy of stage configurations of the life cycle, applied to the SME of the Beira interior region. [Online] Available at: http://74.125.77.132/search?q=cache:A_u0_MUsNGYJ:sbaer.uca.edu/research/icsb/2000/pdf/081.PDF+Development+and+study+of+a+taxonomy+of+stage+configurations+
of+the+life+cycle,+applied+to+the+SME+of+the+Beira+interior+region&hl=af&ct=clnk&cd=1&gl=za&lr=lang_en [Accessed: 2008-08-26].
GALBRAITH, J. 1982. The stages of growth. Journal of Business Strategy, 3(4):70 (10p). [Online] Available at: Proquest: http://proquest.umi.com/login [Accessed: 2008-09-01] [ Links ].
HANKS, S.H., WATSON, C.J., JANSEN, E. & CHANDLER, G.N. 1993. Tightening the life-cycle construct: a taxonomic study of growth stage configurations in high-technology organisations. Entrepreneurship: Theory & Practice, 18(2):5 (24p). [Online] Available at: EBSCOHost: Business Source Premier: http://search.global.epnet.com/ [Accessed: 2007-04-28] [ Links ].
HILL, J., NANCARROW, C. & WRIGHT, L.T. 2002. Lifecycles and crisis points in SMEs: a case approach. Marketing Intelligence & Planning, 20(6):361-369. [Online] Available at: Emerald: http://www.emeraldinsight.com [Accessed: 2006-06-01] [ Links ].
KIRIRI, P.N. 2004. Small and medium enterprises (SMEs): validating life cycle stage determinants. [Online] Available at: http://www.google.com/search?q=cache:tfZ35oBqHFgJ:www.sbaer.uca.edu/research/icsb/2002/auth_letter/pdf/085.pdf+organisational+life+cycle+and+marketing+elements&hl=en [Accessed: 2005-11-04].
LESTER, D.L. & PARNELL, J.A. 2008. Firm size and environmental scanning pursuits across organizational life cycle stages. Journal of Small Business and Enterprise Development, 15(3):540-554. [Online] Available at: Emerald: http://emeraldinsight.com [Accessed: 2008-09-15] [ Links ].
LESTER, D.L., PARNELL, J.A. & CARRAHER, S. 2003. Organizational life cycle: a five-stage empirical scale. International Journal of Organizational Analysis, 11(4):339-354. [ Links ]
MCMAHON, R.G.P. 1998. Stage models of sme growth reconsidered. [Online] Available at: http://commerce.flinders.edu.au/researchpapers/98-5.htm [Accessed: 2005-10-22] [ Links ].
MELLAHI, K. & WILKINSON, A. 2004. Organizational failure: a critique of recent research and a proposed integrative framework. [Online] Available at: http://www3.interscience.wiley.com/user/accessdenied?ID=120846356&Act=2138&Code=4717&Page=/cgi-bin/fulltext/120846356/HTMLSTART [Accessed:2008-09-25].
MILLER, D. & FRIESEN, P.H. 1984. A longitudinal study of the corporate life cycle. Management Science, 30(10):1161-1183. [ Links ]
MOORES, K. & MULA, J. 1998. Strategy diversity in Australian family owned businesses: impact of environment induced constraints. Bond Management Review, 5 (Article 2). [Online] Available at: http://eprints.usq.edu.au/4186/ [Accessed: 2005-10-23] [ Links ].
MOUNT, J., ZINGER, J.T. & FORSYTH, G.R. 1993. Organizing for development in the small business. Long [ Links ]
Range Planning, 26(5):111-120. PHELPS, R., ADAMS, R. & BESSANT, J. 2007. Life cycles of growing organizations: a review with implications for knowledge and learning. International Journal of Management Reviews, 9(1):1(30p). [Online] Available at: http://onlinelibrary.wiley.com [Accessed: 2010-10-24] [ Links ].
POUTZIOURIS, P., BINKS, M. & BRUCE, A. 1999. A problem-based phenomenological growth model for small manufacturing firms. Journal of Small Business and Enterprise Development, 6(2):139-152. [Online] Available at: Emerald: http://www.emeraldinsight.com [Accessed: 2006-06-01] [ Links ].
QUINN, R. & CAMERON, K. 1983. Organisational life cycles and shifting criteria of effectiveness: some preliminary evidence. Management Science, 29:33-41. [ Links ]
SCOTT, M. & BRUCE, R. 1987. Five stages of growth in small business. Long Range Planning, 20(3):45-52. [ Links ]
SHA, S. 2006. An investigation into problems facing small-to-medium sized enterprises in achieving growth in the Eastern Cape: Enhancing the strategy for developing small 'growth potential' firms in the Eastern Cape. [Online] Available at: http://eprints.ru.ac.za/archive/00000288/ [Accessed: 2008-07-09] [ Links ].
SIU, W. & KIRBY, D.A. 1998. Approaches to small firm marketing: A critique. European Journal of Marketing, 32(1/2):40-60. [ Links ]
SMITH, K.G., MITCHELL, T.R. & SUMMER, C.E. 1985. Top level management priorities in different stages of the organizational life cycle. Academy of Management Journal, 28(4):799 (22p). [Online] Available at: Proquest: http://proquest.umi.com/login [Accessed: 2008-09-15] [ Links ].
STEVENS, R.E., WRENN, B., SHERWOOD, P.K. & RUDDICK, M.E. 2006. The marketing research guide. New York: Best Business Books. [ Links ]
SWANEPOEL, A. 2004. Comply like a pro! Johannesburg: Creda Communications. [ Links ]
TIMMONS, J.A. & SPINELLI, S. 2007. New venture creation. Entrepreneurship for the 21st century. Singapore: Irwin/McGraw-Hill. [ Links ]
UK ASSOCIATION OF INDEPENDENT FINANCIAL ADVISERS. 2001. Response by the UK Association of Independent Financial Advisers to the commission document on European governance. [Online] Available at: http://ec.europa.eu/governance/contrib_ukifa_en [Accessed: 2006-10-04] [ Links ].
UNISA. 2007. Short course in SMME management. [Online] Available at: http://www.unisa.ac.za/Default.asp?Cmd=ViewContent&ContentID=19518 [Accessed: 2008-09-15].
WRIGHT, S.A. 2008. What is an independent financial adviser? [Online] Available at: http://www.discoveryarticles.com/articles/127563/1/What-is-an-Independent-Financial-Adviser/Page1.html [Accessed: 2008-09-14] [ Links ].
Accepted December 2010

