


Services on Demand
Article
 English (pdf)
 Article in xml format
 Article references
Indicators

Related links
-
 Cited by Google
 -
 Similars in Google
Share

 Permalink
South African Journal of Economic and Management Sciences
On-line version ISSN 2222-3436
Print version ISSN 1015-8812
S. Afr. j. econ. manag. sci. vol.13 n.4 Pretoria Jan. 2010
ARTICLES
The effect of stressed economic conditions on operational risk loss distributions
Ja'nel EsterhuysenI; Gary van VuurenII; Paul StygerII
IAbsa Capital: Investment Bank Division of Absa Bank Economics at the North-West University
IINorth-West University
ABSTRACT
The depth and duration of the credit crisis has highlighted a number of problems in modern finance. Banks have been accused of excessive risk taking, rating agencies of severe conflicts of interest, central banks of neglecting the inflation of asset price bubbles and national supervisors of lax regulatory controls. Credit and market losses have been considerable. Operational losses have also surged as surviving corporates merge or acquire less fortunate ones without the requisite controls. Furthermore, as more jobs get made redundant it is believed that people are getting forced to play their hand to get involved in internal fraud as their sources of income have dried up drastically and stealing from the institution seems to be their last resort.. The main objective of this paper is to establish if there has been a change in the nature of operational risk with regards to the number of operational losses as well as their impact pre and during the crisis. The way in which operational losses have been affected will be presented and a comparison will be made between operational loss characteristics pre and during the crisis. Some of the main findings of this paper were that operational losses showed little change in frequency, but showed a significant increase in severity, meaning that their financial impact has been more severe during the crisis. Therefore it is quite safe to say that the financial crisis most definitely had an impact on operational risk as the impact of operational losses became much more severe.
Key words: operational risk, loss distribution, frequency distribution, credit crunch
JEL C46, G21, G32
1 Introduction
Operational risk, defined as 'the risk of loss resulting from inadequate or failed internal processes, people and systems or from external events (including legal risk)' (BCBS, 2006a), is not a new concept for banks: bank's balance sheets have reflected operational losses for several decades. These losses materially affect the soundness and operational efficiency of all banking activities and all business units. There is, however, not much precedent for measuring operational risk as there is generally a scarcity of data and where there are data; the history only dates back two to three years. However, various academics and authors have done extensive work attempting to measure operational risk1. The other two major risk types (as classified by the BCBS), namely market and credit risk, enjoy abundant data and years of standardised, globally-applied methodological approaches. Validation of these models – to assess their suitability and robustness – is also common, employing a catalogue of well-tested approaches including stress- and back-testing. Internal operational risk data, however, is far from abundant for most banks. While there is now a choice of several databases for external loss data, further work is required to determine how banks should adjust these to accommodate the fact that they originated in different size and control environments. In addition, some banks do not always accurately report the correct data in order to disguise control failures that may lead to capital penalties, further affecting the accuracy of operational risk data (Van Grinsven, 2009). In addition, for most risk loss data the collection process is manual, which leaves even greater room for errors and further impacts data quality.
Operational risk events have an extremely diverse set of causes, including fraud, improper business practices and product flaws, failures of technology, employment discrimination, transaction and execution errors as well as natural disasters and terrorism – some sources go as far as to say it includes everything except specific causes for credit and mark risk (Cruz, 2002:14). As a result, operational risk data coverage must include inter alia a broad spectrum of information regarding sources of internal weaknesses, precise definitions of 'start' and 'end' event dates, clear classification of loss amounts, recovery procedures and duration and much more. Operational loss databases, therefore, need to be significantly more comprehensive than those required for accounting restatements and they need to be much more robust with regards to qualitative data. This study employed data gleaned from a relatively new and extremely detailed operational loss data source – Algo FIRST – that identifies operational loss events and records a host of other loss information.
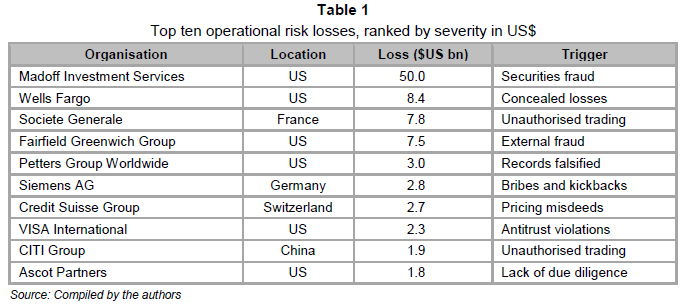
The onset of the 'credit crunch' in mid 20072 heralded a sudden, severe and prolonged reduction in the availability of credit affecting all components of the global economy. The origins of the credit crisis are diverse and many, but it is now widely accepted that among the major causes were lax lending conditions, unusually low interest rates (which – maintained at low levels for longer than usual periods – spurred a massive increase of asset prices), low global inflation, elevated oil prices, widespread complacency in financial regulation and naïveté in the assignment of credit ratings of credit derivatives. The credit crisis has tipped the economies of many countries into recession, and even those that have fared relatively better than others, are still affected by the lack of credit availability and diminished imports and exports.3 The credit crisis represents an interesting opportunity to asses the claim that operational risk (fraud, for example, as evidenced by the devastating Maddof deception (Table 1)), increases in times of recession. Operational loss characteristics were examined and evaluated prior to the onset of the credit crisis and these results compared with those obtained during4 the crisis to establish whether these events have changed in frequency or in severity or in both. The reason for doing this is to establish if the economic crisis has had an impact on operational risk and operational losses as most of the focus has been just on credit risk, and since there has been an increase in high-profile operational losses reported (see section 2) in the last twelve months, there is certainly the belief that operational risk has changed with regards to frequency and severity of operational losses.
Although this paper focuses mainly on international results/data, it should be clear that South African results/data were also taken into account; however the international results/data were more easily available and therefore make up the bulk of the analysis. Furthermore, the inclusion of operational risk in the Basel II framework means that measuring operational risk and making adequate capital provisions for it is directly relevant for financial institutions in South Africa and the rest of the African continent.
The remainder of this paper is arranged as follows: Section 2 provides a brief literature survey of operational loss studies and conclusions reached while Section 3 presents a summary of the distributions employed to investigate the effect of the credit crisis on inter-arrival time, frequency and severity of operational risk losses. A description of the data employed in the study is also presented in Section 3 and the subsequent analysis of the data follows in Section 4. Section 5 concludes the article.
2 Literature survey
It is widely known that the level of observed fraud increases during times of recession (Ernst & Young, 2009:3). This is often attributed to fraudsters having less cushioning with which to hide fraudulent activities without incurring even more substantial risks. A recent example of this has been several 'Ponzi' schemes, which involve early investors being paid with money gleaned from subsequent investors. By design, these schemes rely on growth, but more especially on new capital, to perpetuate the fraud. The collapse of Bernard Madoff's fund, which has to date accumulated some US$50bn of losses, was accelerated by a lack of both liquidity and investable assets. Another possible reason for the increase in fraud during a recession is that business becomes harder and in some cases employees will misrepresent the facts in order to close deals or will window dress financial performance to mask disappointing results – keeping in mind that managers are always under extreme pressure to meet financial targets, even at times of general malaise in the economic cycle (Ernst & Young, 2003). Also, when companies are making redundancies or are undergoing management changes in a down cycle, gaps can appear in financial controls making institutions more vulnerable to operational risk (Ernst & Young, 2009:3). A further problem is the inevitable reduction in time and effort spent on operational risk management when profits are halved and bonuses terminated.
In terms of operational risk losses, 2008 was the worst year on record, the severity of losses being driven by credit, market, and liquidity risk. Table 1 lists the top ten operational risk losses ranked by loss amount during 2008. Although many of these events included activities and lapses in diligence that were originally undertaken prior to the credit crisis, the state of global markets amplified their severity.
Galbraith (1955) noted – in his original analysis of the 1929 stock market crash which heralded the Great Depression – that inventories of 'undiscovered embezzlement' accumulate during years of booming markets. The disguise of these frauds is sustained and prolonged as periods of strong growth do not encourage searches for the origins of spectacular returns. This situation is reversed when market conditions alter (and particularly when these conditions alter abruptly) resulting in frauds and deceptions which are quickly exposed as suspicions increase and audits become penetrating and meticulous. Some of these incidents take years to unravel and for all the ramifications to be uncovered, significantly increasing the loss severity.
A European survey conducted since the onset of the crisis found 'disappointing tolerance of unethical behaviour among employees across Europe' (Ernst & Young, 2009:2).5 The survey found that increasing pressure to stabilise businesses (as well as meet stringent financial targets) has increased the temptation to relax controls. This is a particular problem in banks where – apart from the standard operational problems associated with financial institutions such as fraud and theft – swelling unemployment has created more opportunities during the recessionary environment. Increased staff redundancies result in a shifting of organisational structures which then leads to gaps in financial controls as reporting responsibilities become blurred. In addition, positions are often made redundant without consideration of the employee filling the position: in most cases, however, it is the individual that serves as control and not the position filled by them. These factors all contribute to marked increases in fraudulent activities.
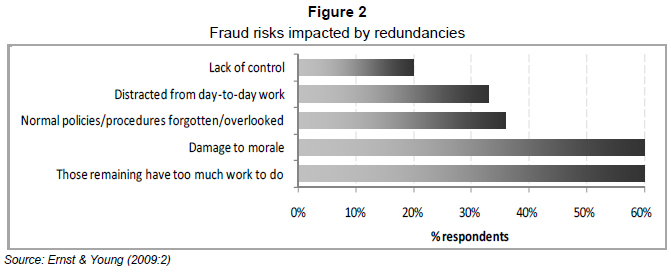
Respondents of the survey by Ernst and Young (2009:2) complained that normal operating policies are frequently overlooked or forgotten completely during periods of redundancies – many respondents believed an increase in fraudulent activities will be experienced 'over the next few years' as a direct result of the credit crisis (Figure 1).
The survey confirmed that corporate anti-fraud efforts are severely hampered by redundancies and reorganisations as they often overstretch back and middle offices, resulting in fewer personnel to implement, monitor and maintain procurement decisions or payment authorisations (Figure 2). Authority to execute anti-fraud policies may be delegated to inexperienced managers who may not be able to easily detect anomalies and signs of potential danger and remaining staff are too stretched to accurately perform the control role when large numbers of redundancies were made (Ernst & Young, 2009:3).
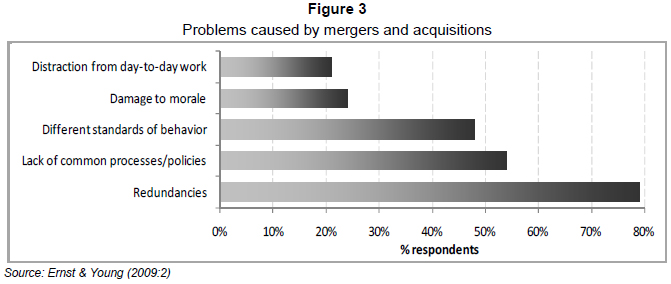
The credit crisis has resulted in the failure of a number of banks (of all sizes). As a result, and in an attempt to curtail the crisis, governments and other banks have both encouraged and engineered a surge in mergers and acquisitions (Douglas, 2007). These activities also have potential negative consequences for operational risk (Figure 3).
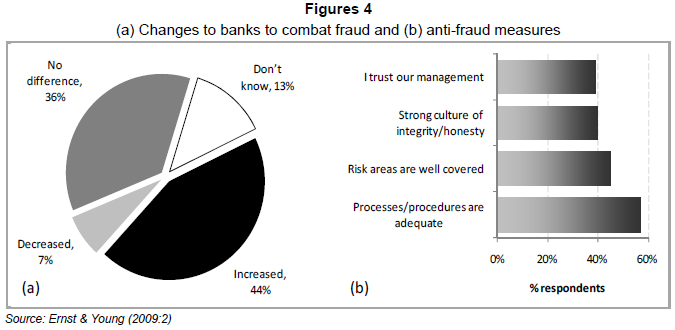
Only 44% of bank personnel respondents (Ernst & Young, 2009) believed that anti-fraud measures would be increased due to the credit crisis while the same percentage believed either no change would be made or that these would be decreased (Figure 4a). The reasons for the prevailing laissez faire attitude to anti-fraud measures is summarised in Figure 4b.
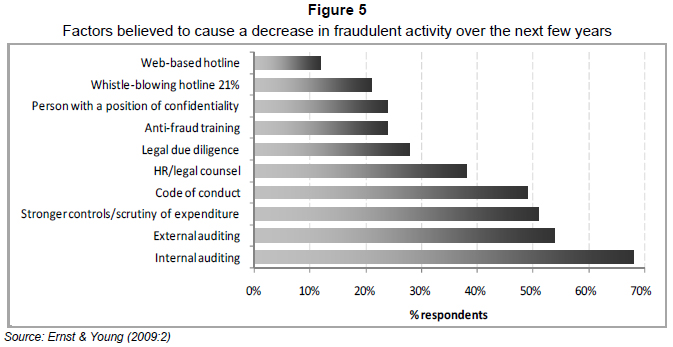
Responses to the question 'what do you believe will result in a decrease in fraudulent activity over the next few years' are summarised in Figure 5. There is a disproportionate reliance on auditing (whether internal or external) but history has shown that it is frequently in the auditing process that the biggest problems reside.
Cagan and Lantsman (2008) asserted that market booms give rise to irrational exuberance,6 usually accompanied by lax lending standards and associated large losses when market conditions deteriorate. The implementation of controls is considered counter to growth during boom periods, resulting in financial institutions operating environments and control structures adapting accordingly. Supervision (or rather the lack of supervision) was found to be a key issue for internal fraud, usually the cause of the largest operational risk losses (Cagan and Lantsman, 2008:23). In addition, research suggested that the lack of testing for data accuracy was also a major contributor: many frauds and rogue trading events involved some form of data manipulation. In these cases, most inputs went unchecked by even a second pair of eyes. Furthermore, most 'fraud' controls are human controls: the potential for error resides with the staff member responsible for the control. A strong correlation between high market volatility and the observed frequency of operational risk events was also found (Cagan and Lantsman, 2008). Indeed, the former is now believed to be a powerful indicator of the latter and is considered an early warning sign.
By its very nature as a new research area, operational risk is sparse in the empirical literature. The latest empirical studies mostly focus on documenting the size and significance of operational losses. For instance, Cummins, Lewis, and Wei (2006) find a significantly negative equity market reaction to operational loss announcements. Perry and de Fontnouvelle (2005) found a stronger reaction to internal fraud announce-ments among firms with stronger shareholder rights as proxied by a lower G-index7 . De Fontnouvelle, de Jesus-Rueff, Jordan and Rosengren (2006) show that capital requirements for operational losses can regularly exceed those for market risks at large US banks. Allen and Bali (2007) examine cyclicality in operational risk measures, derived from the stock returns of financial institutions, after purging the effect of other sources of risks. However, their approach does not utilize any information from operational losses that actually occurred.
Chernobai, Jorion and Fan Yul (2009) found that firms suffering from operational risk events tend to be younger, more complex and financially weaker than those firms that did not. They also had a higher number of anti-takeover provisions, fewer board auditors and fewer CEOs whose option- and bonus-based compensations were larger relative to their salary. These results shed new light on the importance of corporate governance and executive compensation in the understanding of the risk in financial institutions. Important implications for the treatment of correlations among operational risk events emerged from the study (Chernobai et al., 2009). The majority of banks treat operational losses as independent events (BCBS, 2006b), either unconditionally or within the same event type or business line. Only a small number of banks have implemented or are considering incorporating more complex dependence structures. Macroeconomic covariates were found to play a lesser role in explaining the arrival distribution of operational risk events, but evidence was found to suggest that many internal factors contribute to operational risk events of all types. The consequence of these conclusions is that the assumption of operational event independence (within the bank) may be seriously unsound and therefore that internal measures of operational risk capital are underestimated. Table 1 supports this conclusion: nine out of the ten incidents illustrated originated within the business and were not caused by external factors.
The credit crisis has exposed weaknesses in several operational processes conducted by banks. The Madoff fraud, for example, demonstrated the danger of unquestioning trust. Years before the discovery of the fraud, the market was unable to replicate or back test Madoff's winning trading strategies. Despite warning signals such as these, some increasingly vocal, investment continued.
Another factor exposed by the credit crisis was the amplification effect of market volatility on operational risk losses (particularly losses from trading events). The impact of sudden, severe increases in volatility on market activity was overlooked in the benign economic period which preceded the credit crisis. The lack of operational risk reviews or stress testing on mortgage-backed securities8 or other credit derivatives showed another weakness, as did the outsourcing of risk. Many banks believed risk has been transferred, but more virulent risks – in the form of operational and liquidity risk – returned during the crisis.
Frauds perpetrated during 'boom times' are inevitably uncovered during market downturns, suggesting that the time to properly manage risk is during the years when controls become more lax and fraud is less feared. Preliminary research done by the authors has shown that it is easier to uncover fraud during downturns (when there is much more focus on managing the 'bottom line'): it is usually fraud events that impact already smaller 'bottom lines' even further. As a result, it is then necessary to test the above-mentioned by means of evaluating operational loss data pre and during the crises to determine if there has been a change in the nature of operational losses and to establish if fraud (assumed as one of the major causes for operational loses) actually did increase during the crisis. The next section will evaluate operational loss data pre and during the crisis by means of modelling frequency and severity distributions for both periods and will provide commentary on each.
3 Operational loss distributions and data
The BCBS classification of the distribution of operational risk loss severity is shown in Figure 6. Expected losses should be covered by pricing and provisioning, and unprotected losses (beyond a certain percentile – 99.9 in the regulatory milieu) can potentially be dealt with using insurance (albeit very expensive). Unexpected losses require regulatory operational risk capital. In fact, Basel II requires that the estimation of the operational risk capital charge should target unexpected losses and capture tail events (BCBS, 2001:3, BCBS, 2006a:151, and BCBS, 2006b).
The choice of July 2007 as the start of the credit crisis was justified in part by the first article which mentioned the crisis by name (Moneyweek, 2007), but also by the subsequent analysis that indicated that severe signs of weakness were evident (and becoming manifest) by late July 2007 (Daily Kos, 2009).
The data were procured from Algo FIRST¸ a database comprising over 7 500 external loss events (covering the top 200 banks in the world) (May 2009) that addresses exposures related to corporate governance, strategic issues, market practices and business risk. Information on operational losses is gathered by Algorithmics and is gleaned from public sources including regulatory agencies9 and the media. The database provides information about global operational losses in the financial and non-financial industries since 1920. Detailed descriptions of each event are offered including dates of loss occurrence and settlement, loss amounts, event geographical location, claimant name and event triggers. The data format conforms to the BCBS definition of event types and business lines. It is important to note that, because data are collected from public sources, they may not be representative of the population of operational losses. Since larger losses are more difficult to hide, it is possible that the sample is biased toward higher-magnitude events although it has been argued that it is precisely those events that generate concern as they cause major failures and may require managerial response. Furthermore, the data are also only for large banks (revenue > $10bn) and exclude the small
less complex banks. Operational risk losses across all business lines and from all operational loss types were split into very broad categories:
- Pre-crisis: the benign (from an economic point of view) 4.5 year period from January 2003 to June 2007 characterised by low interest rates, low inflation, relatively new bank regulation on operational risk, explosive growth of credit (and other) derivatives, massive loan securitisations, huge demand for commodities such as oil and metals from India and China, low unemployment; and
- During crisis: the turbulent 2 year period from July 2007 to the present (June 2009) – i.e. from the onset of the credit crisis and characterised by almost non-existent interest rates, hugely diminished stock markets, increasing taxes, a severe regulatory environment (for banks, regulators, rating agencies and so on) and rising unemployment.
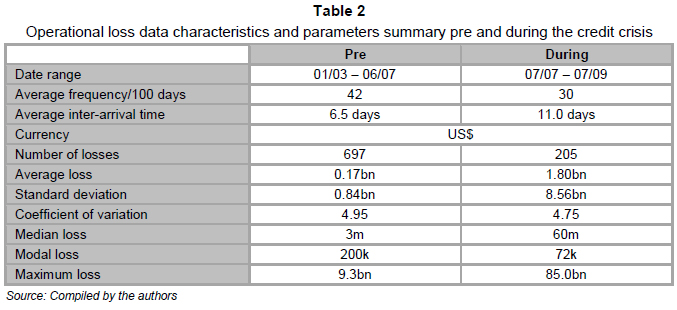
In the above table it can be seen that the frequency of the operational losses has decrease by about 30 per cent per average 100 days but the average value has increased by more than 10 times, which means that the number of operational losses went down but that their impact was more significant. Furthermore the maximum loss experienced during the crisis is almost equal to the total of all the operational losses experienced pre-crisis. This high-level analysis certainly gives the indication that operational losses became much more severe during the crisis. The next section will examine the results more scientifically. As mentioned in the introduction, South African operational loss data were also taken into account in this study, however international data makes up the bulk as it is more easily available.
Loss characteristics are summarised in Table 2 below.
4 Analysis
First, the frequency of operational losses was analysed pre and during the credit crisis. The loss frequency and severity, measured as functions of time, are shown in Figures 7(a) and (b) respectively. The demarcation time is clearly shown.
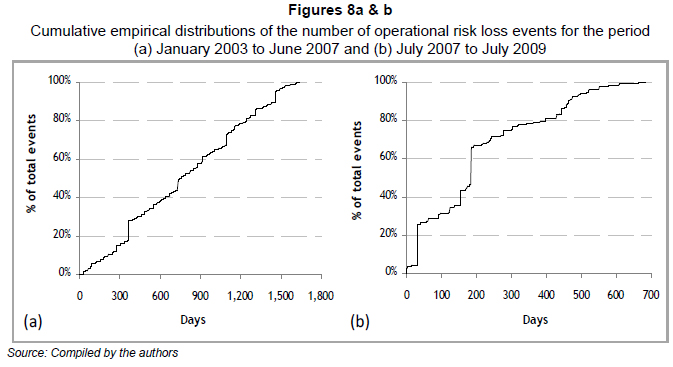
While the overall loss frequency diminishes during the crisis to date, the loss severity increases substantially (see also Table 2 figures for: "Average loss"). Note that the frequency 'spikes' at year ends are simply due to increased reporting and the closing out of outstanding cases for financial reporting purposes. Cumulative empirical frequency distributions before and during the crisis are shown in Figures 8(a) and (b) respectively. Before the crisis, a linear relationship holds indicating that losses arrive at a roughly constant rate. During the crisis, however, the relationship is convex. Steep jumps and discontinuities characterise the entire distribution showing the arrival of large losses in short periods of time.
Cumulative empirical severity distributions before and during the crisis are shown in Figures 9(a) and (b) respectively. Before the crisis, the curve rises steeply at first and then becomes roughly linear. This is indicative of losses with severity more or less evenly distributed (i.e. of roughly similar size). During the crisis the relationship is again highly convex with large jumps – indicative of an uneven severity distribution. A single loan contributes 23 per cent of total losses during the crisis.
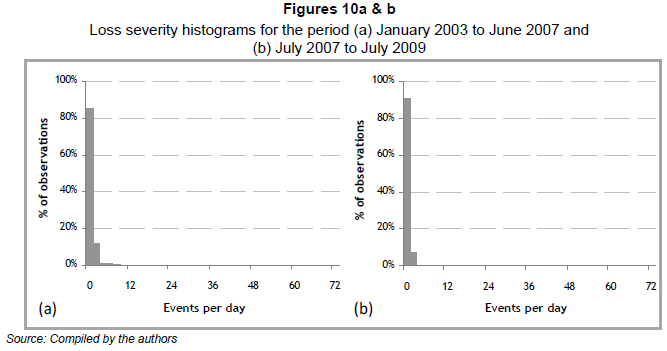
Frequency distributions of loss events (measured as events per day) before and during the crisis are shown in Figures 10(a) and (b) respectively. These are broadly similar. The vast majority of recorded operational loss events occur at low frequency with occasional 'bad days'. On one day, 72 losses were recorded pre-crisis. During the crisis, to date a maximum of 44 loss events were recorded on a single day.
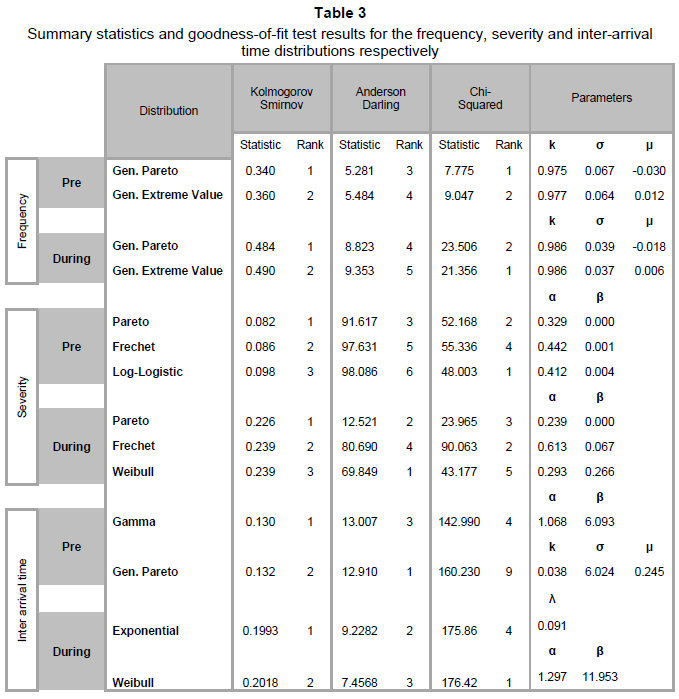
Table 3 records the statistical details of curve fitting and the goodness of fit thereof. Three different fitting techniques have been applied to the data to determine which distribution fits the data the best for both severity and frequency. The reason why this is done is that there are various different types of statistical distributions available, however not all of them can be used as the specific data to determine which distribution will be best to use. The rank column in Table 3 indicates which type of distribution fits the data the best. For the frequency distribution, the General Pareto Distribution has been used for both pre-and during the crisis data. The Pareto Distribution has been found to be the most accurate in modelling the severity distribution for both pre-and during the crisis data. For the inter-arrival time distribution, the Gamma Distribution has been found to be the most useful for the pre-crisis data and the Exponential Distribution has been found to be the best for data during the crisis.
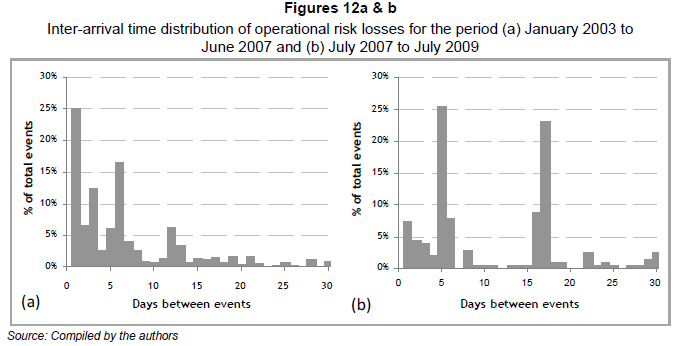
Severity distributions of loss events (again measured as events per day) before and during the crisis are shown in Figures 11(a) and (b) respectively. These show many similarities – a concentration of low severity losses and a few large outliers, or tail events. The inter-arrival time of loss events – measured before and during the crisis – are shown in Figures 12(a) and (b) respectively. Before the crisis, the majority of events occur within one week of each other (although a single, 30-day period between events was also recorded). During the crisis, the distribution becomes bimodal with prominent peaks at 6 and 17 days. Despite the increased loss severity during the crisis, the average time between events (inter-arrival time) almost doubles from 6 days (pre-crisis) to 11 days (during the crisis). This means that although time between events has increased, the severity became much more severe meaning that operational losses during the crisis were not happening as frequent as pre-crisis, but that their values were much higher than those happening pre-crisis.
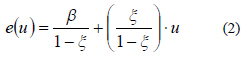
Low-frequency, high-severity events are of particular interest to operational risk managers. These events occur in the upper tails of loss distributions. Peak over threshold (POT) models focus on loss events above certain (high) thresholds and then fit distributions to data that occur above these thresholds (Jobst, 2007). For a sufficiently large threshold u , the conditional excess function Fu of such extreme observations may be summarised by the generalised Pareto distribution (GPD). The cumulative distribution function of GPD is:

where x refers to extreme events above the threshold, μ is the location parameter, which indicates the point where the distribution starts (where - ∞ < μ < + ∞ but it is often assumed that μ = 0), β is the scale parameter of the distribution (with β > 0 ) and ξ is the shape parameter of the distribution, which indicates whether the distribution will have steep or low shape. Of interest to operational risk managers is the choice of a high threshold (indication of which operational losses will form part of the tail – extreme losses), which can be calculated by the mean excess function which is defined as:
where, e is and indication of the behaviour of the tail of the distribution.
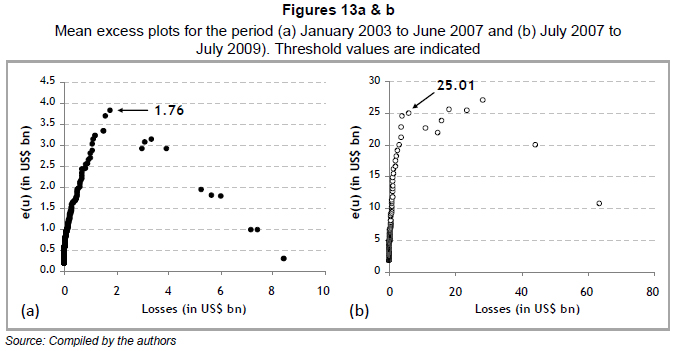
A general rule of thumb involves choosing u such that the mean excess plot is linear for x >u . Figures 13(a) and (b) show the mean excess plots for losses measured pre and during the crisis respectively. Equation 2 explains the fat tail behaviour of the loss distribution, meaning it actually indicated the value of the extreme losses in the distribution – the fatter the tail of the distribution, the more extreme the losses. The pre-crisis threshold loss is US$1.76bn while during the crisis, it is US$25.01bn – this is a good indication that the extreme losses (those defining the tail of the distribution) became much more extreme during the crisis.
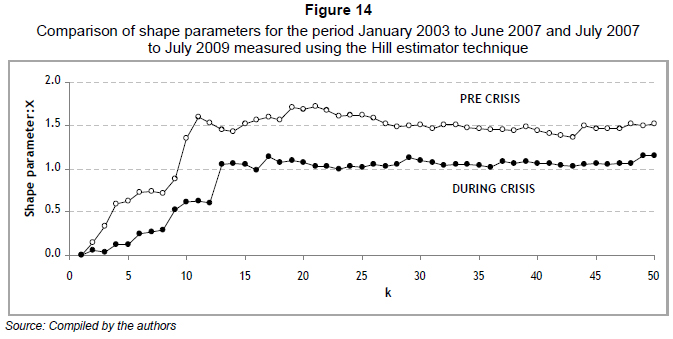
It is also important to obtain accurate estimates of ξ (shape parameter, which defines the shape of the distribution). While other methods to measure the shape parameter exist (such as the Maximum Likelihood Estimator, which is convenient, but not optimal), the method of choice is invariably the Hill estimator (Hill, 1975) as it was proven over 20 years to be the most reliable and accurate measure of the shape parameter (Cruz, 2002:221) and (Perry & de Fontnouvelle, 2005:332). The Hill estimator is given by:
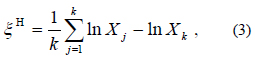
Where:
k is the number of extreme tail values.
X are random variables.
Shape parameters pre and during the crisis are shown in Figures 14. The pre crisis shape parameter value of 1.5 indicates an exponential-type distribution of losses, while during a crisis value of 1.0 indicates a longer-tailed distribution (as observed in Figure 14). Knowledge of the parameter values is extremely helpful for the determination of loss values at given percentiles or at extremely high confidence intervals. What this mean is that it is helpful in determining (to a certain confidence) the tail of the distribution, which is a good indication of the value of the extreme events that occurred during a certain time.
5 Conclusions
As discussed in the introduction, the main objective of this paper is to determine if the world economic crisis has had an impact on operational risk regarding the frequency and severity of operational losses. In section 4 (Figure 10), it can be seen that the frequency of operational losses pre and during the crisis relatively remained the same with the vast majority of operational losses occurring at low frequency with occasional "bad days". The severity distributions of operational losses pre and during the crisis (see Figure 9) were different in that the severities increased during the crisis, giving the loss distribution a "fatter" tail. This mean that during the crisis, the frequency remained relatively constant, but that the severity of losses increased significantly, as can be seen in Table 2, where the average loss increased from $0.17bn pre-crisis to $1.8bn during the crisis. What this illustrates is that the world economic crisis had an impact on operational risk as the severity of operational losses during the crisis became much more severe. While each financial crisis will exhibit unique characteristics, the same essential features tarnish all significant downturns.
Some of the reasons for this include, but are not limited to, failure of management to identify and isolate key problem individuals and key solution individuals. The knock-on effect is invariably overworked and disgruntled staff, leading to other problem sources being overlooked or ignored entirely. Also, the current climate (August 2009) of increased corporate failure and subsequent elevated merger and acquisition activity provides opportunities for operational risk to flourish. In such cases, senior management should allow sufficient time for handover. New business heads should ensure that access to skilled resources (such as process understanding, accounting expertise, document review, data analytics and field studies and the ability to report independently, i.e. outside of existing hierarchies) are maintained. Senior management should also recognise the significant incentives and opportunities for aggrieved redundant staff to steal invaluable Intellectual Property (IP) on departing and should monitor instances of electronic access to valuable data.
Another possible reason for the increase in operational loss severities is the fact that "deal-making" slowed down drastically in the last twelve months, which mean that some bankers might have forced a deal through that will in normal times never go through. In some cases, some bankers might also have broken the rules (controls) in order to get the deal through and the possibility exists that thy might have colluded with, for example credit staff, to let the deal go through.
Some preventative measures proposed by the authors include Audit Committees that should ensure important risks are not ignored. Board members should be informed of the adequacy of audit plans, why focus has been concentrated on certain risk indicators and the way in which approaches to operational risk problems have been validated. Audit teams and committees should be independent, reporting directly to the board in order to minimise the impact on their activities when senior management changes are made. Effort should be made to ensure these functions stay unchanged during merger and acquisitions (or other take-over exercises) to ensure control and risk management stability.
Post-merger, the new organisation is often challenged with the need to be able to gather, analyse, and report on data flowing from multiple, incompatible, disparate and complex systems. At a strategic level, there is a requirement to ensure reporting systems can provide information at a consolidated level that relies on the availability and integrity of data in merged and stand-alone operational systems. For example, remote access possibilities or administrator accounts, which could have been installed by current or ex-employees (i.e., made redundant or disgruntled IT staff) provide potential avenues for information leakage and fraudulent mani-pulation.
Most organisations struggle to meet these challenges because of (Chernobai et al., 2009):
- a lack of understanding of the complexities related to new systems and the requirements of systems integration that can result in security holes that can be compromised,
- incompatible systems across many different divisions or entities,
- the geographical spread of entities,
- systemic data quality issues because of inconsistencies that result from different formats, structures, and storage methods,
- a lack of common reporting tools,
- a lack of resource availability to focus on pre-emptively detecting and preventing fraud and abuse as a result of the merger, and
- the associated costs (during turbulent market periods, all costs are minimised and no increases in 'unnecessary' expenses are permitted).
All these factors lead to increased post-merger fraud risk.
After companies have been acquired and integrated, further potential pitfalls remain. Asset write-downs relating to purchased entities have become increasingly common and company management should remain vigilant to risks arising from these, as they can provide a smokescreen where frauds could potentially be hidden.
Endnotes
1 See for example De Fontnouvelle, DeJesus-Rueff, Jordan & Rosengren (2003), Dutta & Perry (2006) and Lambrigger, Shevchenko & Wuthrich (2007).
2 It is the subject of some debate as to the originating event which triggered the 'credit crisis'. See Section 4 for a more detailed discussion of and qualifying arguments for the authors' choice of mid 2007.
3 Further information about this (ongoing) tumultuous period may be found in Diamond and Rajan (2009).
4 The time of writing (August 2009), and despite some evidence of 'green shoots of recovery', the crisis is arguably far from over. Lending practices remain severely curtailed, stock markets are still well below their pre-crisis highs, most economies remain in the grip of recession and many banks remain supported by their sovereigns.
5 Although this study was conducted in Europe, the risk of increasing fraud is also expected in South Africa as the slowdown continues to cause economic woes.
6 ' irrational exuberance has unduly escalated asset values, which then become subject to unexpected and prolonged contractions ' (Greenspan, 1996).
7 A G-index is an index for quantifying the scientific productivity of physicists and other scientists based on their publication record (Cagan, 2009).
8 One of the major 'toxic assets' still affecting bank balance sheets.
9 For example, the SEC (US) and the FSA (UK).
References
ALLEN, L. & BALI, T. 2007. Cyclicality in catastrophic and operational risk measurements, Journal of Banking and Finance, 31:1191-1235. [ Links ]
BCBS. 2001. Consultative Document: Operational risk, Bank of International Settlements. Internet: http://www.bis.org/publ/bcbsca07.pdf, accessed June 3, 2009. [ Links ]
BCBS. 2006a. International convergence of capital measurement and capital standards, Bank of International Settlements. Internet: http://www.bis.org/publ/bcbsc111.htm, accessed June 22, 2009. [ Links ]
BCBS. 2006b. Observed range of practice in key elements of advanced measurement approaches (AMA), Bank of International Settlements. Internet: http://www.bis.org/publ/bcbs131.htm, accessed August 3, 2009. [ Links ]
CAGAN, P. 2009. Managing operational risk through the credit crisis, The Journal of Compliance Risk & Opportunity, 3(2):19-26. [ Links ]
CAGAN, P. & LANTSMAN, Y. 2008. The cyclicality of operational risk: the tracking phenomenon. Internet: http://www.algorithmics.com/EN/publications/whitepapers/registration.cfm?code=wp18, accessed May 31, 2009. [ Links ]
CHERNOBAI, A., JORION, P. & FAN YUL, P. 2009. The determinants of operational risk in U.S. financial institutions, in press. [ Links ]
CRUZ, M.G. 2002. Modelling, measuring and hedging operational risk, John Wiley & Sons Ltd. West Sussex, UK. [ Links ]
CUMMINS, J.D., LEWIS, C.M. & WEI, R. 2006. The market value impact of operational risk events for U.S. banks and insurers, Journal of Banking and Finance, 30:2605-2634. [ Links ]
DAILY KOS. 2009. When did the financial crisis really start? Internet: http://www.dailykos.com/story/2009/2/12/125228/516/46/696617, accessed August 1, 2009. [ Links ]
DE FONTNOUVELLE, P., DEJESUS-RUEFF, D., JORDAN, J. & ROSENGREN, E. 2003. Using loss data to quantify operational risk, Technical Report, Federal Reserve Bank of Boston. [ Links ]
DE FONTNOUVELLE, P., DEJESUS-RUEFF, D., JORDAN, J. & ROSENGREN, E. 2006. Capital and risk: New evidence on implications of large operational losses, Journal of Money, Credit, and Banking, 38:1819-1846. [ Links ]
DIAMOND, D.W. & RAJAN, R.D. 2009. The Credit Crisis: Conjectures about Causes and Remedies, American Economic Review, American Economic Association, 99(2):606-60. [ Links ]
DOUGLAS, S. 2007. UK mergers and acquisitions at all time record, Investment Markets. Available from http://www.investmentmarkets.co.uk/20070904-771.html, accessed 7 June, 2009. [ Links ]
DUTTA, K. & PERRY, J. 2006. A tale of tails: an empirical analysis of loss distribution models for estimating operational risk capital. Federal Reserve Bank of Boston, Working Paper No 06-13. [ Links ]
ERNTS & YOUNG. 2009. Fraud risk on the increase across Europe as recession bites, survey conducted by Ernst and Young's Fraud department. Internet: Http://www.ey.com/RU/en/Newsroom/News-releases/Press-Release, accessed June 1, 2009 [ Links ]
GALBRAITH, J.K. 1955. The Great Crash, Penguin, New York. [ Links ]
GREENSPAN, A. 1996. From a speech made to the American Enterprise Institute on December 5, 1996. [ Links ]
HILL, B.M. 1975. A simple general approach to inference about the tail of the distribution, Annals of Statistics, 3:1163-1174. [ Links ]
JOBST, A.A. 2007. Operational Risk - The sting is still in the tail but the poison depends on the dose, Journal of Operational Risk, 2(2):435- 449. [ Links ]
LAMBRIGGER, D., SHEVCHENKO, P. & WUTHRICH, M. 2007. The quantification of operational risk using internal data, relevant external data and expert opinions, The Hournal of Operational Risk, 2(3):3-27. [ Links ]
MONEYWEEK. 2007. Is this the start of the credit crisis? Internet: http://financialmediaandcomms.blogspot.com/2008/09/global-credit-crunch-when-did-it-start.html, accessed on May 19, 2009. [ Links ]
PERRY, J. & DE FONTNOUVELLE, P. 2005. Measuring reputational risk: the market reaction to operational loss announcements, Working paper, Federal Reserve Bank of Boston. [ Links ]
VAN GRINSVEN, J. 2009. Operational risk losses – Not just reporting. Internet: http://www.riskfriends.comordpress.com/2009/03/10/ops-risk-not-just-reporting/ accessed on April 20, 2009. [ Links ]
Accepted September 2010

