


Services on Demand
Article
 English (pdf)
 Article in xml format
 Article references
Indicators

Related links
-
 Cited by Google
 -
 Similars in Google
Share

 Permalink
Literator (Potchefstroom. Online)
On-line version ISSN 2219-8237
Print version ISSN 0258-2279
Literator vol.38 n.1 Mafikeng 2017
http://dx.doi.org/10.4102/lit.v38i1.1301
ORIGINAL RESEARCH
Testing the impact of known variables on the attitudes held by Setswana L1-speaking university students towards their L1
Toetsing van bekende veranderlikes aangaande die houdings wat deur Setswana T1-sprekende universiteitstudente gehuldig word ten opsigte van hul T1
Thabo Ditsele
Department of Applied Languages, Tshwane University of Technology, South Africa
ABSTRACT
Previous language attitudes studies among public university students in South Africa have shown that these five variables - gender, age group, year of study, level of study and field of study - influence students' attitudes towards languages. Thus, the aim of this survey was to establish if testing these variables on Setswana L1-speaking university students (n = 247) will confirm previous studies, seeing that this is the first study to gather data exclusively among Setswana L1-speaking university students at five universities (both public and private) in Tshwane and Johannesburg up to doctoral level. Never before had data been gathered among students at private universities in South Africa, and this gap had weakened generalisations that previous surveys could make about all university students. Mixed methods were used to gather data, which were analysed using means, chi-square test and percentages. The five variables were tested for statistical significance in influencing language attitudes. All but one variable (gender) had statistically significant relationships (p ≤ 0.05) with at least one of the closed-ended questions. Generally, respondents valued their L1 and deemed it relevant in their lives and society they live in.
ABSTRAKTE
Vorige taalhoudingstudies onder openbare universiteitstudente in Suid-Afrika, het getoon dat hierdie vyf veranderlikes: geslag; ouderdomsgroep; studiejaar; vlak van studie; en studieveld, studente se houdings teenoor tale beïnvloed. Dus was die doel van hierdie opname om te bepaal of die toetsing van hierdie veranderlikes op Setswana T1-sprekende universiteitstudente (n = 247), vorige studies sal bevestig, aangesien dit die eerste studie is wat uitsluitlik data insamel onder Setswana T1-sprekende universiteitstudente by vyf universiteite (beide openbare en privaat) in Tshwane en Johannesburg, tot doktorale vlak. Nog nooit vantevore is data ingesamel onder studente by private universiteite in Suid-Afrika nie. Hierdie gaping het veralgemenings in vorige opnames ten opsigte van alle universiteitstudente verswak. Gemengde metodes is gebruik om data, wat geanaliseer is met behulp van gemiddeldes, chi-kwadraattoets en persentasies, in te samel. Die vyf veranderlikes is getoets vir statistiese betekenisvolheid in die beïnvloeding van taalhoudings. Alles behalwe een veranderlike (geslag) het statisties-beduidende verhoudinge (p ≤ 0.05) gehad met ten minste een van die geslote-einde vrae. Oor die algemeen, het die respondente hulle T1 waardeer en dit relevant geag in hul lewens en die samelewing waarin hulle woon.
Introduction: Aim of the survey
The aim of this survey was to establish the attitudes held by Setswana L1-speaking university students towards their L1 - and it is the first survey to do so among this population. The author did this survey for his doctoral study,1 and its data were too large to be presented in one article. The data were then presented in two articles,2 including this one.
The 247 students surveyed studied at five universities - three public and two private. The significance of surveying students at both types of universities was informed by the fact that no previous survey on language attitudes in South Africa had gathered data from students who studied at private universities, thus another section of a student population was omitted, thereby weakening such surveys' findings because they could not be generalised to the population of all university students. Data were gathered to seek answers to the following two questions: (1) Do the respondents believe that their L1 is valuable and relevant in their lives and society they live in? and (2) Do the five variables (listed below) influence the attitudes held by the respondents?
Whereas the two articles have the same number of students surveyed, they differ in as far as the variables are concerned. Of the nine variables tested in the survey, the first article tested the following four: competence in an L1 (Setswana in this case), linguality (or languages that one can communicate in), location of nurture (where one grew up or spent most of their formative years) and type of university attended (public or private). These variables were new in language attitudes studies in South Africa. In this article, the following five variables3 were tested to establish their potential influences on attitudes towards Setswana: (1) gender, (2) age group, (3) years at university4, (4) level of study5 and (5) field of study.
By focusing exclusively on Setswana (a language concentrated6 in the following three provinces of South Africa: North West, Gauteng and Northern Cape), this survey aimed at increasing the number of Black South African languages (BSALs)7 surveyed, as far as language attitudes studies were concerned. It is important to acknowledge that Bekker (2002) and Hilton (2010) conducted research among Setswana L1-speaking university students, albeit not exclusively or comprehensively. Bekker's survey was conducted at the University of South Africa and included L1 speakers of Sotho-Tswana languages (viz. Northern Sotho, Setswana and Southern Sotho). Hilton's survey was done at North-West University where Afrikaans and Setswana are dominant languages. Setswana L1 speakers constituted 34.2% of the total sample size, and only second to Afrikaans L1 speakers with 42.8%.
Unlike previous surveys, which largely focused on the use of BSALs as languages of learning and teaching (LOLTs), this survey went beyond the previously explored phenomenon of 'attitudes within the education space' by exploring new phenomena, such as the cultural identity of a people (the Batswana8), as well as the promotion and propagation of a BSAL, Setswana.
Background: Language attitudes studies in South Africa
There has been limited research on language attitudes studies in South Africa. According to Bekker (2002:90), the first attempt to garner information on the attitudes of L1 speakers of BSALs towards LOLT was that of Edelstein9 in 1972. Edelstein's survey intended to ascertain the attitudes of urban Bantu10 Grade 12 pupils in Soweto, firstly, towards the different ethnic groups of South Africa, which comprised Black South Africans, Indians, Afrikaners, Coloureds (or people of mixed race) and British South Africans, and secondly, towards themselves, and their situations. The research included a question on what language they would prefer their children to be educated in, with the choices being English, Afrikaans and a BSAL.
The first survey on university students who spoke BSALs as L1s was conducted by Vorster and Proctor (1976) at the University of Fort Hare. The authors sought to determine the extent and nature of a hypothesised negative attitude towards Afrikaans by their respondents, and compared with their attitudes towards English. Since the dawn of democracy in 1994, the concentration of language attitudes studies among university students has mainly been in two provinces: the Eastern Cape and the Western Cape. There have also been a significant number of studies done in KwaZulu-Natal, albeit to a lesser extent than the other two provinces. Also, the respondents have mainly been drawn from L1 speakers of isiXhosa and isiZulu, to a lesser extent.
Of the several language attitudes studies carried out among university students in South Africa, the following were most relevant to this one because they were conducted after 199411:
-
Dyers (1999) at the University of the Western Cape
-
Bekker (2002) at the University of South Africa
-
Dalvit (2004) at the University of Fort Hare
-
Aziakpono (2007) at Rhodes University
-
· Hilton (2010) at North-West University.
Aziakpono (2007:4) notes that that existing literature identified the following variables as factors influencing attitudes towards a language: age (or age group), schooling background, gender, year of study and field of study.
Theoretical framework
Language attitudes
Cooper and Fishman (1974:6) state that it may be useful to define a 'language attitude' in terms of its referent. However, this is not straightforward. Premised on language attitude being an attitude that has language as its referent, Ferguson (1972, in Cooper & Fishman 1974:6) defines 'language attitude' as 'elicitable shoulds [sic.] on who speaks what, when and how'. In analysing Ferguson's definition, Cooper and Fishman argue that it excludes attitudes of interest to sociolinguistics, such as attitudes towards organised efforts involved in language planning, language maintenance or language shift. Ferguson also defines 'language attitude' in terms of its consequences that is, that attitude which influences language behaviour and behaviour towards language. This definition also has shortcomings; Cooper and Fishman argue that it is too broad and if adopted, it is not clear how language attitudes can be distinguished from other attitudes, since almost every attitude, under the right conditions, might affect language behaviour or behaviour towards language.
Cooper and Fishman (1974:6) decided to work on a definition that is premised on language attitude being an attitude that has language as its referent, but they amplified the referent to include language behaviour and referents of which language or language behaviour is a marker or symbol. In other words, attitudes towards a language (they use Hebrew as an example) or towards a feature of a language (e.g. a given phonological variant) or towards language use (e.g. the use of Hebrew for secular purposes) or towards language as a group marker (e.g. Hebrew as a language of Jews) are all examples of language attitudes. In contrast, Cooper and Fishman argue that attitudes towards Jews or attitudes towards secular domains are not language attitudes, although they might be reflected by language attitudes.
'Overt prestige' versus 'covert prestige'
Smit (1996:41) states that 'overt prestige' and 'covert prestige' influence people's use of language. 'Overt prestige' is associated with the high-status group while 'covert prestige' with the low-status group. These types can also be explained from a social psychology point of view because the power dimension causes overt prestige while covert prestige is dependent on the dimension of group identity.
Aziakpono (2007:7-8) states two main functions of language: (1) binding or separation and symbolic - the language used within a group to unite or bind the group members or the use of language as an instrument by which people separate themselves from other people who are not members of their group; and (2) participatory - as a tool that enables people to participate in important social activities and benefit from the resultant privileges. If it is used for the binding/separation and symbolic function, it would have covert prestige among its speakers, but when it is used for the participatory function, it would have overt prestige among non-L1 speakers. For L1 speakers of BSALs, English has overt prestige because it is used for the participatory function or wider communication; but their own languages have covert prestige because they are used for the binding/separation and symbolic function.
Methodology
The questionnaire
A Likert-type scale questionnaire (closed-ended questions) was used to gather quantitative data, and it comprised 16 belief statements. The five options in the closed-ended questions were: strongly agree, agree, not sure, disagree and strongly disagree. Qualitative data were gathered through five open-ended questions.
Both methods (i.e. quantitative and qualitative) were, thus, used in line with Bryman's (1988:131) submission that they enhance the researcher's claim for the validity of their conclusions, particularly if the two methods can be shown to provide mutual confirmation.
The respondents
A total of 247 Setswana L1-speaking university students at five universities were surveyed. Two of them were located in the Tshwane Metropolitan Municipality (both public universities), and three in the Johannesburg Metropolitan Municipality (one public university and two private universities). Appendices 1 and 2 show a summary of the respondents.
Data analysis
Quantitative data were analysed using means, chi-square test12 and percentages. Means were used to determine the respondents' attitudinal positional tendencies (or aggregate attitudinal stance), while the chi-square test was used to determine whether there was a statistically significant13 association between any variable and the response to any belief statement. The percentages were used to illustrate the distribution of the respondents per belief statement.
For the means and consistent with the Likert-type scale, each of the five options was allocated a score as follows: 5 for strongly agree (SA) (4.50-5.00); 4 for agree (A) (3.50- 4.49); 3 for not sure (NS) (2.50-3.49); 2 for disagree (D) (1.50-2.49); and 1 for strongly disagree (SD) (1.00-1.49). With regard to the chi-square test, Aziakpono (2007:55) notes that, in order to determine whether the observed differences in the chi-square test results are significant or not, the standard method used in most social sciences should be employed in this regard. According to Statsoft (2007, in Aziakpono 2007:55), results in which the probability values (p) were ≤0.0514 were regarded as borderline statistically significant, those with probability values of ≤0.01 level were viewed as statistically significant, while the results that had probability values of ≤0.005 or ≤0.001 were regarded as highly-statistically significant. For analysis purposes of the percentages, the options agree and strongly agree were grouped, as was the case with disagree and strongly disagree.
Qualitative data gathered through five open-ended questions were analysed statistically and qualitatively.
Limitations of the study
In South Africa, it is not uncommon for students to enrol at universities in their home or neighbouring provinces. As such, it was not surprising that the majority of the respondents grew up in Gauteng (where this survey was conducted, and Setswana being a significant language in the western and north-western regions of the province) and North West (which shares a border with Gauteng, and where Setswana is a dominant language). Due to the long distance between Gauteng and the Northern Cape, it was also not surprising that no respondents grew up in the latter (where Setswana is a significant language in the northern regions of the province). An absence of any respondents who grew up in the Northern Cape, thus, limits the degree to which the findings of this survey may be generalised to all Setswana15 L1-speaking university students in South Africa.
Findings
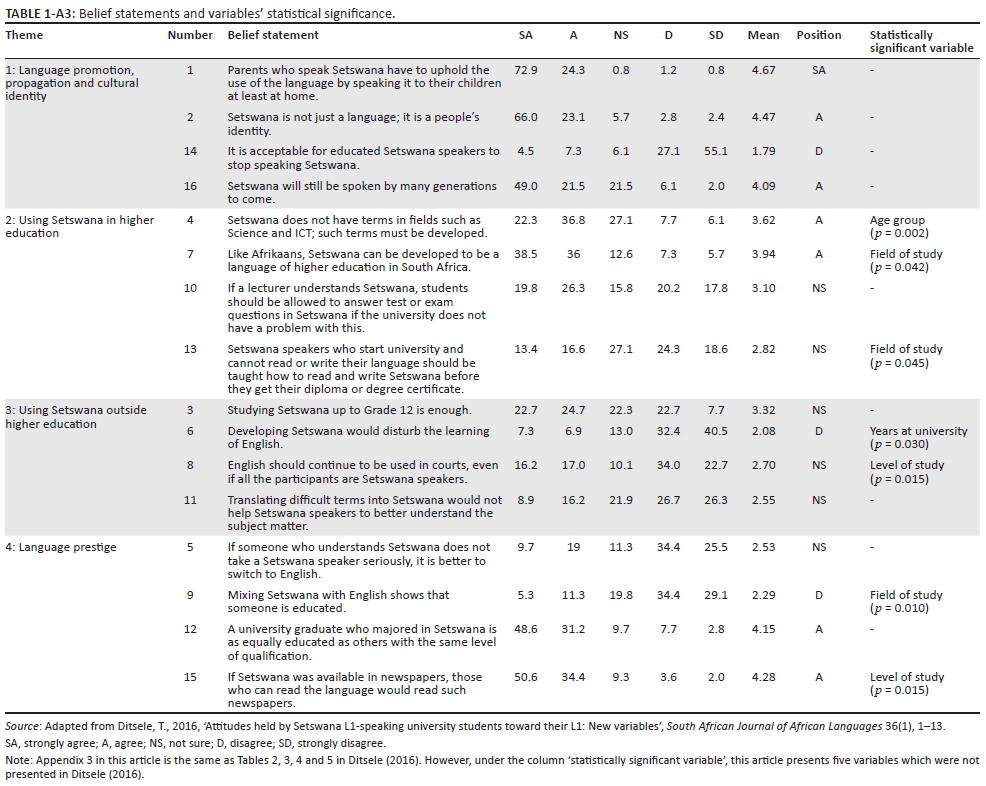
The 16 closed-ended questions and five open-ended questions were split into four themes: (1) language promotion, propagation and cultural identity, (2) using Setswana in higher education, (3) using Setswana outside higher education and (4) language prestige. The same themes were used in the first article to test the variables presented in that article.
Theme 1: Language promotion, propagation and cultural identity
Closed-ended questions16
The respondents strongly agreed (4.67)17 that 'parents who speak Setswana should uphold the use of the language by speaking it to their children, at least at home' (Belief Statement 1). None of the variables had a statistically significant relationship with this belief statement. Across the variables, all the groups strongly agreed with the belief statement and the respondents who pursued post-graduate studies (Level of study)18 recorded the highest mean (4.78), while the respondents from Humanities & Social Sciences (Field of study) recorded the lowest mean (4.56). Looking at the percentages, 97.2% of the respondents strongly agreed/agreed with the belief statement, 0.8% was not sure and 2% strongly disagreed/disagreed with it.
The respondents agreed (4.47) that 'Setswana was not just a language, but a people's identity as well' (Belief Statement 2). None of the variables had a statistically significant relationship with this belief statement. There was a split in the attitudinal positional tendency in all five variables, as some groups of the respondents agreed with the belief statement, while others strongly agreed with it. With regard to Gender, female respondents (4.38) agreed with the belief statement, while male respondents (4.58) strongly agreed with it. Looking at Years at university, two groups of the respondents, that is, 3 years (4.34) and 1 year (4.42) agreed with the belief statement, while the other two, that is, 4 years or more (4.52) and 2 years (4.59) strongly agreed with it. Considering Level of study, the respondents who pursued under-graduate studies (4.46) agreed with the belief statement, while those who pursued post-graduate studies (4.54) strongly agreed with it. With regard to Field of study, the respondents from Management Sciences (4.42), Science & Health Sciences (4.31) and Humanities & Social Sciences (4.47) agreed with the belief statement, while the respondents from Engineering & ICT19 (4.56) and Economics & Finance (4.59) strongly agreed with the belief statement. A total of 89.1% of the respondents strongly agreed/agreed with the belief statement, 5.7% were not sure and 5.2% strongly disagreed/disagreed with it.
The respondents disagreed (1.79) with the statement that 'it is acceptable for educated Setswana speakers to stop speaking Setswana' (Belief Statement 14). Put differently, they felt that one's education level should not make them stop speaking Setswana. None of the variables had a statistically significant relationship with this belief statement. There was a split in the attitudinal positional tendency in one variable, namely, Level of study. In this variable, the respondents who pursued post-graduate studies (1.41) strongly disagreed with the belief statement, while those who pursued under-graduate studies (1.86) disagreed with it. The respondents in the other four variables disagreed with the belief statement, with the respondents from Engineering & ICT (Field of study) and those who had been at university for 1 year (Years at university) both recorded the highest mean (2.07). A total of 11.8% of the respondents strongly agreed/agreed with the belief statement, 6.1% were not sure and 82.2% strongly disagreed/disagreed with it.
The respondents agreed (4.09) that 'Setswana will still be spoken by many generations to come' (Belief Statement 16). None of the variables had a statistically significant relationship with this belief statement. Across the variables, all the groups agreed with the belief statement and the respondents from Engineering & ICT (Field of study) and those who had been at university for 3 years (Years at university) both recorded the highest mean (4.22), while those from Management Sciences (Field of study) recorded the lowest mean (3.98). Looking at the percentages, 70.5% of the respondents strongly agreed/agreed with the belief statement, 21.5% were not sure and 8.1% strongly disagreed/disagreed with it.
Open-ended Question 1: Should Setswana be developed further or not?
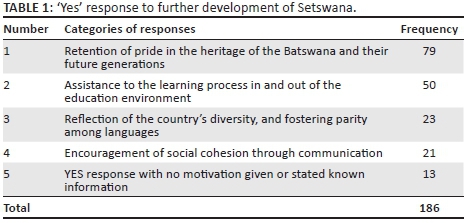
A total of 226 respondents (or 91.5% of 247) gave their opinions on whether Setswana should be developed further or not. Out of these 226 respondents, 166 (or 73.5%) gave a YES response; that is, they agreed that Setswana should be developed further; 44 respondents (or 19.5% of 226) gave a no response; that is, they disagreed that the language should be developed further; and 16 respondents (or 7.1% of 226) were not sure.
In responding to this open-ended question, the respondents expressed themselves differently. However, their responses revolved around five categories which appear in Table 1. It is important to note that some respondents submitted more than one point; such points were placed in all applicable categories, thus, the total number of responses (186) is higher than that of the respondents (166).
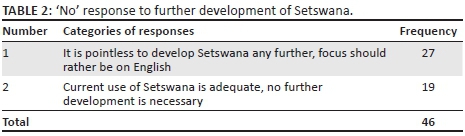
As indicated in Table 2, two categories emerged from the respondents who gave a 'no' response.
The responses of 16 respondents were interpreted as a not sure. This was because 10 of them agreed that further development of Setswana was necessary, but negated that by stating the disadvantages of doing so; and six respondents submitted that they could not speak on behalf of others; that is, the decision to develop Setswana further or not rested with individual speakers.
Theme 2: Using Setswana in higher education
Closed-ended questions20
The respondents agreed (3.62) that 'Setswana does not have terms in fields such as Science and ICT; such terms must be developed' (Belief Statement 4). Age group was the only variable that had a statistically significant relationship with this belief statement (p = 0.002). From the point of view of the attitudinal positional tendency, all the groups in the following two variables agreed with the belief statement (i.e. Gender and Level of study). There was a split in the attitudinal positional tendency in the other three variables (i.e. Age group; Years at university; and Field of study). In these three variables, some groups of the respondents agreed with the belief statement, while others were not sure about it. With regard to Age group, the respondents who were not sure were those aged 18-20 years (3.43), while those aged 21-25 years (3.66) and 26-35 years (4.32) agreed with the belief statement. Looking at Years at university, the respondents who had been at university for 2 years (3.45) were not sure, while those who had been at university for 1 year (3.55), 3 years (3.61) and 4 years or more (3.94) agreed with the belief statement. With regard to Field of study, the respondents from Science & Health Sciences (3.45) were the only ones who were not sure about the belief statement, while those from the other four groups agreed with it. A total of 59.1% of the respondents strongly agreed/agreed with the belief statement, 27.1% were not sure and 13.8% strongly disagreed/disagreed with it.
The respondents agreed (3.94) that 'like Afrikaans, Setswana can be developed to be a language of higher education in South Africa' (Belief Statement 7). Field of study was the only variable that had a statistically significant relationship with this belief statement (p = 0.042). Across the variables, all the groups agreed with the belief statement and the respondents who were aged 26-35 years (Age group) recorded the highest mean (4.36), while those from Science & Health Sciences (Field of study) recorded the lowest mean (3.51). Looking at the percentages, 74.5% of the respondents strongly agreed/agreed with the belief statement, 12.6% were not sure and 13% strongly disagreed/disagreed with it.
The respondents were not sure (3.10) that 'if a lecturer understands Setswana, students should be allowed to answer test and/or exam questions in Setswana if the university does not have a problem with this' (Belief Statement 10). None of the variables had a statistically significant relationship with this belief statement. Across the variables, all the groups were not sure about the belief statement and the respondents who had been at university for 4 years or more (Years at university) recorded the highest mean (3.29), while those who had been at university for 1 year (Years at university) recorded the lowest mean (2.89). A total of 46.1% of the respondents strongly agreed/agreed with the belief statement, 15.8% were not sure and 38% strongly disagreed/disagreed with it.
The respondents were not sure (2.82) whether 'Setswana speakers who start university and cannot read or write their language should be taught how to read and write Setswana before they get their diploma or degree certificate' (Belief Statement 13). Field of study was the only variable that had a statistically significant relationship with this belief statement (p = 0.045). Across the variables, all the groups were not sure about the belief statement and the respondents who had been at university for 3 years (Years at university) recorded the highest mean (3.22), while those from Science & Health Sciences (Field of study) recorded the lowest mean (2.55). Looking at the percentages, 30% of the respondents strongly agreed/agreed with the belief statement, 27.1% were not sure and 42.9% strongly disagreed/disagreed with it.
Open-ended Question 2: If Setswana speakers were to be taught all subjects in Setswana from primary school to university, would that make it easier or difficult to find employment in South Africa?
Question 2 has a primary question (i.e. finding employment) that is linked to a hypothetical scenario (i.e. using an L1 as an LOLT, or mother-tongue education), which is secondary. Some respondents responded to the primary question, others to the secondary hypothetical scenario, and, a handful, to both. The findings for all three types of responses were reported on.
A total of 215 respondents (or 87% of 247) responded to the question. Of this, 167 respondents (or 77.7% of 215) stated that Setswana L1 speakers would find it difficult to find employment or would not benefit from being taught all subjects in Setswana from primary school to university; 41 respondents (or 19.1% of 215) stated that it would be easier; and seven respondents (or 3.3% of 215) submitted reasons for both sides.
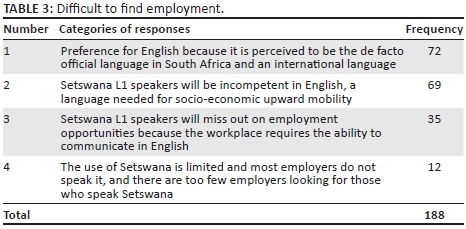
A total of 174 respondents (i.e. 167, plus seven who argued for both sides) gave various reasons for stating that Setswana L1 speakers would find it 'difficult' to find employment or would not benefit from being taught all subjects in Setswana from primary school to university - English was the overwhelming preferred choice. As indicated in Table 3, four categories emerged out of their responses. Some respondents submitted more than one point; such points were placed in all applicable categories, thus, the total number of responses (188) is higher than that of the respondents (174).
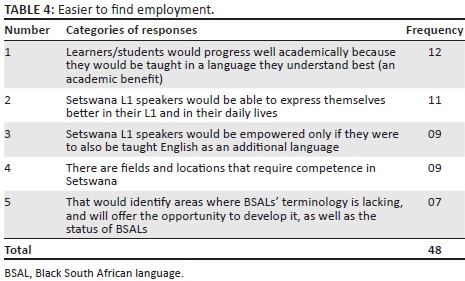
A total of 48 respondents (i.e. 41, plus seven who argued for both sides) gave various reasons for stating that Setswana L1 speakers would find it 'easier' to find employment or would benefit from being taught all subjects in Setswana from primary school to university. As shown in Table 4, five categories emerged out of their responses.
Theme 3: Using Setswana outside higher education
Closed-ended questions21
The respondents were not sure (3.32) whether 'Studying Setswana up to Grade 12 is enough' (Belief Statement 3). None of the variables had a statistically significant relationship with this belief statement. From the point of view of the attitudinal positional tendency, all the groups in the following two variables were not sure about the belief statement (i.e. Gender and Level of study). There was a split in the attitudinal positional tendency in the other three variables (i.e. Age group; Years at university; and Field of study). In these three variables, the majority of the respondents were not sure about the belief statement. However, the following agreed with it: those aged 18-20 years (Age group) at 3.50; those who had been at university for 1 year (Years at university) at 3.51; and those from Economics & Finance (Field of study) at 3.53. A total of 47.4% of the respondents strongly agreed/agreed with the belief statement, 22.3% were not sure and 30.4% strongly disagreed/disagreed with it.
The respondents disagreed (2.08) that 'developing Setswana would disturb the learning of English' (Belief Statement 6). Years at university was the only variable that had a statistically significant relationship with this belief statement (p = 0.030). Across the variables, all the groups disagreed with the belief statement and the respondents who had been at university for 3 years (Years at university) recorded the highest mean (2.34), while those who had been at university for 4 years or more (Years at university) recorded the lowest mean (1.77). Looking at the percentages, 14.2% of the respondents strongly agreed/agreed with the belief statement, 13% were not sure and 72.9% strongly disagreed/disagreed with it.
The respondents were not sure (2.70) whether 'English should continue to be used in courts, even if all the participants are Setswana speakers' (Belief Statement 8). Level of study was the only variable that had a statistically significant relationship with this belief statement (p = 0.015). From the point of view of the attitudinal positional tendency, Gender was the only variable where both groups were not sure about the belief statement. There was a split in the attitudinal positional tendency in the other four variables (i.e. Age group; Years at university; Level of study; and Field of study). In these four variables, the majority of the respondents were not sure about the belief statement. Be that as it may, the following disagreed with it: those aged 26-35 years (Age group) at 2.24; those who had been at university for 4 years or more (Years at university) at 2.31; those who pursued post-graduate studies (Level of study) at 2.20; and those from Management Sciences (Field of study) at 2.48. A total of 33.2% of the respondents strongly agreed/agreed with the belief statement, 10.1% were not sure and 56.7% strongly disagreed/disagreed with it.
The respondents were not sure (2.55) whether 'translating difficult terms into Setswana would not help Setswana speakers to better understand the subject matter' (Belief Statement 11). Put differently, they were uncertain if translating difficult terms into Setswana would help Setswana speakers to better understand the subject matter. None of the variables had a statistically significant relationship with this belief statement. There was a split in the attitudinal positional tendency among the groups in all the variables as some disagreed with the belief statement, while others were not sure about it. Looking at Gender, female respondents (2.42) disagreed with the belief statement, while male respondents (2.69) were not sure about it. With regard to age group, those aged 26-35 years (2.08) disagreed with the belief statement, while those aged 18-20 years (2.50) and 21-25 years (2.70) were not sure about it. Considering Years at university, those who had been at university for 4 years or more (2.44) disagreed with the belief statement, while those who had been at university for 1 year (2.50), 3 years (2.61) and 2 years (2.65) were not sure about it. When it comes to Level of study, those who pursued post-graduate studies (2.41) disagreed with the belief statement, while those who pursued under-graduate studies (2.57) were not sure about it. Looking at Feld of study, those from Humanities & Social Sciences (2.31) were the only ones who disagreed with the belief statement; the other four groups were not sure about it. Considering the percentages, 25.1% of the respondents strongly agreed/agreed with the belief statement, 21.9% were not sure and 53% strongly disagreed/disagreed with it.
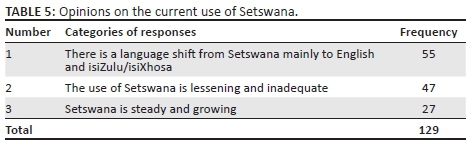
Open-ended Question 3: What is your opinion on the current use of Setswana in South Africa?
A total of 106 respondents (or 42.9% of 247) gave their opinions on the current use of Setswana in South Africa, while 141 respondents (or 57.1% of 247) did not give their opinions, possibly because this question was asked alongside another question (i.e. Question 1), which they, responded to instead. As indicated in Table 5, three categories emerged out of their responses. Some respondents submitted more than one point; such points were placed in all applicable categories, thus, the total number of responses (129) is higher than that of the respondents (106).
Theme 4: Language prestige
Closed-ended questions22
The respondents were not sure (2.53) that 'if someone who understands Setswana does not take a Setswana speaker seriously, it is better to switch to English' (Belief Statement 5). None of the variables had a statistically significant relationship with this belief statement. There was a split in the attitudinal positional tendency in all five variables as the majority of the groups of the respondents were not sure about the belief statement, while a minority of the groups of them disagreed with it. The groups, which constituted the minority, were as follows: male respondents (Gender) at 2.48; those aged 26-35 years (Age group) at 2.28; those who had been at university for 2 years and 4 years or more (both Years at university) at 2.35 and 2.31, respectively; those who pursued post-graduate studies (Level of study) at 2.37; and those from Economics & Finance and Management Sciences (both Field of study) at 2.41 and 2.40, respectively. A total of 28.7% of the respondents strongly agreed/agreed with the belief statement, 11.3% were not sure and 59.9% strongly disagreed/disagreed with it.
The respondents disagreed (2.29) that 'mixing Setswana with English shows that someone is educated' (Belief Statement 9). Field of study was the only variable that had a statistically significant relationship with this belief statement (p = 0.010). From the point of view of the attitudinal positional tendency, all the groups in these three variables disagreed with the belief statement: Gender; Age group; and Level of study. There was a split in the attitudinal positional tendency in the other two variables (i.e. Years at university and Field of study). In these two variables, some groups disagreed with the belief statement, while others were not sure about it. With regard to Years at university, those who had been at university for 1 year (2.56) were the only group that was not sure about the belief statement, while the other three groups disagreed with it. Looking at Field of study, those from Economics & Finance (2.56) were the only ones who were not sure about the belief statement; those in the other four groups disagreed with it. Looking at the percentages, 16.6% of the respondents strongly agreed/agreed with the belief statement, 19.8% of them were not sure and 63.5% strongly disagreed/disagreed it.
The respondents agreed (4.15) that 'a university graduate who majored in Setswana is as equally educated as others with the same level of qualification' (Belief Statement 12). None of the variables had a statistically significant relationship with this belief statement. In four variables (i.e. Gender; Years at university; Level of study; and Field of study), all the groups agreed with the belief statement, while Age group was the only variable in which there was a split between groups which agreed and strongly agreed with it. Those who were aged 18-20 years (4.03) and 21-25 years (4.20) agreed with the belief statement, while those aged 26-35 years (4.52) strongly agreed with it. Considering the percentages, 79.8% of the respondents strongly agreed/agreed with the belief statement, 9.7% were not sure and 10.5% strongly disagreed/disagreed with it.
The respondents agreed (4.28) that 'if Setswana was available in newspapers, those who can read the language would read such newspapers' (Belief Statement 15). Level of study was the only variable that had a statistically significant relationship with this belief statement (p = 0.015). In the following four variables: Gender; Age group; Level of study; and Field of study, all the groups agreed with the belief statement. Years at university, was the sole variable in which there was a split between groups which agreed and strongly agreed with the belief statement. Those who had been at university for 3 years (4.59) were the only group that strongly agreed with the belief statement; the other three groups agreed with it. A total of 85% of the respondents strongly agreed/agreed with the belief statement, 9.3% were not sure and 5.6% strongly disagreed/disagreed with it.
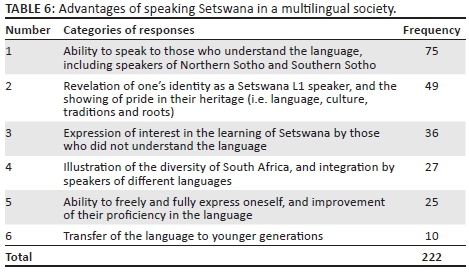
Open-ended Question 4: Are there any advantages of speaking Setswana in a multilingual society of South Africa?
A total of 201 respondents (or 81.4% of 247) gave various 'advantages' of speaking Setswana in a multilingual society. As shown in Table 6, six categories emerged out of their responses. Some respondents submitted more than one point; such points were placed in all applicable categories, thus, the total number of responses (222) is higher than that of the respondents (201).
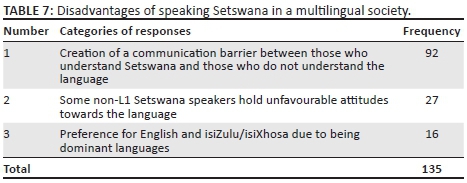
Open-ended Question 5: Are there any disadvantages of speaking Setswana in a multilingual society of South Africa?
A total of 123 respondents (or 49.8% of 247) gave various 'disadvantages' of speaking Setswana in a multilingual society. As indicated in Table 7, three categories emerged out of their responses. Some respondents submitted more than one point; such points were placed in all applicable categories. Thus, the total number of responses (135) is higher than that of the respondents (123).
Discussion
The discussion below will cover the following: (1) a coherent linking of the findings made in the previous section (see 'Findings') and considering the work of other researchers; (2) a look at the statistically significant relationship between the variables and belief statements; and (3) a presentation of this survey's major findings.
Theme 1: Language promotion, propagation and cultural identity
The attitudinal positional tendencies in all four Belief Statements (1, 2, 14 and 16) showed that the respondents held positive attitudes towards their L1. This was confirmed by the overwhelming response (73.5%) to Question 1 that Setswana should be developed further, and it was not under the threat of extinction.
The most popular response given by the respondents was that developing Setswana further would retain the pride in the heritage (which includes roots and ethnicity) of the Batswana and their future generations. In the South African context, 'ethnicity' or 'ethnic identity' is equated with 'language'. For example, De Kadt (2005:22) notes that the language that one speaks (e.g. isiZulu or Southern Sotho) can already signal their 'ethnic identity'. Dalvit (2004, in Dalvit & De Klerk 2005:7) found that the respondents were proud of being Xhosas and were eager to speak about their language and culture.
Some respondents stated that parents, particularly those who lived in the suburbs (or affluent neighbourhoods), did not transfer Setswana to their children; these parents took their children to private and multi-racial schools where Setswana was not offered at all, and communication in the home happened mainly, or only, in English. Interestingly, other respondents believed that the generation after theirs was moving away from speaking Setswana and did not believe that they too were moving in the same direction. This finding confirmed one made by De Kadt (2005:33-34); in her survey, the respondents who grew up in the suburbs and went to multi-racial schools believed that the generation after theirs was immersed in English (not least in the form of TV and the web), and that they were 'lost'. They tended not to see themselves involved in language shift, from isiZulu towards English.
Theme 2: Using Setswana in higher education
Belief Statements 4 and 7 were future orientated, while Belief Statements 10 and 13 were of an immediate orientation. The two orientations had a bearing on the attitudinal positional tendencies of the respondents; they agreed or were open to the idea of Setswana being developed for future use in higher education (Belief Statements 4 and 7), but were not sure if the immediate use of Setswana in higher education (Belief Statement 10 and 13) was a good idea. With regard to Belief Statement 13, Aziakpono (2007:81) investigated this belief statement differently; she put the following belief statement to the respondents: 'It should be made compulsory23 for everybody coming to Rhodes University to study isiXhosa as a subject'. The majority of the respondents thought that isiXhosa should not be made compulsory. In the current survey, the respondents also stated that BSALs should not be made compulsory at university. Furthermore, they argued that when learning a BSAL at university, for example, as a communication module, more students were likely to enrol for such modules, as opposed to when they were made compulsory.
Perhaps, the best assessment in trying to understand the reason for being not sure about Belief Statements 10 and 13 could be found in the responses to Question 2. The association between these belief statements and Question 2 was evinced by the fact that, if English and not Setswana, was an important language to secure employment, then it should follow that the respondents should have disagreed with these belief statements. The fact that they were not sure, suggested that there was another factor at play. That factor may be explained by Bangeni and Kapp's (2007:259) longitudinal study - their respondents constantly emphasised the symbolic significance of their L1s and were also quick to point out the importance of English in their lives, in terms of future access to resources and upward social mobility. In the current survey, the respondents could not dismiss Setswana (a language of covert prestige) because it had a symbolic significance in their lives, while English (a language of overt prestige) was a necessary tool for upward social mobility.
In illustrating the positive attitudes held towards English, Edwards (1994) and Giles et al. (1977) note that in a diglossic situation such as in South Africa, languages such as English that have high socio-economic status, are often positively evaluated and more favourable (instrumental) attitudes are shown towards such languages than to lower status varieties, such as BSALs (Aziakpono & Bekker 2010:47). Support for English was overwhelming across language attitudes studies that were looked at, and such support was also evident in this survey. However, Dalvit (2004, in Dalvit & De Klerk 2005:6) found a small minority of the respondents (7%) which expressed negative attitudes towards English; they perceived it as a language of oppression and division, and these attitudes could be a consequence of the hegemony of English in education.
In this survey, data illustrated that, where Setswana appeared to be in competition with English, the respondents were not sure about belief statements, that is, they could not agree or disagree. However, where they perceived that no competition existed, they held positive attitudes towards Setswana.
Theme 3: Using Setswana outside higher education
The attitudinal positional tendency in Belief Statements 6 showed that the respondents held positive attitudes towards their L1. However, the respondents were not sure about Belief Statements 3, 8 and 11. Like in Theme 2 (above), the respondents were not sure in instances of the immediate use of Setswana, but were decisive (i.e. agreed or disagreed) when it came to future orientated ones. Looking at Belief Statement 3, Dyers (1999:79-80) made two findings - the majority of the respondents favoured the combination of English and their L1s as a medium of instruction (MOI) up to high school, but preferred an English-only policy at university.
Concerns about the current use of Setswana were expressed through responding to Question 3. An overwhelming majority of points submitted for this open-ended question (102 out of 129 points) showed that the respondents believed that the use of their L1 was lessening, inadequately used, and there was a shift from it to other languages, but mainly towards English and two Nguni languages (i.e. isiZulu and isiXhosa). Only a minority of points submitted for this question (27 out of 129 points) showed that they believed that their L1 was steady and growing.
Theme 4: Language prestige
The attitudinal positional tendencies in three Belief Statements (9, 12 and 15) illustrated that the respondents held positive attitudes towards their L1. With regard to Belief Statement 5, the respondents were not sure about it. As was discussed in Theme 3 (above), the respondents were faced with deciding between Setswana and English; in this instance, whether one should continue to speak Setswana or shift to English, when the person they were speaking to, expressed negative attitudes towards Setswana. Again, the difficulty to decide between Setswana as a language of covert prestige and English as a language of overt prestige, may have made it challenging to agree or disagree with this belief statement.
Hilton (2010:125-128) did not directly ask the respondents to choose between Setswana and English. However, asking them to score their preference for Setswana indirectly gave some indication for preference for English, if it is reasonable to suggest that lower scores for Setswana translate into higher scores for English. The respondents were asked to score their preference for being addressed in Setswana when they walked into shops or by their municipality. Their scores24 were higher for both 'shops' and 'municipality' - 1.65 and 1.70, respectively. However, she did not find any significant correlation (on Pearson's correlation matrix) for these preferences. The respondents, thus, indicated that they preferred to be addressed in Setswana when they walked into shops or by their municipality.
In comparison with Hilton's survey, the respondents in this survey were explicitly told that their interlocutor held some unfavourable attitudes towards Setswana, while this was missing in Hilton's survey. This element may be the difference between Hilton's respondents being clear on being addressed in Setswana, while the respondents in this survey were not sure about sustaining a conversation in Setswana or switching over to English.
With regard to Questions 4 and 5, the respondents submitted far more points for the advantages of speaking Setswana in a multilingual society (222 points), as opposed to those who submitted points for the disadvantages (135 points). The main advantage was that conversations would become much easier when interacting with those who understood the language, particularly when their L1s were mutually intelligible with Setswana (viz. Northern Sotho and Southern Sotho). The main disadvantage was that conversations would become very difficult when interacting with those who did not understand Setswana.
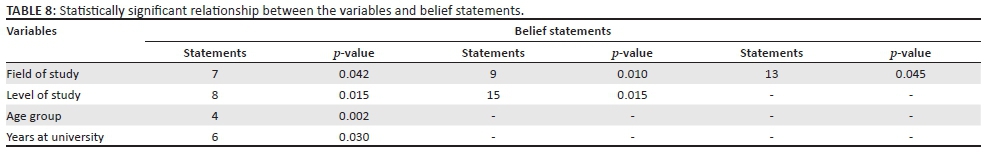
The influence of the variables
Table 8 shows the statistically significant relationships between the variables and belief statements.
While four variables (i.e. Age group; Years at university; Level of study; and Field of study) had statistically significant relationships with at least one of the 16 belief statements, Gender was the only variable that did not have any such relationships with any of the 16 belief statements. Mann (2009:359) found that Gender was statistically significant in influencing attitudes towards Anglo-Nigerian Pidgin in southern Nigeria; he found that male respondents would tend to have more favourable attitudes than female respondents towards a language (variety) that is non-standard and of low social prestige, and he termed this, 'The Gender Attitudes Variable Hypothesis'. An analysis of the means in this survey across all 16 belief statements was consistent with this Hypothesis, in that, male respondents tended to hold more positive attitudes towards Setswana than female respondents. However, none of the belief statements confirmed the statistical significance of this finding.
The variable (i.e. Field of study) which had a statistically significant relationship with more belief statements (i.e. 7, 9 and 13) was chosen as an example to explain the statistically significant relationship between the variables and belief statements. In Belief Statement 7, the respondents agreed with it; in Belief Statement 9 they disagreed with it; and in Belief Statement 13, they were not sure about it. The first belief statement of the three (Belief Statement 7) was also chosen as an example to sustain the point; it states, 'Like Afrikaans, Setswana can be developed to be a language of higher education in South Africa'. The following is the order in which the respondents agreed with the statement: (1) Humanities & Social Sciences at 4.13; (2) Management Sciences also at 4.13; (3) Economics & Finance at 4.05; (4) Engineering & ICT at 3.88; and (5) Science & Health Sciences at 3.51.
Based on the p-value of 0.042 (see Table 8) which shows the statistically significant relationship between Field of study and Belief Statement 7, the researcher submits that another researcher gathering data from the same or similar population using the same belief statement would arrive at the same or similar order of the five groups of 'fields of study'. In fact, an analysis of the means across all 16 belief statements suggested that the respondents from Humanities & Social Sciences held more positive attitudes towards Setswana, followed by the respondents from Management Sciences. The respondents from Economics & Finance; Engineering & ICT; and Science & Health Sciences held the least positive attitudes towards their L1. Be that as it may, it was only in Belief Statement 7 where these trends were statistically significant.
Dalvit (2004, in Dalvit & De Klerk 2005:7) found that the respondents from the Faculty of Arts - an equivalent of this survey's Humanities & Social Sciences - mainly valued the instrumental value of isiXhosa than the respondents from other Faculties. He attributed that to the fact that most of the respondents in the Faculty of Arts studied isiXhosa as an L1 and were prospective teachers of the language.
In this survey, the respondents who studied languages (e.g. BSALs or Afrikaans) were mainly from Humanities & Social Sciences and Management Sciences to a lesser extent (e.g. German, French or Spanish). These respondents were prospective language practitioners, journalists, tourism managers, public relations officers, marketing managers and events coordinators, to name but a few. The fact that their professions are language-orientated (as opposed to those of prospective physicists, analytical chemists, radiographers and medical practitioners from Science & Health Sciences, for example), thus suggests that language had more instrumental value to the respondents from Humanities & Social Sciences and Management Sciences, hence the display of holding more positive attitudes towards their L1.
Summary of major findings
The following are the survey's major findings:
-
Identity: Setswana was important in the lives of the respondents because it revealed their identity as Batswana; and it illustrated pride in the heritage (i.e. language, culture, traditions and roots) of the Batswana.
-
Diversity and social cohesion: Setswana's presence in the South African society reflected the diversity of a multilingual and multicultural society and encouraged social cohesion and nation-building through communication with other speakers, particularly those who speak Northern Sotho and Southern Sotho, which are mutually intelligible with Setswana. It had 'covert prestige' among the respondents.
-
Educational and non-educational benefits: The use of Setswana (e.g. translation of technical terms) in the education environment would help its speakers understand the content better and subsequently progress academically. In other environments (e.g. socially), its speakers would be able to express themselves freely and fully.
-
Value of English: The respondents believed that English was the de facto official language in South Africa, thus knowledge of the language meant access to education (particularly higher education) and ability to communicate widely (e.g. with potential employers), thus upward social mobility came with knowledge of English. It had 'overt prestige' among the respondents.
-
Language shift: Younger generations spoke less Setswana than older generations and were shifting to English and isiZulu/isiXhosa; the shift to English took place in the suburbs and in more formal environments such as schooling and the workplace, while the shift to Nguni languages (particularly isiZulu) in less formal environments such as taxi ranks in Johannesburg where isiZulu is more dominant than other languages. However, this phenomenon was not observed in Tshwane's less formal environments because, unlike in Johannesburg, two Sotho-Tswana languages (viz. Setswana & Northern Sotho) are the dominant languages in Tshwane.
-
Respondents with more positive attitudes: These respondents held more positive attitudes towards Setswana than other respondents: (1) male respondents (2) those aged 26-35 years (3) those who had been at university for 4 years or more (4) those who pursued post-graduate studies and (5) those whose study programmes were in the Humanities & Social Sciences. These findings are based on the analysis of the means, and not on statistical analysis because the low cell counts brought about by the general bias towards one direction (strongly agree/agree vs. strongly disagree/disagree), weakened such calculations.
Conclusion
Conclusions can be drawn from the major findings above, in response to the two questions posed at the beginning of this article (see 'Introduction'). It is submitted that Major Findings 1, 2 and 3 above have provided an answer to Question 1, that is: The respondents believed that their L1 was valuable and relevant in their lives and society they live in. Even if they suggested that English dominated South Africa's linguistic landscape (Major Finding 4), as well as some shift towards English and Nguni languages in some domains (Major Finding 5), Setswana still had 'covert prestige' among them and they valued the language's instrumental value in their lives.
As mentioned in an earlier section (see 'Background'), Aziakpono (2007:4) submits that existing literature identified the following variables as factors influencing attitudes towards a language: (1) age (or age group); (2) schooling background;25 (3) gender; (4) year of study (or years at university); and (5) field of study. Like the surveys of (earliest to most recent publication of findings) Aziakpono (2007); Dalvit (2004) and Dyers (1999), this survey confirms that (1) age group; (2) years at university; (3) level of study; and (4) field of study were factors in influencing the respondents' attitudes towards Setswana (see Table 8). However, it did not show the statistically significant influence of gender the respondents' attitudes. This paragraph then answers Question 2, that is: from a statistical significance point of view, four out of five variables influenced the attitudes held by the respondents towards their L1, Setswana.
Contribution of the survey
The findings of this survey could be compared with those from previous studies, such as those of (earliest to most recent publication of findings): Aziakpono (2007); Dalvit (2004); Dyers (1999) and Hilton (2010) because in addition to exploring new phenomena - such as the cultural identity of a people, the Batswana, as well as the promotion and propagation of a BSAL, Setswana - it also explored the previously explored phenomenon of 'attitudes within the education space', which the mentioned researchers explored.
This survey's respondents were aged 18-35 years, that is, they were born in the years 1978 to 1995, and nearly 90% of them were aged 25 years and younger (i.e. they were born in the years 1988 to 1995). This means that an overwhelming majority of the respondents spent the majority of their lives in a democratic South Africa. The significance of this is that this survey was the first in the area of research to specifically target the respondents who did not spend the majority of their lives in apartheid South Africa; put differently they grew up in a country where racism was not legally institutionalised, thus their worldview would be different as compared to people who grew up in apartheid South Africa, and thus were respondents in surveys before this one.
Recommendation for future research
Language attitudes studies in South Africa have mainly focused on BSALs with bigger numbers of L1 speakers (e.g. isiXhosa). Thus, there is a need for research among L1 speakers of other BSALs. Such a need is even greater among BSALs with relatively smaller numbers of L1 speakers (viz. isiNdebele, Tshivenda; siSwati; and Xitsonga). Among others, such research should seek to compare their findings with those from previous studies, including this one.
Acknowledgements
The author wishes to express his sincere appreciation to the 247 respondents (university students) and management at the five Gauteng universities where this survey was conducted. He would also like to thank three academics who guided him through his doctoral journey as his supervisors: Prof. Charles C. Mann (mentor), Associate Prof. Linda van Huyssteen and Prof. Mashudu C. Mashige.
Competing interests
The author declares that he has no financial or personal relationship(s) which may have inappropriately influenced him in writing this article.
References
Aziakpono, P., 2007, 'The attitudes of isiXhosa-speaking students toward various languages of learning and teaching (LOLT) issues at Rhodes University', Master's dissertation, Rhodes University, South Africa. [ Links ]
Aziakpono, P. & Bekker, I., 2010, 'The attitudes of isiXhosa-speaking students toward the learning and teaching issues at Rhodes University, South Africa: General trends', Southern African Linguistics and Applied Language Studies 28(1), 39-60. https://doi.org/10.2989/16073614.2010.488442 [ Links ]
Bangeni, B. & Kapp, R., 2007, 'Shifting language attitudes in linguistically diverse learning environments in South Africa', Journal of Multilingual and Multicultural Development 28(4), 253-269. https://doi.org/10.2167/jmmd495.0 [ Links ]
Bekker, I., 2002, 'The attitudes of L1-African language students towards the LOLT issue at UNISA', Master's dissertation, University of South Africa, South Africa. [ Links ]
Beukes, A., 2004, 'The first ten years of democracy: Language policy in South Africa', Focus address delivered at the Xth Linguapax Congress on Linguistic Diversity, Sustainability and Peace, Barcelona, Spain, 20-23 May.
Bryman, A., 1988, Quantity and quality in social research, Unwin Hyman Ltd., London.
Cooper, R.L. & Fishman, J.A., 1974, 'The study of language attitudes', International Journal of the Sociology of Language 3, 5-19. [ Links ]
Dalvit, L., 2004, 'Attitudes of isiXhosa-speaking students at the University of Fort Hare towards the use of isiXhosa as a language of learning and teaching (LOLT)', Master's dissertation, Rhodes University, South Africa. [ Links ]
Dalvit, L. & De Klerk, V., 2005, 'Attitudes of Xhosa-speaking students at the University of Fort Hare towards the use of Xhosa as a language of learning and teaching (LOLT)', Southern African Linguistics and Applied Language Studies 23(1), 1-18. https://doi.org/10.2989/16073610509486371 [ Links ]
De Kadt, E., 2005, 'English, language shift and identities: A comparison between "Zulu-dominant" and "multicultural" students on a South African university campus', Southern African Linguistics and Applied Language Studies 23(1), 19-37. https://doi.org/10.2989/16073610509486372 [ Links ]
Dyers, C., 1999, 'Xhosa students' attitudes towards Black South African languages at the University of the Western Cape', South African Journal of African Languages 19(2), 73-82. [ Links ]
Edelstein, M.L., 1974, What do young Africans think? Labour & Community Consultants, Johannesburg.
Edwards, J., 1994, Multilingualism, Routledge, London.
Giles, H., Bourhis, R. & Taylor, D., 1977, 'Towards a theory of language in ethnic group relations', in H. Giles (ed.), Language, ethnicity and intergroup relations, pp. 305-345, Academic Press, London.
Hilton, N.H., 2010, 'University students' context-dependent conscious attitudes towards the official South African languages', Southern African Linguistics and Applied Language Studies 28(2), 123-132. https://doi.org/10.2989/16073614.2010.519109 [ Links ]
Mann, C.C., 2009, 'Attitudes toward Anglo-Nigerian Pidgin in urban, southern Nigeria: The generational variable', Romanian Review of Linguistics, LIV (3-4), 349-364. [ Links ]
Mutasa, D., 1999, 'Language policy and language practice in South Africa: An uneasy marriage', Language Matters: Studies in the Languages of Africa 30(1), 83-98. https://doi.org/10.1080/10228199908566146 [ Links ]
Ranamane, T.D., 2012, 'The contribution of the missionaries to the development of Setswana as a written language', South African Journal of African Languages 32(1), 27-33. [ Links ]
Smit, U., 1996, A new English for a new South Africa? Language attitudes, language planning and education, Braumüller, Vienna.
Vorster, J. & Proctor, L., 1976, 'Black attitudes to "white" languages in South Africa: A pilot study', The Journal of Psychology 92(1), 103-108. https://doi.org/10.1080/00223980.1976.9921341 [ Links ]
Zimbabwe, 2013, Constitution of Zimbabwe Amendment Act (No. 20 of 2013), Author, Harare.
 Correspondence:
Thabo Ditsele
ditsele@hotmail.com
Received: 21 Apr. 2016
Accepted: 13 Feb. 2017
Published: 28 June 2017
1 The doctoral study is titled Perceptions of Black South African languages: A survey of the attitudes of Setswana-speaking university students toward their first language (2014).
2 The first article was published in 2016 in the South African Journal of African Languages, 36(1), 1-13.
3 Previous surveys (e.g. Aziakpono 2007; Dalvit 2004; Dyers 1999) on language attitudes in South Africa have tested these variables.
4 Aziakpono (2007); Dalvit (2004) and Dyers (1999) focused on the year of study (e.g. second year), and not the number of years that the students had spent at university. This survey took a different approach; it focused on the number of years that the respondents had spent at university, regardless of their year of study. For convenience, year of study has been equated with years at university.
5 Dalvit and De Klerk (2005:10) grouped their respondents as follows: first; second; final; and postgraduate, while Aziakpono (2007:62) grouped them as follows: year 1; year 2; year 3; Honours; Master's; and PhD. Unlike them, level of study in this survey refers to two groups - under-graduate and post-graduate.
6 Setswana is a cross-border language spoken in southern Africa, and mainly in South Africa and Botswana. It is the most dominant language in the province of North West in South Africa, and in Botswana. It is also an official language in South Africa and Botswana. For further reading, see Ranamane (2012:27). According to Section 6 of the new and amended Constitution of Zimbabwe (Act 20 of 2013), Setswana is now one of the official languages in Zimbabwe.
7 In most literature in South Africa, the term 'African languages' is used to refer to the 'Southern Bantu languages' spoken in the country. Some researchers such as Dyers (1999) prefer to use the term 'Black South African languages', which is also the preferred term used in this survey.
8 Batswana (singular 'Motswana') could be: (1) citizens of Botswana, regardless of race, ethnicity, etc. or (2) L1 speakers of Setswana, regardless of citizenship, race, ethnicity, etc. The latter definition applies to this article.
9 While this study was conducted in 1972, Edelstein's book was published in 1974.
10 A linguistic reference to Black Africans who live mainly in East, Central and Southern Africa, and speak languages that are classified as 'Bantu languages'. However, in apartheid South Africa, 'Bantu' was a derogatory reference to a Black African. Mutasa (1999:83-84) uses 'Bantu languages' when he refers to BSALs.
11 South Africa became a democratic country in 1994, ending an era in which legislation separated people according to their race, in a system known as apartheid, which Beukes (2004:25) explains as an Afrikaans word which means 'keeping apart or separate'. For that reason, 1994 marked a new era in which race groups could freely mix.
12 Statistical data analysis was performed using SPSS software.
13 'Statistical significance' (p ≤ 0.05) means that a 'finding' made about the relationship between a 'variable' and a 'belief statement' in this survey, may be repeated in another survey if data were to be gathered from the same or similar population as this survey.
14 In this study, p ≤ 0.05 was used as a border between the data, which are statistically significant and what are not.
15 The limitation of this survey also applies to Botswana, a country with the second highest number of Setswana L1 speakers after South Africa.
16 See Appendix 3 for percentages, means, attitudinal positional tendencies and statistically-significant variables of Belief Statements 1, 2, 14 and 16.
17 The means appear in brackets for a proper context and/or to give more meaning to attitudinal positional tendencies. This applies to the rest of the article.
18 The 'variables' appear in brackets alongside groups for ease of reference. This applies to the rest of the article.
19 It is an abbreviation for 'Information and Communication Technology'.
20 See Appendix 3 for percentages, means, attitudinal positional tendencies and statistically-significant variables of Belief Statements 4, 7, 10 and 13.
21 See Appendix 3 for percentages, means, attitudinal positional tendencies and statistically-significant variables of Belief Statements 3, 6, 8 and 11.
22 See Appendix 3 for percentages, means, attitudinal positional tendencies and statistically significant variables of Belief Statements 5, 9, 12 and 15.
23 From 2014, the University of KwaZulu-Natal (UKZN) introduced a compulsory 'Communication in isiZulu' module to all first-year students who did not study isiZulu at Grade 12.
24 The scale was as follows: highest preference = 1 and lowest preference = 4.
25 This study did not test this variable.
Appendix 1

Appendix 2

Appendix 3

