


Services on Demand
Article
 English (pdf)
 Article in xml format
 Article references
Indicators

Related links
-
 Cited by Google
 -
 Similars in Google
Share

 Permalink
SA Journal of Radiology
On-line version ISSN 2078-6778
Print version ISSN 1027-202X
S. Afr. J. radiol. (Online) vol.28 n.1 Johannesburg 2024
http://dx.doi.org/10.4102/sajr.v28i1.2724
ORIGINAL RESEARCH
Our experience with liver and spleen elastography in the prediction of oesophageal varices
Shivali AryaI, II; Rashmi DixitI; Sneha Harish CI; Anjali PrakashI; Amarender S. PuriIII
IDepartment of Radiodiagnosis, Maulana Azad Medical College & Associated Lok Nayak Hospital, New Delhi, India
IIDepartment of Radiodiagnosis, Government Medical College, Chandigarh, India
IIIDepartment of Gastroenterology, Govind Ballabh Pant Hospital, New Delhi, India
ABSTRACT
BACKGROUND: Variceal bleeding is an important cause of mortality in patients with chronic liver disease (CLD). The gold standard for detection and grading of oesophageal varices (EV) is upper gastrointestinal endoscopy. However, it is expensive, time-consuming and invasive
OBJECTIVES: This study aimed to find any association between splenic shear wave velocity (SWV) measured by acoustic radiation force imaging (ARFI) and the presence of EV.
METHOD: The quasi-experimental study included 50 patients with CLD and 50 subjects without CLD as the control group. Both underwent upper abdominal ultrasonography followed by elastographic assessment on a Siemens Acuson S2000TM ultrasound system. A comparison of the findings was made between the control and patient groups.
RESULTS: Both groups had similar hepatic size while patients with CLD had larger splenic size and area (p < 0.05). The CLD patients had higher mean hepatic and splenic SWV compared with the control group (p < 0.05). The mean splenic size and splenic SWV were higher in patients with varices than in those without varices (p < 0.05).
CONCLUSION: Chronic liver disease causes significant increase in liver and splenic stiffness with splenic SWV values being higher for patients with varices emphasising the role of elastography as a non-invasive predictor for the presence of EVs. Splenic SWV had the highest sensitivity and specificity, which was augmented by a combination of hepatic and splenic SWV. Thus, splenic SWV alone or in combination with hepatic SWV is a useful technique for prediction of the presence of EVs.
CONTRIBUTION: This study aims to find an alternative non-invasive and cost-effective technique for screening of EV.
Keywords: oesophageal varices; acoustic radiation force imaging; chronic liver disease; shear wave velocity; splenic stiffness; hepatic stiffness.
Introduction
Chronic liver disease (CLD) in due course results in the development of liver fibrosis and portal hypertension. Oesophageal varices (EV) develop in 30% - 70% of patients with portal hypertension. Variceal bleeding is a life-threatening event with a mortality of approximately 10% - 20% per bleeding episode and a 1-year survival of about 63%.1,2,3,4 The gold standard for detection and grading of EV is upper gastrointestinal endoscopy (UGIE). Current guidelines require patients in a compensated stage of liver cirrhosis to undergo endoscopy to screen for EV.5 However, it is expensive, time-consuming and invasive. Hence, efforts have been made to find an alternative non-invasive and cost-effective technique for screening of EV.
Grey scale ultrasound imaging along with Doppler techniques are routinely used to aid in the diagnosis of CLD and portal hypertension. However, these techniques detect only morphological changes in the liver along with alteration in haemodynamics. Ultrasound elastography is a recent technique, which allows evaluation of tissue elasticity and hence, has an important role in evaluation of diseases such as CLD, which are associated with a change in tissue stiffness. Elastography can be broadly categorised as strain and Shear Wave Elastography. The latter is more useful for deep-seated structures and is of three types, including, 1D-Transient elastography (TE), point Shear Wave Elastography (pSWE) or Acoustic Radiation Force Impulse (ARFI) elastography, two-dimensional Shear Wave Elastography (2D-SWE). Although liver elastography is a good non-invasive method to detect liver stiffness (LS), biopsy is still the gold standard. For this reason, LS measured by elastography has made its way into the guidelines for diagnosis, stratification and classification of liver diseases. Several studies have been conducted correlating LS with portal hypertension and predicting the presence of EV.
Anatomically speaking, the splenic vein drains into the superior mesenteric vein to form the portal vein. Hence, it is directly connected to the portal vein. As a consequence, it can be presumed that any pathology affecting the blood flow in the portal vein can also affect the spleen. Many centres have focused on the use of splenic elastography in patients with liver disease, correlating splenic stiffness (SS) values with the stage of liver fibrosis.6 The spleen of cirrhotic patients is characterised by the presence of passive congestion, fibrotic hyperplasia, hyperactivated lymphoid tissue and angiogenesis. In the last few years, several studies have attempted to show that ultrasound based elastography using SS as a surrogate marker could accurately predict the presence of significant EV.
This study aimed to find any association between splenic shear wave velocity (SWV) measured by ARFI elastography and the presence of EV.
Materials and methods
This quasi-experimental study design included 50 patients over 18 years of age with CLD who were undergoing screening endoscopic examination and were referred for upper abdominal ultrasonography. Fifty subjects who presented to the department of radiology for ultrasonography for an unrelated pathology were also included in the study as the control group.
Exclusion criteria for the patient group were: patients with a history of varices, any hepatic or splenic surgical procedure, focal hepatic pathologies, focal or diffuse splenic pathologies except for the presence of Gamna-Gandy bodies, and pregnancy. Exclusion criteria for the control group were: past history of jaundice or hepatitis, incidentally detected splenic or hepato-biliary pathology on upper abdominal ultrasonography, history of substantial alcohol intake (> 30 g/daily for men, > 20 g/daily for women),7 any prior surgical procedure on the spleen or liver in the past, and pregnancy.
The study was conducted at our institute over a duration of 12 months from 01 September 2018 to 31 August 2019 after obtaining ethical clearance from the institutional ethical committee. The procedure was explained to the patients and written informed consent was obtained. Demographics of the study subjects such as age and sex were recorded.
The control group as well as the patient group underwent routine grey scale upper abdominal ultrasonography on the Siemens Acuson S2000TM ultrasound system (Siemens Medical Solutions, Mountain View, California, United States [US]) using a curvilinear array transducer (3 MHz-5 MHz) and a high frequency probe (5-17 MHz) for detailed evaluation when required.
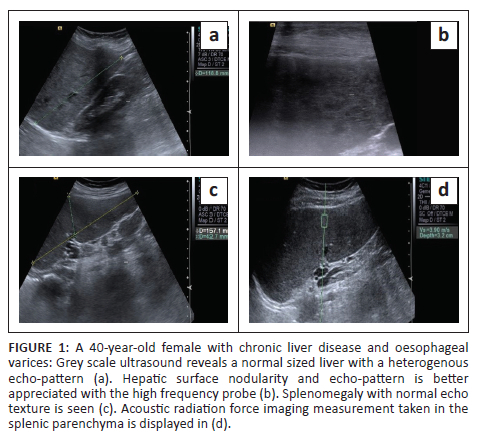
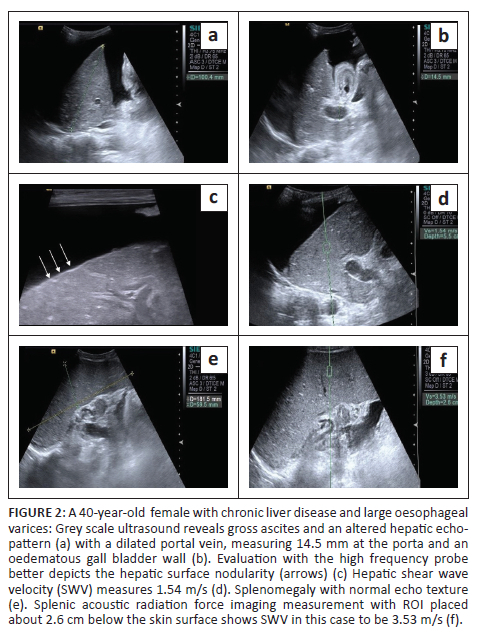
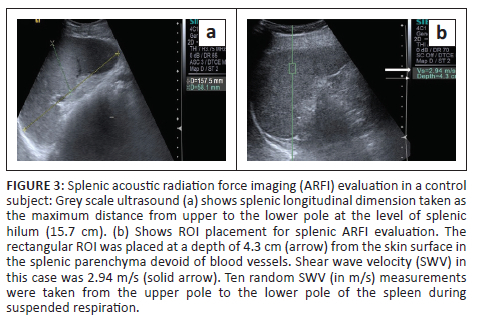
Liver size was measured as the maximum craniocaudal dimension in the midclavicular line. In addition, the presence of surface nodularity, caudate lobe hypertrophy and ascites was observed in the patient group (Figure 1 and Figure 2). Splenic bipolar diameter/longitudinal size was taken as maximum craniocaudal length at the level of splenic hilum. Splenic transverse diameter was taken in a plane orthogonal to the bipolar diameter (Figure 3). Splenic area was taken as the product of bipolar and transverse diameter as suggested by Loftus et al.8 and Ioanitescu ES9 in both the patient and control groups.
Following grey scale ultrasound examination, splenic and LS were evaluated using the ARFI based elastography technique in the patient and control groups:
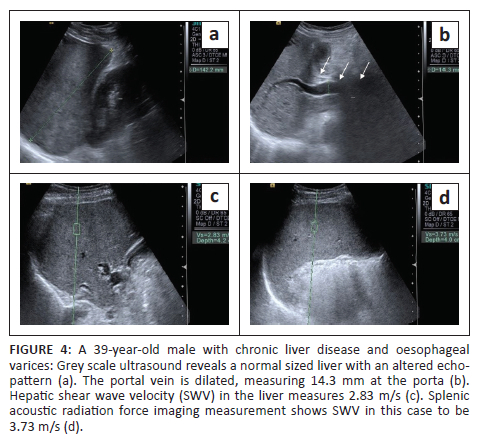
•Liver stiffness was evaluated using the ARFI enabled curvilinear transducer. A subcostal approach was used with subjects lying in the supine position and the right arm in maximum abduction behind the head. The scan was performed after 6 h of fasting and during the acquisition of SWV, the subjects were requested to hold their breath for 5 s. A region of interest (ROI) (10 mm2 × 6 mm2) was placed in the right lobe of liver at least 1 cm - 2 cm below the liver capsule (Figure 4). Special attention was paid to avoid any vessels, and rib shadows or artefacts from nearby lung, bowel or cardiac movements. Five SWV (in m/s) measurements were taken randomly throughout right lobe parenchyma. The mean and median values were calculated for both the patient and control groups.
•Splenic stiffness was measured with subjects lying in the right lateral decubitus position with the left arm in maximum abduction in order to increase the intercostal acoustic window. The procedure was similar to liver elastography with the scan performed in breath hold. The ROI was placed in the splenic parenchyma at least 1 cm - 2 cm below the splenic capsule (Figure 1 to Figure 4). Ten SWV (in m/s) measurements were taken randomly throughout the splenic parenchyma. The mean and median values were calculated for the patient and control groups.
Patients with CLD underwent UGIE within 4 weeks of the ARFI evaluation. Endoscopic findings regarding the presence and type of EVs were recorded. Oesophageal varices were classified according to the international expert recommendations into three groups:
•Patients without EVs
•Patients with small EVs (diameter of less than 5 mm)
•Patients with large varices (diameter greater than 5 mm)
Correlation of hepatic size, splenic size and splenic area was performed between (1) the patient and control groups and (2) patients without and with varices. Hepatic and splenic SWV were similarly compared between these two groups. Receiver operating characteristic (ROC) curves were drawn to obtain the cut-off values of hepatic and splenic SWV to predict the presence of EVs in patients with CLD.
Statistical analysis
The collected data were transformed into variables, coded and entered in Microsoft Excel. Data were analysed and statistically evaluated using Statistical Package for Social Sciences (SPSS)-PC-25 version. The Kolmogorov-Smirnov test was used to see the normality distribution of data. Quantitative data were expressed as mean, standard deviation and the difference between two comparable groups, tested by the student's t-test (unpaired) or Mann-Whitney 'U' test, while qualitative data were expressed as percentages. A p-value less than 0.05 was considered statistically significant. Receiver operating characteristic curves were drawn to determine the cut-off values for splenic length, splenic area, hepatic and splenic SWV based on which sensitivity, specificity, positive predictive value (PPV) and negative predictive values (NPV) were calculated. The Spearman's rank correlation coefficient (non-parametric) was used to determine correlations between different quantitative variables.
Ethical considerations
The study was conducted at our institution after obtaining ethical clearance from the Institutional Ethical Committee of Maulana Azad Medical College (F.No.17/IEC/MAMC/2018/15) 26 October 2018.
Results
The final study sample included 100 participants. The 50 volunteers in the control group had a mean age of 32.56 ± 12.74, and a median age of 28 years. There were 26 (52%) males and 24 (48%) females in this group. The mean and median age of the 50 participants in the patient group was 41.36 ± 13.39 and 42 years, respectively. There were 30 (60%) males and 20 (40%) females in the patient group.
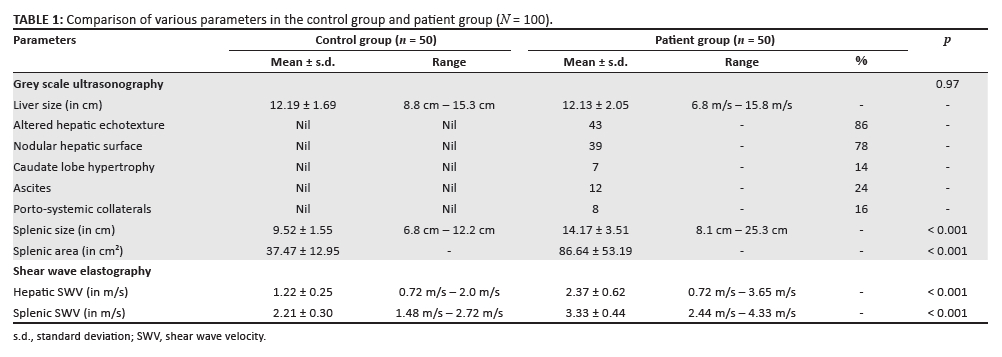
The liver size, splenic size and splenic area measurements in both the groups are presented in Table 1. While liver size was quite similar in the two groups, splenic size and splenic area were higher in the patient group and this difference was found to be statistically significant (p < 0.001).
The elastography findings of the liver and spleen in both groups are also presented in Table 1. Both the hepatic and splenic SWVs were significantly higher in the patient group than in the control group with p < 0.001.
On calculation of Spearman's correlation coefficient for the control group, hepatic SWV appeared to have no significant correlation with age (r = 0.179) or liver size (r = 0.025). Similarly, no significant correlation of splenic SWV with age (r = 0.482), splenic size (r = 0.441) or with splenic area (r = 0.394) was noticed. In the patient group, hepatic SWV was found to have no significant correlation with age (r = 0.115, p = 0.426) or liver size (r = 0.025). On calculation of Spearman's correlation coefficient, splenic SWV was found to have no significant correlation with age (r = 0.00), splenic size (r = 0.191) or with splenic area (r = 0.253).
Patients underwent UGIE within 4 weeks of the ARFI evaluation. Upon endoscopic evaluation, it was found that 10/50 patients (20%), had no EVs and 40/50 patients (80%), showed evidence of either small or large EVs, 20 in each category. Table 2 displays the important differences in grey scale and SWV findings in patients with and without varices.
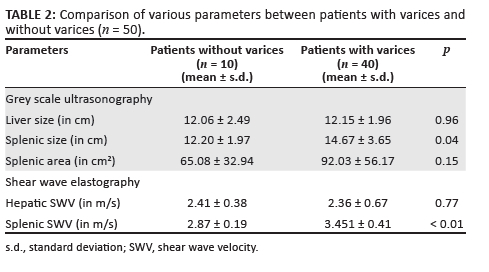
Both the liver size and hepatic SWV were quite similar between the two subgroups. While both the splenic size and splenic area were higher in the patients with varices, this difference achieved statistical significance only for the splenic size. There was a statistically significant difference in the splenic SWV between the two groups (p < 0.01).
Discussion
The idea of a non-invasive radiological investigation that allows for the assessment of patients with a high risk of developing varices, and consequently limits the number of patients undergoing invasive UGIE, is very attractive. Previous studies have correlated various radiological and laboratory parameters, either alone or in combination, with the presence or absence of EVs in patients with CLD.
The use of non-invasive techniques such as elastography for the evaluation of LS and of late, SS, has become popular. Recent literature has also described their usefulness in the assessment of CLD and prediction of risk for EVs.5,6,10,11,12,13,14,15,16,17,18,19,20 Elastography techniques can be classified as strain imaging (SI) and shear wave imaging (SWI) depending on the measured physical quantity. A normal stress is applied to tissue and the normal strain is measured in SI whereas a dynamic stress is applied to tissue by using a mechanical vibrating device or acoustic radiation force in SWI. Shear wave elastography determines the mechanical properties of tissues by monitoring the speed of shear waves generated by the ultrasound-induced acoustic radiation force.12
Shear wave elastography allows real-time visualisation of the organ, allowing accurate placement of the ROI for measurement of elastographic values. Another advantage is that it can be performed during routine ultrasonographic examination of the hepatobiliary system and hence can be easily incorporated in the routine follow-up of patients with cirrhosis. In this study we assessed the SS in patients of CLD and its association with EV using pSWE.
On comparing the grey scale ultrasonographic findings between the patient and control groups, we found that both groups were similar in terms of mean hepatic size. The patient group, however, had a statistically significant larger splenic size (14.17 ± 3.51 vs 12.20 ± 1.97) and splenic area (86.64 ± 53.19 vs 37.47 cm2 ± 12.95 cm2) compared with control group (p < 0.001). Although initially splenic enlargement in patients with CLD was largely attributed to portal congestion, several studies have demonstrated that the pathophysiology is more complex, and splenomegaly has a congestive and a hyperplastic component.21 Increased activation of the mammalian target of rapamycin (mTOR) signalling pathway has also been observed as a cause of splenomegaly according to one of the studies.22
The mean hepatic size was similar in patients with and without varices (12.15 cm ± 1.96 cm vs 12.06 cm ± 2.49 cm). This is in contrast to the findings of a previous study by Nouh et al.,23 who found the liver to be shrunken in patients with varices with the mean right lobe of the liver spanning 12.63 cm ± 1.16 cm and 14.04 cm ± 1.13 cm in patients with and without varices, respectively. This discrepancy could be because of the difference in sample sizes between the two studies as the authors evaluated a larger number of patients (n = 200) as well as a larger number of patients with advanced cirrhosis, with 54.5% of patients having bleeding EV. This contrasts with the current study where patients displayed varying grades of CLD. Sharma and Aggarwal also reported similar findings in their study;24 however, their patients displayed relatively severe disease with ascites and a history of hepatic encephalopathy in 80% and 39% of subjects, respectively, compared with 24% patients with ascites in this study and none with a history of hepatic encephalopathy.
The mean splenic size was significantly higher in patients with varices than in those without varices (14.67 cm ± 3.65 cm vs 12.20 cm ± 1.97 cm, p = 0.04). This finding concurs with previous studies that have also reported significantly larger splenic sizes in patients with varices than in those without varices.25,26,27 Even though the mean splenic area too was larger in patients with varices than in those without varices, no statistically significant difference was observed between the subgroups (p = 0.15). Using a splenic length cut-off value of 15.1 cm for the prediction of EV in the patients of CLD, we obtained a specificity (Sp) of 100%, although the sensitivity (Sn) was only 50%.
Ultrasound elastography assessment of the liver and spleen revealed that patients with CLD had significantly higher SWV values for both organs as compared with the controls (p < 0.001). These findings are in concordance with the outcomes of a previous study,28 in which an alteration in the elasticity of the hepatic and splenic parenchyma was observed in patients with CLD with the LS measuring 2.50 m/s ± 0.80 m/s and 0.91 m/s ± 0.29 m/s in patients and controls, respectively, (p < 0.001). The SS was also significantly higher among patients compared with controls (3.14 ± 0.80 vs 1.89 ± 0.26, respectively, p < 0.001). Although the exact values in the current study were higher, the general trend was similar in both studies.
There was no statistically significant correlation between the hepatic SWV of patients with and without varices (2.41 m/s ± 0.38 m/s v. 2.36 ± 0.67, p = 0.77) consistent with the findings of some of the previous studies.29,30 However, there have been studies that have found a correlation between LS and the presence and severity of EVs.31,32 Similarly, some authors also found that LS can predict the presence of poor prognostic factors such as EV in patients with liver cirrhosis.27,33
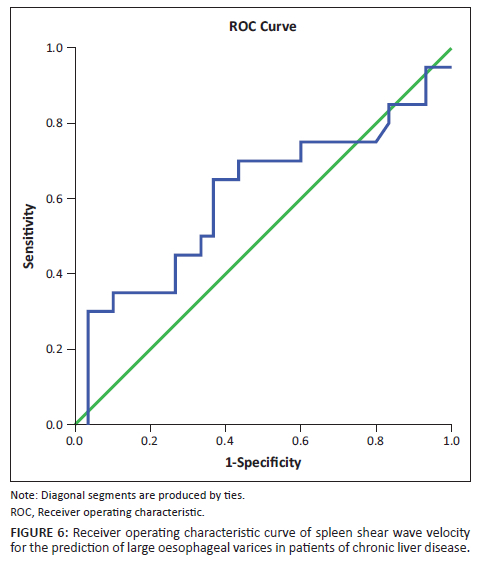
On the other hand, the mean splenic SWV in patients with varices was significantly higher than in patients without varices (3.451 m/s ± 0.41 m/s vs 2.87 m/s ± 0.19 m/s, p < 0.01). This is consistent with the findings of several previous studies.33,34,35,36,37,38 Park Y et al., in their study found the mean SWVs to be 2.39 m/s ± 0.67 m/s, 2.19 m/s ± 0.73 m/s and 1.64 m/s ± 0.57 m/s, respectively, in patients with high risk, low risk and no EVs.37 Although the absolute values are lower than in this study, the general trend is similar between the two studies. The ROC curves of splenic SWV for the prediction of EVs in patients with CLD have been depicted in Figure 5 and Figure 6. This emphasises the non-invasive role of splenic elastography in the prediction of EVs. As the number of patients in each group was relatively small, we did not attempt to compare the findings between patients with small and large varices.
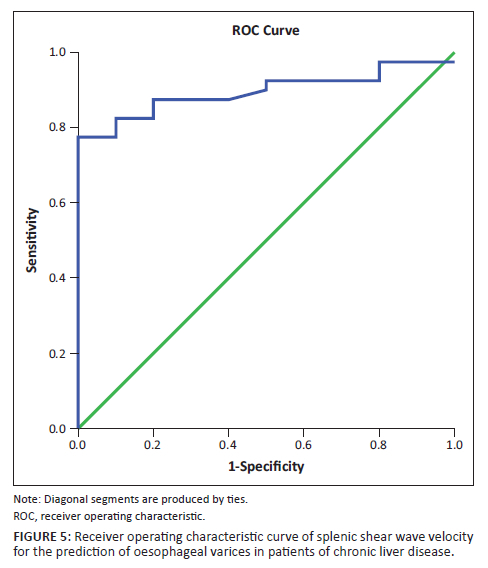
The authors attempted to determine cut-off values for elastographic parameters such as hepatic SWV, splenic SWV and a combination of the same to determine the presence of varices using ROC curves. In this study, a cut-off value of 2.608 m/s was obtained for hepatic SWV with a sensitivity (Sn) of 37.5%, specificity (Sp) of 80%, NPV of 24.2% and PPV of 88.3% for prediction of EV in patients with an accuracy of 47%. Similarly, a cut-off value of 3.13 m/s was obtained for splenic SWV with a Sn of 77.5%, Sp of 100%, NPV of 52.6% and PPV of 100% for prediction of EV in patients with an accuracy of 89%. The area under curve (AUC) was much greater for splenic SWV than hepatic SWV (0.89 vs. 0.47), confirming higher accuracy of splenic SWV in predicting EV in patients with CLD. This was in concordance with the meta-analysis performed by Manatsathit W et al.,39 who reported a Sn of 90%, Sp of 73% for the splenic SWV and inferred that SS was superior to LS (AUC 0.89 vs. 0.85) for the detection of EV. Furthermore, AUC was greater for the combination of splenic and hepatic SWV than splenic SWV alone with a combined Sn of 82.5%, Sp of 100%, PPV 100%, NPV 58.8% suggesting that it is even more accurate for the prediction of EV. Thus, use of this combination may be superior to splenic SWV alone for prediction of EVs.
This study had a few limitations including the relatively small sample size. Although we included 50 patients, the number of patients included in each sub-group, and the number of patients with and without varices, and with small and large varices, were relatively small. Hence, we could not assess the usefulness of splenic elastography in patients with small and large EVs. Further studies with larger number of patients may help in the validation of this parameter as a predictor of large EV. Additionally, the control group, although equal in number to the patient group, was not age and sex matched.
Conclusion
Chronic liver disease causes a significant increase in the stiffness of the liver and spleen with SWV values for the spleen being higher for patients with varices emphasising the role of elastography as a non-invasive predictor for the presence of EVs. Among all the individual radiological parameters evaluated in this study, splenic SWV had the highest sensitivity and specificity, which was further augmented by a combination of hepatic and splenic SWV. This study found that splenic SWV alone or in combination with hepatic SWV is a useful non-invasive technique for the prediction of presence of EVs.
Acknowledgements
Competing interests
The authors declare that they have no financial or personal relationship(s) that may have inappropriately influenced them in writing this article.
Authors' contributions
S.A., R.D., S.H.C., A.P. and A.S.P. have contributed to the conceptualisation of the study design, literature research, performance of the study, data collection and analysis, statistical analysis and manuscript preparation.
Funding information
The authors received no financial support for the research, authorship, and/or publication of this article.
Data availability
Data supporting the findings of this study are available from the corresponding author, S.H.C., on request.
Disclaimer
The views and opinions expressed in this article are those of the authors and do not necessarily reflect the official policy or position of any affiliated agency of the authors.
References
1.D'amico G, Criscuoli V, Fili D, Mocciaro F, Pagliaro L. Meta-analysis of trials for variceal bleeding. Hepatology. 2002;36(4 Pt 1):1023-1024. https://doi.org/10.1053/jhep.2002.34737 [ Links ]
2.Carbonell N, Pauwels A, Serfaty L, Fourdan O, Lévy VG, Poupon R. Improved survival after variceal bleeding in patients with cirrhosis over the past two decades. Hepatology. 2004;40(3):652-659. https://doi.org/10.1002/hep.20339 [ Links ]
3.Stokkeland K, Brandt L, Ekbom A. Improved prognosis for patients hospitalized with esophageal varices in Sweden 1969-2002. Hepatology. 2006;43(3):500-505. https://doi.org/10.1002/hep.21089 [ Links ]
4.Albillos A. Preventing first variceal hemorrhage in cirrhosis. J Clin Gastroenterol. 2007;41:S305-S311. https://doi.org/10.1097/MCG.0b013e318150d3c6 [ Links ]
5.Kim HY, Jin EH, Kim W, et al. The role of spleen stiffness in determining the severity and bleeding risk of esophageal varices in cirrhotic patients. Medicine (Baltimore). 2015 Jun;94(24):e1031. https://doi.org/10.1097/MD.0000000000001031 [ Links ]
6.Colecchia A, Montrone L, Scaioli E, et al. Measurement of spleen stiffness to evaluate portal hypertension and the presence of esophageal varices in patients with HCV related cirrhosis. Gastroenterology. 2012;143(3):646-654. https://doi.org/10.1053/j.gastro.2012.05.035 [ Links ]
7.De Franchis R, Baveno VF. Revising consensus in portal hypertension: Report of the Baveno V consensus workshop on methodology of diagnosis and therapy in portal hypertension. J Hepatol. 2010;53(4):762-768. https://doi.org/10.1016/j.jhep.2010.06.004 [ Links ]
8.Loftus WK, Chow LT, Metreweli C. Sonographic measurement of splenic length: Correlation with measurement at autopsy. J Clin Ultrasound. 1999 Feb;27(2):71-74. https://doi.org/10.1002/(SICI)1097-0096(199902)27:2%3C71::AID-JCU4%3E3.0.CO;2-U [ Links ]
9.Ioanitescu ES, Weskott HP. Ultrasound of the spleen. In: Dietrich CF, editor. EFSUMB course book. 2nd ed. London, UK: European Federation of Societies for Ultrasound in Medicine and Biology (EFSUMB); 2020, p. 4. [ Links ]
10.Stefanescu H, Grigorescu M, Lupsor M, Procopet B, Maniu A, Badea R. Spleen stiffness measurement using Fibroscan for the noninvasive assessement of esophageal varicose in liver cirrhosis patients. J Gastroenterol Hepatol. 2011;26(1):164-170. https://doi.org/10.1111/j.1440-1746.2010.06325.x [ Links ]
11.Calvaruso V, Di Marco V, Bronte F, et al. Spleen stiffness correlates with portal hypertension and increases the accuracy of detection of esophageal varices in HCV cirrhosis. J Hepatol. 2010;52(Suppl. 1):S159-S160. https://doi.org/10.1016/S0168-8278(10)60390-X [ Links ]
12.Bota S, Sporea I, Sirli R, et al. Spleen assessment by Acoustic Radiation Force Impulse Elastography (ARFI) for prediction of liver cirrhosis and portal hypertension. Med Ultrason. 2010;12(3):213-217. [ Links ]
13.Sharma P, Kirnake V, Tyagi P, et al. Splenic stiffness in patients with cirrhosis in predicting esophageal varices. Am J Gastroenterol. 2013;108(7):1101-1107. https://doi.org/10.1038/ajg.2013.119 [ Links ]
14.Fraquelli M, Guinta M, Pozzi R, et al. Feasibility and reproducibility of spleen transient elastography and its role in combination with liver transient elastography for predicting the severity of chronic viral hepatitis. J Viral Hepat. 2014 Feb;21(2):90-98. https://doi.org/10.1111/jvh.12119 [ Links ]
15.Singh S, Eaton JE, Murad MH, Tanaka H, Iijima H, Talwalkar JA. Accuracy of splenic stiffness measurement in detection of esophageal varices in patients with chronic liver disease: Systematic review and meta-analysis. Clin Gastroenterol Hepatol. 2014;12(6):935-945. https://doi.org/10.1016/j.cgh.2013.09.013 [ Links ]
16.Vermehren J, Polta A, Zimmermann O, et al. Comparison of acoustic radiation force impulse imaging with transient elastography for the detection of complications in patients with cirrhosis. Liver Int. 2012;32(5):852-858. https://doi.org/10.1111/j.1478-3231.2011.02736.x [ Links ]
17.Ye XP, Ran HT, Cheng J, et al. Liver and spleen stiffness measured by acoustic radiation force impulse elastography for noninvasive assessment of liver fibrosis and esophageal varices in patients with chronic hepatitis B. J Ultrasound Med. 2012 Aug;31(8):1245-1253. https://doi.org/10.7863/jum.2012.31.8.1245 [ Links ]
18.Takuma Y, Nouso K, Morimoto Y, et al. Measurement of splenic stiffness by acoustic radiation force impulse imaging identifies cirrhotic patients with esophageal varices. Gastroenterology. 2013;144(1):92-101. https://doi.org/10.1053/j.gastro.2012.09.049 [ Links ]
19.Rizzo L, Attanasio M, Pinzone MR, et al. A new sampling method for spleen stiffness measurement based on quantitative acoustic radiation force impulse elastography for noninvasive assessment of esophageal varices in newly diagnosed HCV-related cirrhosis. BioMed Res Int. 2014;2014:365982. https://doi.org/10.1155/2014/365982 [ Links ]
20.Takuma Y, Nouso K, Morimoto Y, et al. Portal hypertension in patients with liver cirrhosis: Diagnostic accuracy of splenic stiffness. Radiology. 2015;279(2):609-619. https://doi.org/10.1148/radiol.2015150690 [ Links ]
21.Bolognesi M, Merkel C, Sacerdoti D, Nava V, Gatta A. Role of spleen enlargement in cirrhosis with portal hypertension. Dig Liver Dis. 2002 Feb 1;34(2):144-150. https://doi.org/10.1016/S1590-8658(02)80246-8 [ Links ]
22.Li L, Duan M, Chen W, et al. The spleen in liver cirrhosis: Revisiting an old enemy with novel targets. J Transl Med. 2017 Dec;15(1):111. https://doi.org/10.1186/s12967-017-1214-8 [ Links ]
23.Nouh MA, El-Hamouly MS, Mohamed SA, Metwally AY. Right liver lobe diameter/serum albumin ratio in the prediction of esophageal varices in cirrhotic patients. Menoufia Med J. 2019 Jul 1;32(3):1113. https://doi.org/10.4103/mmj.mmj_73_19 [ Links ]
24.Sharma SK, Aggarwal R. Prediction of large esophageal varices in patients with cirrhosis of the liver using clinical, laboratory and imaging parameters. J Gastroenterol Hepatol. 2007 Nov;22(11):1909-1915. https://doi.org/10.1111/j.1440-1746.2006.04501.x [ Links ]
25.Mandal L, Mandal SK, Bandyopadhyay D, Datta S. Correlation of portal vein diameter and splenic size with gastro-oesophageal varices in cirrhosis of liver. J Ind Acad Clin Med. 2011 Oct;12(4):266-270. [ Links ]
26.Sheth SG, Amarapurkar DN, Chopra KB, Mani SA, Mehta PJ. Evaluation of splenomegaly in portal hypertension. J Clin Gastroenterol. 1996 Jan 1;22(1):28-30. https://doi.org/10.1097/00004836-199601000-00008 [ Links ]
27.Kim TY, Kim TY, Kim Y, Lim S, Jeong WK, Sohn JH. Diagnostic performance of shear wave elastography for predicting esophageal varices in patients with compensated liver cirrhosis. J Ultrasound Med. 2016 Jul;35(7):1373-1381. https://doi.org/10.7863/ultra.15.07024 [ Links ]
28.Ahmed OA, Elhossary YA, Hamid RS, Khalifa MO. Measurement of liver and spleen stiffness by acoustic radiation force impulse elastography for noninvasive detection of esophageal varices in Egyptian cirrhotic patients. Egypt J Intern Med. 2019 Jan 1;31(1):78. https://doi.org/10.4103/ejim.ejim_62_18 [ Links ]
29.Mori K, Arai H, Abe T, et al. Spleen stiffness correlates with the presence of ascites but not esophageal varices in chronic hepatitis C patients. Biomed Res Int. 2013;2013:857862. https://doi.org/10.1155/2013/857862 [ Links ]
30.Park J, Kwon H, Cho J, et al. Is the splenic stiffness value acquired using acoustic radiation force impulse (ARFI) technology predictive of the presence of esophageal varices in patients with cirrhosis of various etiologies? Med Ultrason. 2016;18(1):11-17. https://doi.org/10.11152/mu.2013.2066.181.sf [ Links ]
31.Bota S, Sporea I, Sirli R, et al. Can ARFI elastography predict the presence of significant esophageal varices in newly diagnosed cirrhotic patients? Ann Hepatol. 2012 Jul 29;11(4):519-525. https://doi.org/10.1016/S1665-2681(19)31466-8 [ Links ]
32.Hristov B, Andonov V, Doykov D, et al. Evaluation of liver stiffness measurement by means of 2D-SWE for the diagnosis of esophageal varices. Diagnostics. 2023 Jan;13(3):356. https://doi.org/10.3390/diagnostics13030356 [ Links ]
33.Zhang Y, Mao DF, Zhang MW, Fan XX. Clinical value of liver and spleen shear wave velocity in predicting the prognosis of patients with portal hypertension. World J Gastroenterol. 2017 Dec 12;23(45):8044. https://doi.org/10.3748/wjg.v23.i45.8044 [ Links ]
34.Şirli R, Sporea I, Popescu A, Dănilă M. Ultrasound-based elastography for the diagnosis of portal hypertension in cirrhotics. World J Gastroenterol. 2015 Nov 11;21(41):11542. https://doi.org/10.3748/wjg.v21.i41.11542 [ Links ]
35.Peagu R, Săraru R, Necula A, Moldoveanu A, Petrişor A, Fierbinţeanu-Braticevici C. The role of spleen stiffness using ARFI in predicting esophageal varices in patients with Hepatitis B and C virus-related cirrhosis. Rom J Intern Med. 2019 Dec 1;57(4):334-340. https://doi.org/10.2478/rjim-2019-0017 [ Links ]
36.Mazur R, Celmer M, Silicki J, Hołownia D, Pozowski P, Międzybrodzki K. Clinical applications of spleen ultrasound elastography - A review. J Ultrason. 2018 Mar 30;18(72):37-41. https://doi.org/10.15557/JoU.2018.0006 [ Links ]
37.Park Y, Kim SU, Park SY, et al. A novel model to predict esophageal varices in patients with compensated cirrhosis using acoustic radiation force impulse elastography. PLoS One. 2015 Mar 31;10(3):e0121009. https://doi.org/10.1371/journal.pone.0121009 [ Links ]
38.Heo JY, Kim BK, Park JY, et al. Multicenter retrospective risk assessment of esophageal variceal bleeding in patients with cirrhosis: An acoustic radiation force impulse elastography-based prediction model. Gut Liver. 2019 Mar;13(2):206. https://doi.org/10.5009/gnl18292 [ Links ]
39.Manatsathit W, Samant H, Kapur S, et al. Accuracy of liver stiffness, spleen stiffness, and LS-spleen diameter to platelet ratio score in detection of esophageal varices: Systemic review and meta-analysis. J Gastroenterol Hepatol. 2018 Oct;33(10):1696-1706. https://doi.org/10.1111/jgh.14271 [ Links ]
 Correspondence:
Sneha Harish C
snehaharishc@gmail.com
Received: 27 May 2023
Accepted: 16 Nov. 2023
Published: 25 Jan. 2024

