


Services on Demand
Article
 English (pdf)
 Article in xml format
 Article references
Indicators

Related links
-
 Cited by Google
 -
 Similars in Google
Share

 Permalink
SA Journal of Radiology
On-line version ISSN 2078-6778
Print version ISSN 1027-202X
S. Afr. J. radiol. (Online) vol.20 n.2 Johannesburg 2016
http://dx.doi.org/10.4102/sajr.v20i2.1019
REVIEW ARTICLE
Cardiovascular magnetic resonance frontiers: Tissue characterisation with mapping
Rebecca SchofieldI; Anish BhuvaI; Katia ManachoI; James C. MoonI, II
IBarts Heart Centre, St Bartholomews Hospital, London, United Kingdom
IIInstitute of Cardiovascular Science, University College London, United Kingdom
ABSTRACT
The clinical use of cardiovascular magnetic resonance (CMR) imaging has expanded rapidly over the last decade. Its role in cardiac morphological and functional assessment is established, with perfusion and late gadolinium enhancement (LGE) imaging for scar increasingly used in day-to-day clinical decision making. LGE allows a virtual histological assessment of the myocardium, with the pattern of scar suggesting disease aetiology, and the extent of predicting risk. However, even combined, the full range of pathological processes occurring in the myocardium are not interrogated. Mapping is a new frontier where the intrinsic magnetic properties of heart muscle are measured to probe further. T1, T2 and T2* mapping measures the three fundamental tissue relaxation rate constants before contrast, and the extracellular volume (ECV) after contrast. These are displayed in colour, often providing an immediate appreciation of pathology. These parameters are differently sensitive to pathologies. Iron (cardiac siderosis, intramyocardial haemorrhage) makes T1, T2 and T2* fall. T2 also falls with fat infiltration (Fabry disease). T2 increases with oedema (acute infarction, takotsubo cardiomyopathy, myocarditis, rheumatological disease). Native T1 increases with fibrosis, oedema and amyloid. Some of these changes are large (e.g. iron, oedema, amyloid), others more modest (diffuse fibrosis). They can be used to detect early disease, distinguish aetiology and, in some circumstances, guide therapy. In this review, we discuss these processes, illustrating clinical application and future advances.
Introduction
Cardiac imaging has focussed on the assessment of myocardial function, cardiac morphology, valves and coronary artery disease. Assessment of cardiac fibrosis and infiltration was the domain of histopathology. Late gadolinium enhanced (LGE) imaging by cardiovascular magnetic resonance (CMR) changed this. The identification of infarcted myocardium and its transmural extent became possible, which was the first in vivo histological assessment of the myocardium, representing a turning point in our approach to myocardial disease. However, it was rapidly realised that LGE was also visible in most other diseases, such as cardiomyopathies and infiltrative diseases. The patterns and location of LGE could aid diagnosis, whilst the extent was prognostic. LGE made a major difference to clinical care in many areas. However, there are limitations: scar is a final common pathway in many conditions and largely irreversible - it is the remote myocardium where the potential to modify disease lies. The LGE technique misses diffuse fibrosis and provides no information about how non-scarred myocardium is adapting or the risk of future scar. The LGE technique also fails to adequately distinguish acute oedema from chronic scar, and many dozens of other pathologies are completely missed (all cellular processes, and most exogenous processes such as infiltration by iron or fat).
Mapping is a new approach. Here, the three intrinsic magnetic relaxation properties of the myocardium are measured (T1, T2, T2*) for every image pixel and the absolute values displayed as a colour map with no need for subsequent processing. This represents a major change from the past when imaging used to be 'weighted' so that areas of higher T1 or T2 would appear brighter. This was useful for regional heterogeneity (myocarditis, sarcoid, infarction), but values could not be compared between individuals or tracked in the same individual over time. Diffuse processes were missed. However, mapping changed this situation. The differences from normal in some diseases are large and clinical utilities are wide and potentially diverse, including early diagnosis, detection of phenotypes, new diseases, prognostication and therapy monitoring.
Mapping subtypes: Technical
T1 mapping
Native T1 mapping (performed prior to contrast administration) has great promise. T1 mapping sequences require three components: (1) a saturation or inversion recovery preparation pulse; (2) the collection of 6 to 10 images at different times post preparation pulse; and (3) curve fitting to derive a T1 value for every image pixel. This is done in a single breath-hold. Many of the initial challenges are now solved and the accuracy and precision of the test is good for test indications with large pathological changes, although more is needed for some indications, particularly diffuse fibrosis. Standardisation is also needed as T1 measures differently in different scanners and set-ups, so local reference ranges are needed.1 Partial voluming of the myocardium from the blood pool remains a valid concern regarding accuracy. Progress is being made with an initial consensus statement2 and several planned quality control phantom systems.
T2 mapping
Absolute T2 values are sensitive for oedema and thus helpful in assessment of myocarditis, Takotsubo cardiomyopathy, acute myocardial infarction (MI), sarcoidosis, allograft rejection and rheumatological disease. To generate a T2 map, the same principles as T1 apply, but this time with sampling of the T2 recovery curve, usually with three images.
T2*mapping
The most established use of parametric mapping is T2* imaging. It revolutionised the diagnosis and quantification of cardiac siderosis and routinely guides therapy. It can be used to detect myocardial haemorrhage and it can utilise the difference in the magnetic state of oxyhaemoglobin (diamagnetic) and deoxyhaemoglobin (paramagnetic) in blood oxygen level dependent (bold>) imaging. Mapping removes the need for post processing. T2* is much less scanner dependent and is more robust.
Extracellular volume fraction (ECV) mapping
Measuring the myocardial interstitium is becoming easier with progressive simplification. Initial multi-breath-hold FLASH techniques were replaced by T1 maps pre and post-contrast (administered as a bolus followed by infusion or with scanning performed at several time points).3 This procedure is now replaced by a single pre- and single post-contrast T1 map.4These images can now be combined into an ECV map.5 Most recently, a synthetic ECV map can be automatically generated during scanning, in which the haematocrit (Hct) of blood is inferred from the T1 of the blood pool (as the relationship between Hct and R1 {1/blood T1} is linear), removing the need for a blood test.6 ECV quantification is less field and sequence sensitive than native T1 mapping but ECV standardisation is ongoing.
Clinical utility
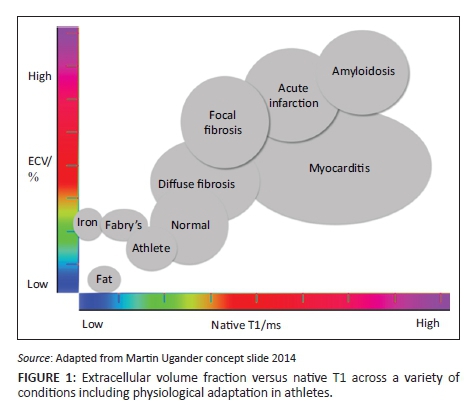
As previously mentioned, T1 maps show elevated T1 values in amyloid, oedema and fibrosis and shortened values in lipid accumulation and iron deposition. T2 values are elevated in the presence of oedema and T2* is exquisitely sensitive for myocardial iron and haemorrhage. ECV maps allow quantification of the ECV which increases in fibrosis, oedema and infiltrative processes (Figure 1).
Acute myocardial infarction
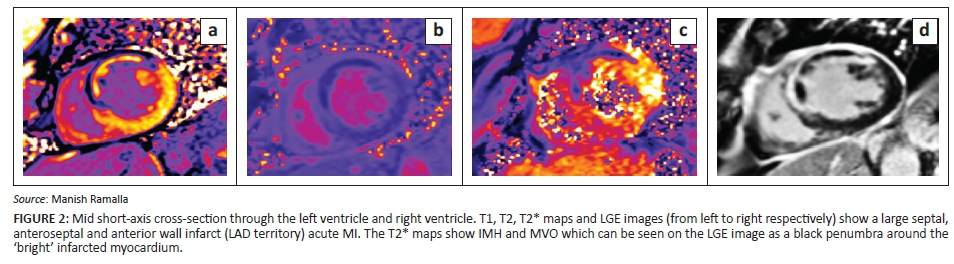
Not every MI is the same and mapping helps to decode why this is so. Patient profiles, ischaemic time and revascularisation methods, presence of microvascular obstruction (MVO) causing no-reflow, intramyocardial haemorrhage (IMH), oedema and myocardial necrosis are some of the variables at play. Post MI CMR imaging can identify MVO, intramyocardial haemorrhage (IMH), infarct size and oedema, all of which have prognostic implications for left ventricle (LV) remodelling. Mapping provides a window into the remodelling process.
Recent work has shown that acute IMH leads to chronic iron deposition which may be a source of ongoing inflammation as T2 values around the iron remained high. In addition, remote myocardial raised T1 and ECV were predictive of adverse remodelling. In addition, procedural percutaneous coronary intervention (PCI)-related micro-infarcts are detectable using LGE CMR imaging7 (Figure 2).
Myocarditis
The Lake Louise Criteria (LLC) for CMR diagnosis of myocarditis are based on the presence of LGE and increased regional signal intensity on T1- and T2-weighted images. Global myocarditis is an important finding and can potentially be missed by traditional LLC-based imaging. When used with LGE imaging, the parametric mapping was more sensitive and specific than the LLC criteria alone. The T1 and T2 maps were the most diagnostic single parameters8 (Figure 3).
Multi-system disorders
Chronic auto-immune conditions such as systemic sclerosis may involve sub-clinical chronic myocardial involvement which, through T1 and T2 mapping, has been detected for the first time.9 The first case of anti-synthase syndrome, causing a global myocarditis, was diagnosed by CMR mapping techniques.
Acute heart failure
CMR is a useful tool in the assessment of acute heart failure, helping to differentiate aetiology using LGE imaging by scar patterns (e.g. infarcted myocardium-subendocardial scar, dilated cardiomyopathy (DCM) mid-wall scar etc.). Parametric mapping can aid prognostication and T2 mapping may highlight cases of myocarditis presenting as acute heart failure where management may be very different and other treatment options are available.
Bonhen et al. compared the diagnostic accuracy of T1 maps, ECV maps, T2 maps and LLC in biopsy-proven myocarditis presenting as acute heart failure. Global T2 values was the only parameter with significant differences between the two groups.10
Dilated cardiomyopathy
ECV fraction increases in DCM. The use of parametric mapping, however, is not simply limited to diagnosis. In addition, absolute native T1 values, ECV fraction and presence and extent of LGE have been shown to be predictive of heart failure events and all-cause mortality in DCM. In multivariate analysis, native T1 was the sole independent predictor of all causes and heart failure composite end points.11 The ECV fraction and derived myocyte volume may be considered in terms of potential myocardial function or power per unit volume.
Left ventricular hypertrophy
Once ECV is quantified, interstitial volume (ECV fraction × LV mass) and myocyte volume ({1-ECV} × LV mass can be calculated. This value has particular use in identification of the various aetiologies of left ventricular hypertrophy (LVH) (although this term is used here to encompass other causes of increased wall thickness related to interstitial expansion rather than cellular hypertrophy).
Physiological
Athletic LVH: The use of parametric mapping and ECV quantification has lead to the recent confirmation that athletic LVH results from cellular hypertrophy with a relative reduction in ECV.12 Cardiomyopathy conditions such as DCM and hypertrophic cardiomyopathy (HCM) consistently show an increase in ECV fraction. CMR therefore is exquisitely sensitive and specific for differentiating subtle changes owing to athletic remodelling versus myopathy.
Adaptive
Hypertension: Native T1 values and ECV fraction appear to be higher in hypertensive patients with LVH but not in hypertension without LVH. The overall ECV expansion and cellular hypertrophy may be balanced, explaining in part a modest rise in ECV fraction. Further work in this group with modest changes is required before parametric mapping becomes a useful clinical tool.
Aortic stenosis: The degree of LVH in aortic stenosis can be variable and is likely to be dependent on genetic and environmental/conditional factors. Diffuse myocardial fibrosis, assessed by ECV quantification, has been demonstrated in aortic stenosis. In post aortic valve replacement patients who demonstrated LV hypertrophy regression, this was secondary to cellular and not interstitial regression.13
Hypertrophic cardiomyopathy: In hypertrophic cardiomyopathy, there has been much research on the presence and degree of LGE and its use in predicting outcomes. There is evidence that the amount of scar predicts heart failure, and some evidence that it may help to predict ventricular arrhythmia burden.
Although scar is the common final pathway of cardiomyopathies and is irreversible, there is evidence that early diffuse fibrosis occurs before the development of overt LGE. Puntmann at al. showed an increase in native T1 values in HCM compared with healthy controls and which tracked LV mass.14 This may help to direct the use of antifibrotic therapies to change the course of disease trajectory. Elevated native T1 also shows promise in differentiating LVH (in the absence of LGE) owing to HCM, from hypertension (where native T1 values remain in the normal range), and elevated native septal T1 values perhaps demonstrate early fibrosis in genotype positive-phenotype negative HCM cohorts.15
Infiltration
Fabry disease
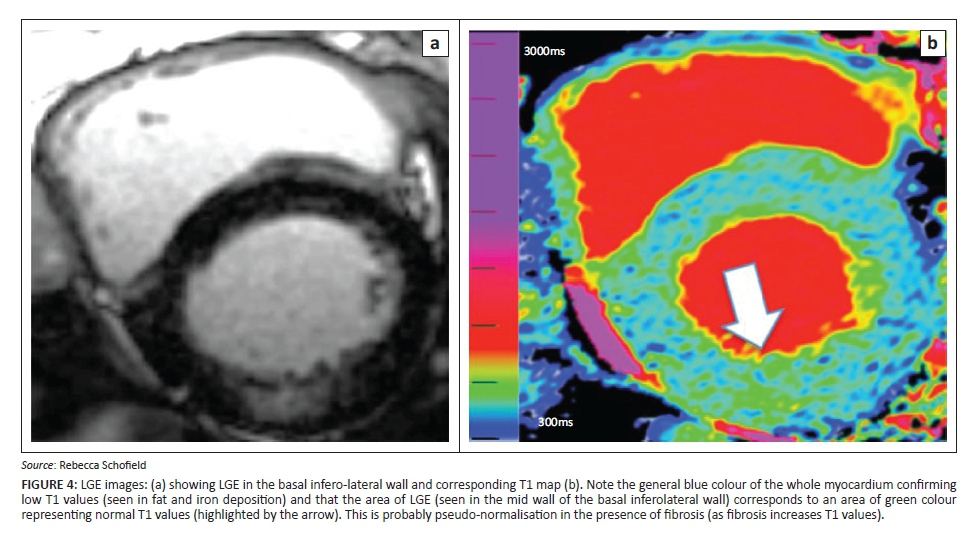
Low T1 values have been demonstrated in Fabry disease (FD).16,17 Although this X-linked enzyme disorder is rare, it is treatable with enzyme replacement therapies. Cardiac manifestations include LVH, arrhythmia and heart failure. LGE imaging has identified a predilection for basal inferolateral mid-wall fibrosis in patients with FD.
T1 mapping in addition to demonstrating low values, felt to result from sphingolipid deposition within the myocardium, has also shown pseudo-normalisation of T1 values in areas of LGE-confirmed scar and sphingolipid deposition. Assessment of native T2 values may also prove helpful to the diagnosis and our understanding of the disease process (Figure 4).
Cardiac amyloid
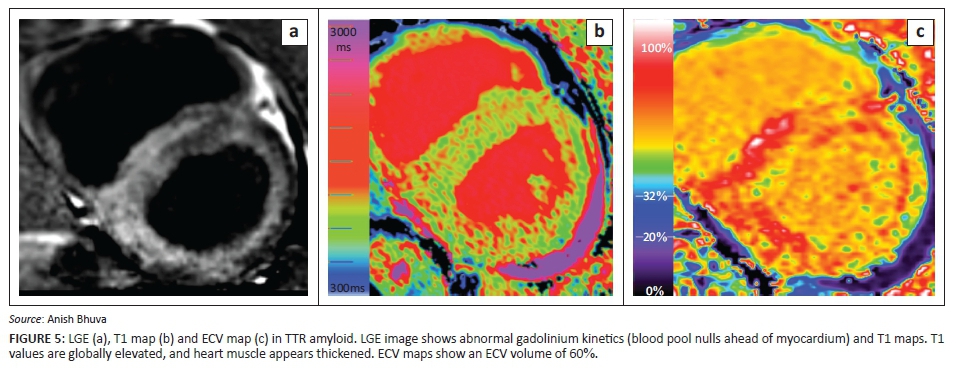
Cardiac amyloidosis has been historically difficult to diagnose until late in the disease process when treatment options are limited and hence with a grave prognosis. Native T1 mapping has proved a significantly useful addition to the diagnostic armamentarium in both amyloid light chain (AL)18 and transthyretin amyloid (ATTR).19 Native T1 values are significantly elevated compared to normal, with AL amyloid native T1 values generally higher than ATTR values.18,19In addition, ECV maps have also aided diagnosis and given further insight into the disease. ECV is significantly elevated in cardiac amyloid (slightly higher in ATTR amyloid than AL amyloid) (Figure 5).
Cardiac siderosis
Major changes in the diagnosis of cardiac siderosis were put down to T2* detection of myocardial iron deposition. Although T2* is specific, it is prone to errors in measurement if little or no iron is present, and some may argue that perhaps the current cut-off is too high. Recent work by Abdel-Gadir et al. using T1 and T2* maps in 250 patients with possible iron overload, suggests that the cut-off should be higher - perhaps 29 ms instead of 20 ms.20 Use of T1 maps alongside T2* may aid the diagnosis of early myocardial iron (Figure 6).
Future developments
Fingerprinting using a CMR atlas
One criticism of parametric mapping is the additional scan time required and appropriate patient selection. A technique which is short enough to be performed on all comers would negate this issue.
One potential solution to this problem is ECG-triggered 2D magnetic resonance fingerprinting. This technique uses pattern recognition and a dictionary of possible signal evolution which is simulated for each scan. The pulse sequence uses variable flip angles, repetition times, inversion recovery times and T2 prep dephasing times. Initial phantom and healthy volunteer scans show promising results.21
Conclusion
CMR is transforming our understanding of the myocardium - the place where most cardiac disease ultimately occurs. Function, combined with scar imaging, via the LGE technique was a major advance. Incorporating parametric mapping to this is incrementally useful across pathologies. Using four parameters (T1, T2, T2* and ECV mapping), major insights across diseases are being obtained. Imaging fibrosis, oedema, iron and interstitial volume provides a huge histological insight. The ability to detect serial changes in vivo is ground-breaking. For some pathologies, the advantages of tissue characterisation using parametric mapping in terms of clinical utility and early translation are readily apparent. But this is the beginning of a journey with perhaps the major insights still to come.
For rare diseases, these techniques are becoming established, and the current challenges are about delivery on a healthcare system level. However, the future will centre on another key theme: splitting the myocardium into its interstitial and cellular compartments and their quantification in common diseases such as LVH and heart failure. Already, major insights are being obtained - a key one being the striking findings in athletic adaptation versus other LVH causes, and the demonstration of fibrosis LVH regression using ECV mapping after aortic valve replacement. Further work is needed to aid the transition of mapping to the frontline of CMR. Large-volume studies to explore the multitude of potential uses and assess reproducibility will then follow.
Acknowledgements
Competing interests
The authors declare that they have no financial or personal relationships which may have inappropriately influenced them in writing this article.
Authors' contributions
J.M. was responsible for the text, with editing and contributions from R.S. and A.B. and K.M. A.B., K.M., J.M. and R.S. were responsible for collation of the images.
References
1. Kellman P, Hansen MS. T1-mapping in the heart: Accuracy and precision. J Cardiovasc Magn Reson. 2014;16:2. http://dx.doi.org/10.1186/1532-429x-16-2 [ Links ]
2. Moon JC, Messroghli DR, Kellman P, et al. Myocardiam T1 mapping and extracellular volume quantification: A SCMR and CMR Working Group of the European Society of Cardiology consensus statement. JCMR. 2013;15:92. [ Links ]
3. Arheden H, Saeed M, Higgins CB, et al. Measurement of the distribution volume of gadopentetate dimeglumine at echo-planar MR imaging to quantify myocardial infarction: Comparison with 99mTc-DTPA autoradiography in rats. Radiology. 1999;211:698-708. http://dx.doi.org/10.1148/radiology.211.3.r99jn41698 [ Links ]
4. White SK, Sado D, Fontana M, et al. T1 mapping for myocardial extracellular volume by CMR. Bolus only vs primed infusion technique. J Am Coll Cardiol Imaging. 2013;6(9):955-962. http://dx.doi.org/10.1016/j.jcmg.2013.01.011 [ Links ]
5. Spottiswoode BS, Ugander M, Kellman P. Automated inline extracellular volume (ECV) mapping. JCMR. 2015;17(suppl. 1):W6. [ Links ]
6. Treibel T, Fontana M, Maestrinin V, et al. Automatic measurement of the myocardial interstitium. J Am Cardiol Imaging. 2016;9(1):54-63. http://dx.doi.org/10.1016/j.jcmg.2015.11.008 [ Links ]
7. Wu E, Judd RM, Vargas JD, Klocke FJ, Bonow RO, Kim RJ. Visualisation of presence, location, and transmural extent of healed Q-wave and non-Q-wave myocardial infarction. Lancet. 2001;357:21-28. http://dx.doi.org/10.1016/S0140-6736(00)03567-4 [ Links ]
8. Luetkens JA, Homsi R, Sprinkart AM, et al. Incremental value of quantitative CMR including parametric mapping for the diagnosis of acute myocarditis. Eur Heart J Cardiovasc Imaging. 2016;17(2):154-161. http://dx.doi.org/10.1093/ehjci/jev246 [ Links ]
9. Puntmann VO, D'Cruz D, Smith Z, et al. Native myocardial T1 mapping by cardiovascular magnetic resonance imaging in subclinical cardiomyopathy in patients with systemic lupus erythematosus. Circ Cardiovasc Imaging. 2013;6(2):295-301. http://dx.doi.org/10.1161/CIRCIMAGING.112.000151 [ Links ]
10. Bohnen S, Radunski U, Lund G, et al. Performance of T1 and T2 mapping cardiovascular magnetic resonance to detect active myocarditis in patients with recent onset heart failure. Circ Cardiovasc Imaging. 2015;8:e003073. http://dx.doi.org/10.1161/CIRCIMAGING.114.003073 [ Links ]
11. Mordi I, Carrick D, Bezerra H, Tzemos N. T1 and T2 mapping for early diagnosis of dilated non-ischaemic cardiomyopathy in middle-aged patients and differentiation from normal physiological adaptation. Eur Heart J Cardiovasc Imaging. 2016;17(7):797-803. http://dx.doi.org/10.1093/ehjci/jev216 [ Links ]
12. McDiarmid AK, Swoboda PP, Erhayiem B, et al. Athletic cardiac adaptation in males is a consequence of elevated myocyte mass. Circ Cardiovasc Imaging. 2016;9:e003579. [ Links ]
13. Flett AS, Sado D, Quarta G, et al. Diffuse myocardial fibrosis in severe aortic stensosi: An equilibrium contrast cardiovascular magnatic resonance study. Eur Heart J. 2012;13:819-826. [ Links ]
14. Puntmann VO, Voight T, Chen Z, et al. Native T1 mapping differentiation of normal myocardium from diffuse disease in hypertrophic and dilated cardiomyopathy. J Am Coll Cardiovasc Imaging. 2013;6(4):475-485. http://dx.doi.org/10.1016/j.jcmg.2012.08.019 [ Links ]
15. Hinojar R, Varma N, Child N, et al. T1 mapping in discrimination of hypertrophic phenotypes: Hypertensive heart disease and hypertrophic cardiomopathy. Circ Cardiovasc Imaging. 2015;8:e003285. http://dx.doi.org/10.1161/CIRCIMAGING.115.003285 [ Links ]
16. Sado DM, White SK, Piechnik SK, et al. Identification and assessment of Anderson-Fabry disease by cardiovascular magnetic resonance non-contrast myocardial T1 mapping. Circ Cardiovasc Imaging. 2013;6:392-398. http://dx.doi.org/10.1161/CIRCIMAGING.112.000070 [ Links ]
17. Thompson RB, Chow K, Khan A, et al. T(1) mapping with cardiovascular MRI is highly sensitive for Fabry disease independent of hypertrophy and sex. Circ Cardiovasc Imaging. 2013;6:637-645. http://dx.doi.org/10.1161/CIRCIMAGING.113.000482 [ Links ]
18. Banypersad SM, Fontana M, Maestrini V, et al. T1 mapping and survival in systemic light-chain amyloidosis. Eur Heart J. 2015;36:244-251. http://dx.doi.org/10.1093/eurheartj/ehu444 [ Links ]
19. Fontana M, Banypersad SM, Treibel TA, et al. Native T1 mapping in transthyretin amyloidosis. JACC Cardiovasc Imaging. 2014;7:157-165. http://dx.doi.org/10.1016/j.jcmg.2013.10.008 [ Links ]
20. Abdel-Gadir A, Sado D, Murch S, et al. Myocardial iron quantification using T2* and native T1 mapping - A 250 patient study. JCMR. 2015;17(suppl. 1):312. [ Links ]
21. Hamilton JI, Jiang Y, Chen Y, et al. MR fingerprinting for rapid quantification of myocardial T1, T2, and proton spin density. Magn Reson Med. March 2016. http://dx.doi.org/10.1002/mrm.26216 [ Links ]
 Correspondence:
Rebecca Schofield
rebeccaschofield@doctors.org.uk
Received: 01 May 2016
Accepted: 04 Aug. 2016
Published: 11 Nov. 2016

