


Serviços Personalizados
Artigo
 Inglês (pdf)
 Artigo em XML
 Referências do artigo
Indicadores

Links relacionados
-
 Citado por Google
 -
 Similares em Google
Compartilhar

 Permalink
SA Journal of Radiology
versão On-line ISSN 2078-6778
versão impressa ISSN 1027-202X
S. Afr. J. radiol. (Online) vol.20 no.1 Johannesburg 2016
http://dx.doi.org/10.4102/sajr.v20i1.993
ORIGINAL RESEARCH
Computed tomography stroke findings and population demographics at Pelonomi Hospital, Bloemfontein
Kevin DaffueI; Gina JoubertI; Susan OttoII
IDepartment of Clinical Imaging Sciences, University of the Free State, South Africa
IIDepartment of Biostatistics, University of the Free State, South Africa
ABSTRACT
BACKGROUND: Stroke remains the highest cause of death in patients more than 50 years old in South Africa, and the fourth highest cause of death overall. There is a paucity of information regarding this disease in the Free State Province.
OBJECTIVES: To assess the stroke profile of patients referred for computed tomography (CT) imaging to our institution along with evaluating factors that could improve stroke management.
METHOD: The demographic information, stroke risk factors, stroke types and time to imaging were evaluated for all patients who presented for CT stroke imaging from July 2014 until July 2015. Information was gathered prospectively from the hospital and radiology information systems.
RESULTS: The study included 174 patients (53.5% female, 46.5% male). Their mean age was 59 years (standard deviation (SD) 14.6). The most prevalent risk factors were hypertension (83.7%), smoking (20.5%) and diabetes (15.0%). The population group consisted of 67.8% ischaemic (n = 118) and 32.2% (n = 56) haemorrhagic strokes. The majority of patients with a known time of symptom onset (n = 102) presented after 8 hours (82.4%). The median order to report time (ORT) was 61 min (range 18 min-1361 min). The median arrival to report time (ART) was 32 min (range 4 min-893 min.
CONCLUSION: Our stroke population did not differ significantly from others in South Africa and Africa overall. Pre- and in-hospital delays significantly influenced patient numbers qualifying for thrombolysis.
Introduction
The effect of stroke worldwide and in South Africa is well known. It remains, however, the highest cause of death in patients more than 50 years of age in South Africa, and the fourth highest cause of death overall.1 The impact on surviving patients, their families and support systems is considerable. To alter the course of this burden, it is first necessary to know the disease profile in the local population, which will aid in identifying reversible factors in those at risk. Similar socio-demographic and risk profile studies have been conducted in South Africa2,3,4 but research of this nature is lacking in the Free State Province. In addition, literature evaluating the various time parameters influencing stroke imaging and patient treatment is also deficient in South Africa.
Objective
The aim of the present study was to assess the stroke profile of patients referred for computed tomography (CT) imaging to our institution and to evaluate factors that could improve stroke management.
Methodology
This prospective descriptive study was conducted at the Department of Clinical Imaging Sciences, Pelonomi Regional Hospital, Bloemfontein. The study period was one year, starting 01 July 2014.
Inclusion criteria
All patients referred for CT brain imaging to Pelonomi Hospital with clinical symptoms of new onset stroke.
Exclusion criteria
Patients with a previous history of stroke and no new neurology.
Collection of data
An electronic request form was completed for each patient by the referring physicians, using the hospital information system (HIS). This contained demographic-, disease profile- and stroke-specific clinical information. Data on the patients' age, gender, stroke risk factors and time of symptom onset were collected from the HIS.
Time periods considered and definitions
Time from symptom onset (TSO)
Time from onset of symptoms to the availability of the CT report on the HIS.
Order to report time (ORT)
Period from when the referring physician requested imaging until report availability on the HIS.
Arrival to report time (ART)
Period from when the patient entered the department and was registered on the radiology information system (RIS) until report availability on the HIS.
The above-mentioned information was collected from the RIS.
Imaging and interpretation
All patients were scanned by a GE Discovery HD 750 64-slice multidetector computed tomography (MDCT) machine.
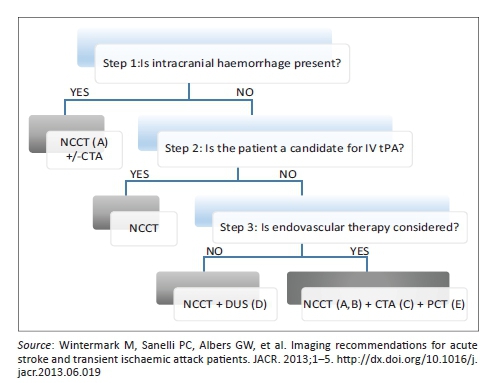
The imaging findings were interpreted by the radiology registrar responsible for the CT list on the day of imaging and were reviewed by the main researcher before data collection. Findings were interpretated according to a standardised departmental imaging and reporting protocol (Appendix 1). The imaging protocol was adapted from the recommended algorithm of Wintermark et al., with the exclusion of magnetic resonance imaging (MRI) as it was not routinely available during the study period.5 In summary, this entailed rapid assessment for ischaemic versus haemorrhagic stroke and the use of computed tomography angiography (CTA) and perfusion studies where indicated. The Alberta stroke programme early CT (ASPECT) score was applied to all acute ischaemic stroke patients considered for thrombolysis.6 Interpretation style was also modelled on previous works and recommendations.7
Data analysis
Results were summarised by frequencies and percentages (categorical variables) and means, standard deviations or percentiles (numerical variables).
Ethical consideration
Ethics approval was obtained from the Ethics Committee of the Faculty of Health Sciences of the University of the Free State prior to the study initiation date. As imaging and interpretation of results were performed according to existing departmental guidelines, informed consent was not needed prior to imaging. All data were noted confidentially by using the patients' hospital number as identification. Permission was also obtained from the chief medical officer of Pelonomi Regional Hospital.
Results
Risk factors and demographics
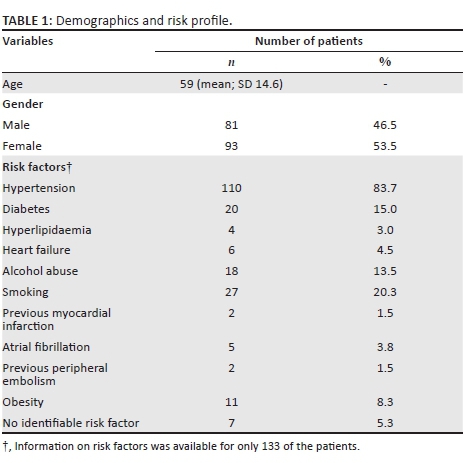
A total of 174 patients were included in the study. Their mean age was 59 years (SD 14.6), ranging from 17 years - 96 years. The study population was predominantly female (n = 93, 53.5%). The most prevalent risk factor was hypertension (83.7%), followed by smoking (20.5%) and diabetes (15.0%) (Table 1).
Stroke type and territories
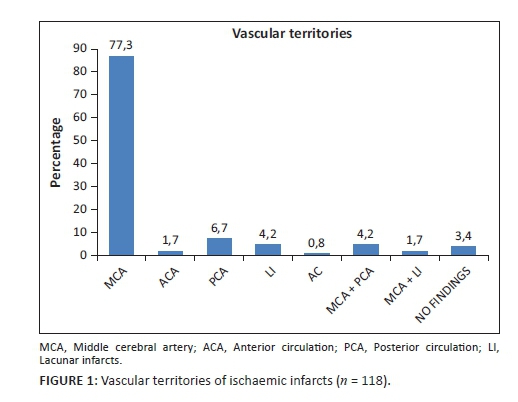
The population group consisted of 67.8% ischaemic (n = 118) and 32.2% (n = 56) haemorrhagic stroke patients. The majority of them (77.3%) had middle cerebral artery (MCA) territory infarcts (n = 92). The vascular territories of ischaemic infarcts are demonstrated in Figure 1. Four patients had no signs of ischaemia or haemorrhage (3.4%). Because these patients had focal neurological deficits at the time of imaging, they were included in the ischaemic group. Of these four, one had progressive neurological deficit in hospital. Clinical notes could not be retrieved for the other three patients.
Time from symptom onset and scan time
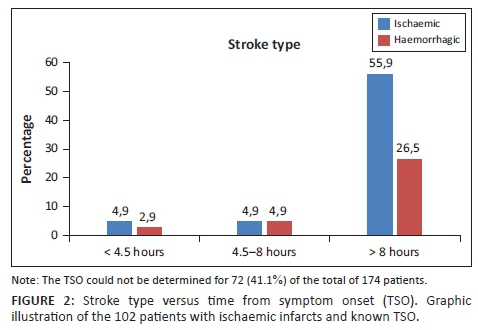
The TSO was unknown for 72 (41.4 %) of the total number of patients. Of the remaining 102, the majority (82.4%) presented after 8 hours.
In the group with a known TSO and ischaemic strokes (n = 67), only five patients (7.5%) presented within the four-and-a-half-hour therapeutic window for thrombolysis (Figure 2). Of these five, only one received intravenous recombinant tissue plasminogen activator (rtPA). Clinical records on the outcome of this patient were not available. One patient had an ASPECT score of 4. One fell out of the therapeutic window owing to inter-hospital delays, and two did not receive rtPA for reasons not stated in the clinical notes.
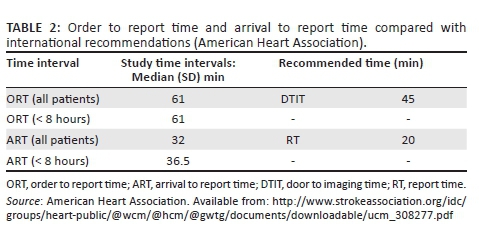
The median ORT was 61 min (range 18-1361). Coincidentally, the median was the same for the group with a known TSO < 8 hours. The median ART was 32 min (range 4-893). For the group presenting within 8 hours (n = 18), the median was 36.5 min (Table 2). Nearly two-thirds (63.1%) of the CT requests were received after normal working hours.
Discussion
The patient mean age of 59 years was similar to that found by Connor et al. in a study conducted in Johannesburg published in 2009.3 Hypertension (83.7%), smoking (20.3%) and diabetes (15.0%) as the leading risk factors correlate with those observed in other studies conducted in the African continent. The meta-analysis published in 2015 by Owolabi et al. established that hypertension was present in 98% of stroke sufferers in Africa and was identified as the strongest modifiable risk factor.9 Closer to home, Connor et al. also identified hypertension as the leading risk factor (70% of patients), followed by current smoking (30%) and alcohol consumption (26%).3 The prevalence of diabetes in their study was similar to that in our population group (14%).
Assessing the management of such medical conditions and advocating lifestyle modification by reinforcing public awareness is pivotal in addressing stroke management. The prevalence of HIV infection could not be assessed, as this was inconsistently recorded; this was unfortunate as it would have been an interesting contribution to the study. Tipping et al. found in their 2007 study that of 1087 stroke patients, 6.1% were HIV infected. The majority of the 67 patients were younger than 46 years, and had ischaemic strokes (96%). Infectious meningitis or vasculitides (28%) and HIV vasculopathy (20%) were more common underlying aetiologies. The more traditionally accepted risk factors (hypertension, diabetes, etc.) were not significant risk factors in this young stroke group.10 HIV infection and antiretroviral treatment contribute to accelerated atherosclerosis and aneurysmal changes, thus increasing the risk of stroke. As found by Benjamin et al., it would be difficult to identify HIV as a stand-alone risk factor in our population group, considering the high prevalence of hypertension.11
The stroke distribution (ischaemic 67.8%, haemorrhagic 32.2%) is in line with that of other population groups in Africa, where the incidence of haemorrhagic stroke ranged between 29% and 57%.3,9,12 Owing to unretrievable clinical records, transient ischaemic attacks could not be ascertained in terms of a cause in three of the four patients previously mentioned with normal CT findings. As stated in our imaging protocol, these patients could have benefited from additional CT perfusion studies but, owing to technical difficulties at the time (non-functional injection pump), this was not possible. A routine MRI service was also not yet available.
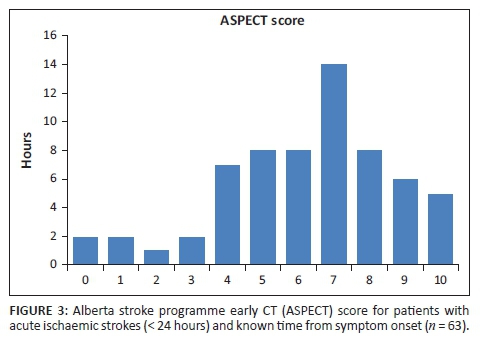
Given that 52.4% of the patients with acute ischaemic strokes had ASPECT scores ≥ 7, but only 7.5% presented within four-and-a-half hours from symptom onset, expediting the referral and transport process would significantly increase the number of patients qualifying for rtPA. Understandably, there are contributing factors beyond our control, such as the distance from hospital at the time of symptom onset. It should also be noted that our institution has an ever-enlarging catchment area owing to loss of resources in peripheral hospitals. In-hospital delays are not unique to our situation, as other developing countries experience similar problems, which was evident from an article published by Gurav et al. in May 2015.13
Many factors can, however, be addressed as outlined in the Target stroke campaign manual released by the American Heart Association (AHA).8 These include early notification of emergency departments by emergency medical services (EMS), education of the EMS personnel on appropriate triage of patients eligible for intravenous treatment, expedited in-hospital assessment and improved guidelines and protocols to minimise uncertainty by the treating physicians. Such guidelines, specifically designed for the South African setting, have already been established.14 The treating physician could also accompany appropriately selected patients to the scanner; this would shorten the door-to-needle time as drug administration could then commence as soon as a relevant ischaemic stroke pattern is identified.
Another recommendation is to make use of a 'single-call activation system'. This was implemented with good effect by Nolte et al.15 at their institution in the form of an all-points alarm. The entire stroke team was notified simultaneously by means of an SMS-based system. This method reduced their median in-hospital delay time from 54 min to 35 min and increased the number of patients treated with rtPA by 24%.
As time intervals were deduced from the RIS, the time of arrival in hospital and 'door to physician time' were unknown. We therefore used the ORT, as previously defined under methodology. This is an obvious underestimation but nonetheless is still longer than recommended by international guidelines.8 Our median ORT was 61 min, with the recommended 'door to report time' being 45 min.
The median reporting time of 32 min should also be addressed, as the AHA recommendations permit 20 min (door-to-scan report time: 45 min; door-to-scan time: 25 min). Comparison of our time parameters with AHA guidelines is depicted in Table 2. This period could be improved by clear interpretation protocols and increased awareness on utilising tools such as the ASPECT score. The effect of delayed reporting time on treatment is crucial.
When applicable, the referring physician was telephonically informed of the CT findings immediately. A formal report was only released after a protracted period, which could explain the wide interquartile ranges. Measuring these variables was not practically possible and could not be assumed.
The fact that almost two-thirds of the scan requests occurred after hours is not surprising, as a working day consists of 8 hours. It is also a reflection of functionality of the after-hours services.
Following the outcome of the present study, it is our intention to reconvene with our Internal Medicine Department about implementing the above-mentioned plans and determining further progress.
Limiting factors
The small study population prohibits further delineation of results. As all the steps for data collection are already in place, a larger follow-up study would address this issue. Because we only considered patients who underwent CT, the total number of strokes during the period could be underestimated. However, patients who did not receive imaging probably did not fall within a period in which medical intervention would alter the course of the disease process. Unavailability of the exact TSO onset for 72 of the 174 patients is an obvious limitation that could not be overcome. This once again reiterates the importance of public awareness in stroke management. The onset and management of hypertension and diabetes was not recorded, as this was not part of the initial study outcomes.
Conclusion
Our stroke population did not differ significantly from those documented in the rest of South Africa and Africa as a whole. Pre- and in-hospital delays contributed significantly to patient numbers qualifying for thrombolytic treatment.
Acknowledgements
Competing interests
The authors declare that they have no financial or personal relationships, which may have inappropriately influenced them in writing this article.
Authors' contributions
K.D. undertook the protocol and study design, data collection, planning and writing of the article first draft and final version, and is the main corresponding author. S.F.O was the study co-ordinator and reviewed the protocol, draft and final article. G.J. processed and reviewed data, and reviewed the draft and final article.
References
1. Statistics South Africa. Mortality and causes of death in South Africa, 2011: Findings from death notification. 2011;(July). [ Links ]
2. Bradshaw D, Groenewald P, Laubscher R, Nannan N, Nojilana B, Norman R, et al. Initial burden of disease estimates for South Africa, 2000. South African Med J. 2003;93(9):682-8. [ Links ]
3. Connor MD, Modi G, Warlow CP. Differences in the nature of stroke in a multiethnic urban south african population the Johannesburg Hospital stroke register. Stroke. 2009. p. 355-362. http://dx.doi.org/10.1161/STROKEAHA.108.521609 [ Links ]
4. Connor MD, Walker R, Modi G, Warlow CP. Burden of stroke in black populations in sub-Saharan Africa. Lancet Neurol. 2007;6(3):269-278. http://dx.doi.org/10.1016/S1474-4422(07)70002-9 [ Links ]
5. Wintermark M, Sanelli PC, Albers GW, Bello J a, Derdeyn CP, Hetts SW, et al. Imaging Recommendations for Acute Stroke and Transient Ischemic Attack Patients. Jacr [Internet]. 2013;1-5. http://dx.doi.org/10.1016/j.jacr.2013.06.019
6. Understanding Alberta Stroke Program Early CT Score (ASPECTS) [Internet]. [ Links ] Available from: http://www.aspectsinstroke.com/collateral-scoring/
7. De Lucas EM, Sánchez E, Gutiérrez A, Mandly AG, Ruiz E, Flórez AF, et al. CT protocol for acute stroke: tips and tricks for general radiologists. Radiographics. 2008;28(6):1673-87. http://dx.doi.org/10.1148/rg.286085502 [ Links ]
8. American Heart Association. Target: Stroke Campaign Manual. 2010. Available from: http://www.strokeassociation.org/idc/groups/heart-public/@wcm/@hcm/@gwtg/documents/downloadable/ucm_308277.pdf [ Links ]
9. Owolabi MO, Akarolo-anthony S, Akinyemi R, Arnett D, Gebregziabher M, Jenkins C, et al. The burden of stroke in Africa: A glance at the present and a glimpse into the future. Cardiovasc J Afr. 2015;26(2):27-38. http://dx.doi.org/10.5830/CVJA-2015-038 [ Links ]
10. Tipping B, de Villiers L, Wainwright H, Candy S, Bryer A. Stroke in patients with human immunodeficiency virus infection. J Neurol Neurosurg Psychiatry. 2007;78(12):1320-1324. http://dx.doi.org/10.1136/jnnp.2007.116103 [ Links ]
11. Benjamin L a, Bryer A, Emsley HC, Khoo S, Solomon T, Connor MD. HIV infection and stroke: current perspectives and future directions. Lancet Neurol [Internet]. 2012;11(10):878-890. http://dx.doi.org/10.1016/S1474-4422(12)70205-3
12. Bryer A. "Time is brain" and stroke units: stroke care today: editorial. South African J diabetes Vasc Dis. 2008;5(4):151-153. [ Links ]
13. Gurav S, Zirpe K, Wadia R, Pathak M, Deshmukh A, Sonawane R, et al. Problems and limitations in thrombolysis of acute stroke patients at a tertiary care center. Indian J Crit Care Med [Internet]. 2015;19(5):265. http://dx.doi.org/10.4103/0972-5229.156468
14. Bryer A, Connor M, Haug P, Cheyip B, Staub H, Tipping B, et al. South African guideline for management of ischaemic stroke and transient ischaemic attack 2010: A guideline from the South African Stroke Society (SASS) and the SASS Writing Committee. S Afr Med J. 2010;100(11 Pt 2):747-778. http://dx.doi.org/10.7196/SAMJ.4422 [ Links ]
15. Nolte CH, Malzahn U, Kühnle Y, Ploner CJ, Müller-Nordhorn J, Möckel M. Improvement of door-to-imaging time in acute stroke patients by implementation of an all-points alarm. J Stroke Cerebrovasc Dis. 2013;22(2):149-153. http://dx.doi.org/10.1016/j.jstrokecerebrovasdis.2011.07.004 [ Links ]
 Correspondence:
Kevin Daffue
kevinelzette@yahoo.com
Received: 23 Feb. 2016
Accepted: 19 July 2016
Published: 22 Sept. 2016
Research Project no.: 65/2014
Imaging protocol used
Step 1
Assess the aetiology of the intracranial haemorrhage (NCCT [non-contrast CT]), (CTA [CT angiogram]) for vascular pathologies, such as aneurysms, arteriovenous malformations, vasculopathies. Additionally, determine if the patient is not a candidate for IV tPA (contraindication to tPA, outside the time window for tPA or if IV tPA failed or it is thought that it might fail).
Step 2
For patients who are outside the time window for acute reperfusion therapies (4.5 hours at sites where only IV tPA is being considered; 8 hours at sites where endovascular therapy is considered) and for patients with TIAs. Emphasis is on secondary prevention, and their imaging work-up should focus on vascular imaging (CTA or Doppler-ultrasound [DUS]) to assess carotid arteries as a possible cause of the ischaemic stroke, with secondary prevention in mind (PCT = perfusion CT).
• A. Assess for intracranial haemorrhage.
• B. Assess the extent of the ischaemic core.
• C. Assess the location and extent of the intravascular clot.
• D. Assess carotid atherosclerotic disease.
• E. Assess the extent of viable tissue.
Interpretation
Questions to be answered following each scan
1. Is the lesion(s) in the CNS caused by ischaemia or haemorrhage, or is it related to a nonvascular stroke mimicker?
2. Where is the lesion, what is its size, shape and extent?
3. What is the nature of the severity of the vascular lesion? How do the vascular lesions and brain perfusion abnormalities relate to the lesion?
4. Are abnormalities of blood constituents causing or contributing to ischaemia or haemorrhage?
5. Perceived age of infarction (hyperacute, acute, subacute).
These findings should be documented in the report.

