


Services on Demand
Article
 English (pdf)
 Article in xml format
 Article references
Indicators

Related links
-
 Cited by Google
 -
 Similars in Google
Share

 Permalink
SA Journal of Radiology
On-line version ISSN 2078-6778
Print version ISSN 1027-202X
S. Afr. J. radiol. (Online) vol.20 n.1 Johannesburg 2016
http://dx.doi.org/10.4102/sajr.v20i1.957
QUIZ CASE
Answer to neuroimaging quiz case
Shalendra Misser; Thamsanqa Mngoma
Lake Smit and Partners Inc., Durban, South Africa
A 50-year-old man of otherwise excellent health presented with recent onset of left upper limb weakness and left facial nerve palsy. Figures 1-7 are selected magnetic resonance (MR) images.
We congratulate Dr Thato Sefanyetso for his submission of the correct findings and diagnosis of this quiz case.
Answer and discussion
The patient's acute presentation with left arm monoparesis and upper motor neuron facial nerve palsy, in an otherwise healthy individual, was confounding. He had no risk factors for vasculopathy, hypertension or diabetes mellitus. Preliminary imaging performed elsewhere by conventional MR imaging suggested that the lesions seen were neoplastic, probably a primary glioma. Our initial review of the imaging, on request of the neurologist, raised some doubt and we proceeded to repeat the MRI study with specific functional imaging sequences.
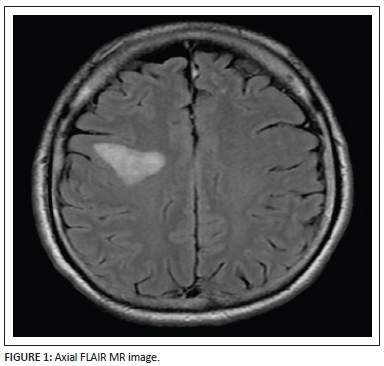
An axial FLAIR (Figure 1) sequence reveals a triangular focus of hyperintensity at the right subrolandic frontal white matter in the centrum semiovale. This lesion, for its size, is not associated with any significant mass effect and there is no disruption of the grey-white matter interface. Incidentally, a few left frontal subcortical hyperintensities are also observed, probably microangiopathic in origin.
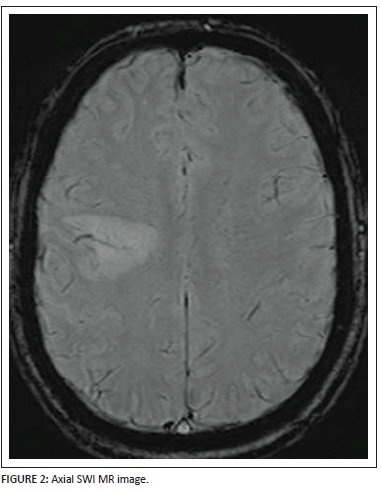
The axial SWI (Figure 2) sequence demonstrates a very useful and highly specific sign. Through the central and lateral aspect of the hyperintense focal lesion, a flow void is noted in keeping with a medullary vein branch ramifying through the white matter lesion. This central vascular flow void surrounded by a hyperintense lesion raises suspicion for a demyelinating process that favours perivenular white matter in the first instance. In addition, no peripheral signal voids or central calcification can be noted on the susceptibility weighted imaging sequence.
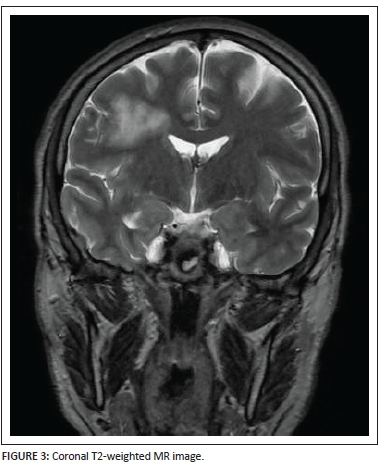
The location of the lesion is well shown on the coronal T2-weighted image (Figure 3) as well as the extent of the lesion from the juxta-ventricular margin up to the subcortical white matter.
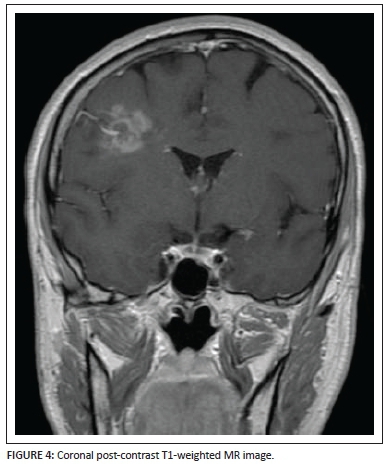
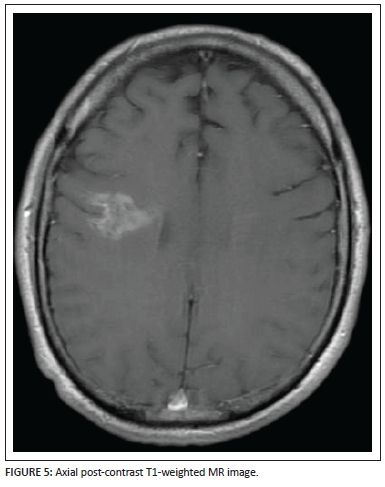
Coronal (Figure 4) and axial (Figure 5) post-gadolinium T1-weighted sequences demonstrate the patchy enhancement of the major portion of the lesion except for the focal areas of necrosis centrally within the lesion bed. The enhancing vessel is well demonstrated, extending from the pial surface through the centre of the lesion. Subtle brush-like vascular enhancement is also seen in the contralateral centrum semiovale white matter.
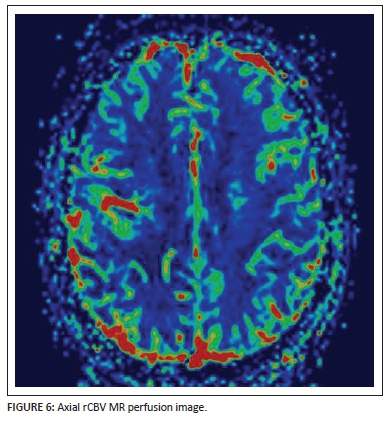
Perfusion-weighted rCBV map imaging (Figure 6) shows normal perfusion of the right hemisphere in the area of concern. The central vessel is noted as a linear focus of hyperperfusion surrounded by normal perfusion of the rest of the lesion bed.
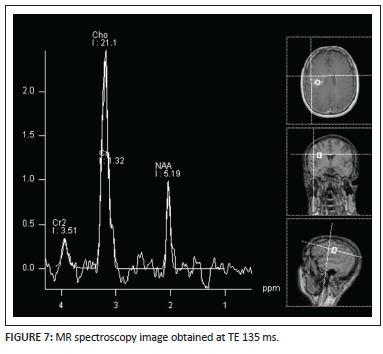
A MR spectroscopy image (Figure 7) performed at TE = 135 ms demonstrates a prominent choline peak with suppression of N-acetyl aspartate (NAA) and presence of a small lactate peak at 1.3ppm. A choline-to-NAA ratio greater than 2:1 is noted. This pattern is non-specific and can be seen in primary or metastatic tumours as well as in tumefactive demyelinating lesions.
We concluded that the combination of imaging findings as well as the relatively acute presentation favoured a demyelinating process and we suggested a diagnosis of a clinically isolated syndrome associated with a tumefactive demyelinating lesion, much to the contrary of the referring clinician's expectation. We advised correlation with cerebrospinal fluid testing for oligoclonal band analysis. This was undertaken and confirmed a demyelinating process.
Discussion
Tumefactive demyelinating lesions (TDLs) are intriguing entities to neuroradiologists and neurologists alike. They prove to be a challenge primarily in their distinction from primary or metastatic brain tumours, inflammatory lesions (such as cerebral abscesses) and lymphoma. TDLs are a small subgroup of a large spectrum of central nervous system disorders collectively known as idiopathic inflammatory-demyelinating disorders (IIDDs). The clinical course, neuroimaging, laboratory findings and prognosis varies considerably for each of the subgoups of IIDDs.1 Conventionally, the diagnosis of demyelinating disease (e.g. owing to multiple sclerosis) is a simple one to make in the presence of multiple periventricular, corpus callosal, posterior fossa or cord lesions. On the contrary, in the instance of a solitary large focus of cerebral demyelination with an appearance that mimics a tumour mass, the diagnosis may be much more difficult to suggest and the neurologist more difficult to convince.
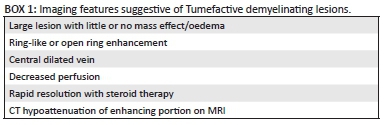
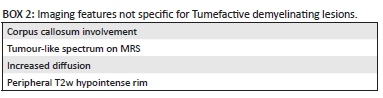
Clinically, TDL may present with features attributable to an intracranial neoplastic mass lesion. MRI is by far the best modality for the assessment of demyelinating lesions of the central nervous system. Generally, TDLs are greater than 2 cm in diameter and exhibit minimal surrounding white matter hyperintensity, oedema or mass effect.2 This is a useful distinguishing feature as neoplastic lesions of this size are known to assert significant mass effect at similar dimensions. The lesions are predominantly located in the supratentorial white matter and favour frontal and parietal lobes, with cortical involvement rarely seen. When identified in the posterior fossa, demyelinating lesions tend to have a predilection for the middle cerebellar peduncles (Boxes 1-2).
The post-gadolinium enhancement patterns associated with TDL may be ring-like, nodular, patchy, incomplete or open-ring types.3 In the case of the latter types, the open portion of the ring usually lies along the grey matter interface of the lesion. The enhancing portions of the lesion correlate with the leading edge of the demyelination and are therefore seen on the white matter side of the lesion.4 Enhancing components of TDL are also well assessed on unenhanced CT scan. Kim et al.5 have shown that using unenhanced CT in addition to conventional post-contrast MRI studies increases the accuracy in diagnosing TDL over neoplastic aetiologies and lymphoma. The areas of enhancement seen on MRI studies in TDL are indistinct, with reduced attenuation on CT scans. Conversely, in gliomas there is variable attenuation of the enhancing portions, and in cases of lymphoma isoattenuation of the enhancing portions was described (Table 1).
There is considerable overlap of not only the imaging features, but also the histopathological findings in biopsied TDL and brain neoplasms. In fact, TDLs have in the past been erroneously reported as gliomas on biopsy owing to the hypercellular nature of these lesions and the presence of Creutzfeld cells which are giant glial cells with fragmented chromatin and abnormal mitoses. A critical difference between TDLs and tumours is the absence of neoangiogenesis in the former. Perivenular demyelination results in lesions having a venocentric appearance; a feature not seen in other leukodystrophies or neoplastic processes. These vessels in effect represent periventricular tributaries, radial veins or branch venules ramifying through the white matter. Dynamic contrast-enhanced T2* or susceptibility-weighted MR imaging has become an effective additional sequence recently introduced in the characterisation of TDL and has proven to assist further in the delineation of these lesions from neoplastic entities.6 Additionally, using perfusion-weighted MRI, the rCBV values for TDLs were much lower than for brain neoplasms. The difference between TDL and lymphoma was less marked but still significant in that lymphoma lesions had higher mean rCBV values as well.7
Proton MR spectroscopy (MRS) is a powerful tool that is increasingly shown to be of value in molecular and metabolic neuroimaging. In TDL, elevated choline (Cho) peak is thought to represent a combination of demyelination, reactive astrogliosis and perivenular inflammation. The reduction in N-acetyl aspartate (NAA) seen in TDL represents cumulative axonal destruction and secondary neuronal mitochondrial dysfunction. The presence of lactate indicates a shift in cellular respiration from the oxidative metabolism of substrates to anaerobic glycolysis. This may be consequent on localised ischaemia, mitochondrial dysfunction and the inflammatory cascade. Typically, MRS of TDL may therefore reveal a brain metabolite pattern quite similar to that of gliomas with elevated choline, suppressed NAA, increased choline/creatine(Cr) ratio and presence of lactate and lipid peaks. This non-specific pattern is frequently seen in low-grade gliomas and TDL. Some authors8 have shown that, despite this considerable overlap in the patterns expressed by both entities, there is a difference in the NAA/Cr ratio, particularly centrally in TDL when compared with high-grade gliomas. TDL demonstrate a higher mean central NAA/Cr ratio owing to the lack of coagulative necrosis in the central aspect of TDL - a feature seen frequently in the centre of similar-sized gliomas.
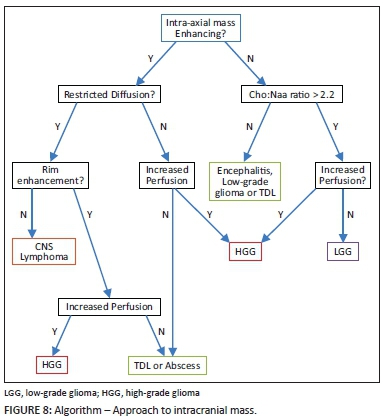
TDLs continue to prove to be a challenge to neurologists, radiologists and neuropathologists. Higher diagnostic accuracy is being reached through the use of advanced MRI techniques in order to obviate unnecessary brain biopsy and in particular to avoid lethal treatment options for erroneously diagnosed neoplasms after biopsy. In combination, imaging features of incomplete rim/ring enhancement, lack of mass effect, absence of cortical involvement and reduced CT attenuation of lesions (relative to grey matter) correlate with a high sensitivity and accuracy for TDL. More specific advanced MRI sequences such as reduced perfusion rCBV values, central vein sign, absence of restricted diffusion and central high NAA/Cr ratio are useful differentiating features. These tools are vital in the radiologists' armamentarium as shown in the algorithm (Figure 8) aiding the approach to an intracranial tumefactive lesion.9
Competing interests
The authors declare that they have no financial or personal relationships which may have inappropriately influenced them in writing this article.
Authors' contributions
S.M. (Lake Smit and Partners Inc.) created the quiz case, undertook the literature review and compiled the discussion on the topic presented. T.M. (Lake Smit and Partners Inc.) provided the case details and assisted with the literature review.
References
1. Rovira Cañellas A, Gols AR, Izquierdo JR, Subirana MT, Gairin XM. Idiopatic inflammatory-demyelinating disease of central nervous system. Neuroradiology. 2007;49:393-409. http://dx.doi.org/10.1007/s00234-007-0216-2 [ Links ]
2. Dagher AP, Smirniotopoulos J. Tumefactive demyelinating lesions. Neuroradiology. 1996;38:560-565. http://dx.doi.org/10.1007/BF00626098 [ Links ]
3. Given CA II, Stevens BS, Lee C. The MRI appearance of tumefactive demyelinating lesions. Am J Roentgenol. 2004;182:195-199. http://dx.doi.org/10.2214/ajr.182.1.1820195 [ Links ]
4. He J, Grossman RI, Ge Y, Mannon LJ. Enhancing patterns in multiple sclerosis: Evolution and persistence. AJNR 2001;22:664-669. [ Links ]
5. Kim DS, Na DG, Kim KH, et al. Distinguishing tumefactive demyelinating lesions from glioma or central nervous system lymphoma: Added value of unenhanced CT compared with conventional contrast-enhanced MR imaging. Radiology. 2009;251:467-475. http://dx.doi.org/10.1148/radiol.2512072071 [ Links ]
6. Cha S, Pierce S, Knopp EA, et al. Dynamic contrast-enhanced T2*-weighted MR imaging of tumefactive demyelinating lesions. AJNR 2001;22:1109-1116. [ Links ]
7. Cha S, Knopp EA, Johnson G, Wetzel SG, Litt AW, Zagzag D. Intracranial mass lesions: Dynamic contrast-enhanced susceptibility-weighted echo- planar perfusion MR imaging. Radiology. 2002;223:11-29. http://dx.doi.org/10.1148/radiol.2231010594 [ Links ]
8. Saindane AM, Cha S, Law M, Xue X, Knopp EA, Zagzag D. Proton MR spectroscopy of tumefactive demyelinating lesions. AJNR. 2002;23:1378-1386. [ Links ]
9. Al-Okaili RN, Krejza J, Wang S, Woo JH, Melhem ER. Advanced MR imaging techniques in the diagnosis of intraaxial brain tumors in adults. RadioGraphics 2006;26:S173-S189. http://dx.doi.org/10.1148/rg.26si065513 [ Links ]
 Correspondence:
Shalendra Misser
misser@lakesmit.co.za
Received: 22 Nov. 2015
Accepted: 01 Dec. 2015
Published: 05 Apr. 2016

