


Serviços Personalizados
Artigo
 Inglês (pdf)
 Artigo em XML
 Referências do artigo
Indicadores

Links relacionados
-
 Citado por Google
 -
 Similares em Google
Compartilhar

 Permalink
SA Journal of Radiology
versão On-line ISSN 2078-6778
versão impressa ISSN 1027-202X
S. Afr. J. radiol. (Online) vol.20 no.1 Johannesburg 2016
http://dx.doi.org/10.4102/sajr.v20i1.974
ORIGINAL RESEARCH
Multi-voxel proton magnetic resonance spectroscopy changes in neuropsychiatric lupus patients
Page I. WangI; Richard E. HarrisII; Thomas L. ChenevertIII; William J. McCuneIV; Pia C. SundgrenV
IAlta Vista Radiology, Paradise Valley, United States
IIDepartment of Anesthesiology, University of Michigan Hospital, United States
IIIDepartment of Radiology, University of Michigan Hospital, United States
IVDepartment of Rheumatology/Internal Medicine, University of Michigan Hospital, United States
VDepartment of Diagnostic Radiology, Lund University, Skane University Hospital, Sweden
ABSTRACT
PURPOSE: In this prospective study, we used 2D chemical shift imaging (CSI), a multi-voxel proton spectroscopy technique, to evaluate the brain metabolites on conventional magnetic resonance imaging (MRI) in normal-appearing white and grey matter in systemic lupus erythematosus (SLE) patients with neuropsychiatric symptoms (NPSLE); without neuropsychiatric symptoms (non-NPSLE); and healthy controls (HCs). Our objective was to find metabolites that discriminated NPSLE patients from the non-NPSLE and HC cohorts.
MATERIALS AND METHODS: The study included 23 NPSLE patients, 20 non-NPSLE patients, and 21 HCs. A clinical assessment including the SLE disease activity index (SLEDAI) and systemic lupus international collaborating clinics (SLICC) scores was conducted. All patients underwent conventional MRI and 2D CSI technique to acquire the following metabolic ratios: NAA/Cr, Cho/Cr, and Cho/NAA in the anterior and posterior insula, anterior frontal and parietal white and grey matter, thalamus, basal ganglia, and occipital grey matter.
RESULTS: In terms of metabolic differences, the NPSLE patients had significant differences compared with the non-NPSLE and HC groups in the: left posterior insula (increased Cho/NAA; p = 0.008), right internal capsule (increased Cho/Cr; p < 0.05), left thalamus (increased NAA/Cr; p = 0.011), anterior grey matter (increased NAA/Cr; p = 0.004), posterior grey matter (increased Cho/NAA; p = 0.016), anterior white matter (increased NAA/Cr; p = 0.012), and left posterior white matter (increased Cho/NAA; p = 0.022). The NPSLE patients showed significantly higher SLEDAI scores (p < 0.001).
CONCLUSION: We found several significant distinct metabolic differences between NPSLE and non-NPSLE/HC patients in various brain locations.
Systemic lupus erythematosus (SLE) is a chronic autoimmune disease afflicting numerous organs of the body, affecting 0.05% - 0.1% of the general population.1,2 Neuropsychiatric SLE (NPSLE) is one of the most severe manifestations of SLE, with increased morbidity and mortality.3
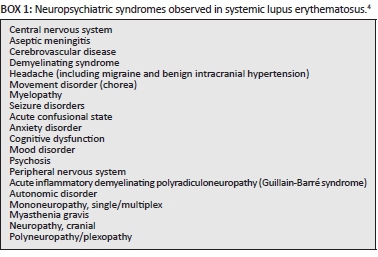
To be diagnosed with NPSLE, one must have SLE and one of the 19 symptoms/disorders as defined by the American College of Rheumatology (ACR) (Box 1).4 Unfortunately, many of the case definitions for NPSLE are common and nonspecific, such as anxiety disorder or headache, and this limits the specificity of NPSLE. Therefore, a more definitive, or quantitative approach would be helpful in diagnosing NPSLE for treatment, therapy and prognostic reasons.
Magnetic resonance imaging (MRI) is frequently used to diagnose or exclude main brain alterations and has become part of the routine clinical work-up of SLE patients to evaluate them for complications of the disease that may contribute to neurologic sequelae, and for helping to diagnose or exclude cerebral pathologies such as haemorrhage, cerebral venous thrombosis, or stroke. Abnormal conventional MRI findings are common in both SLE and NPSLE patients, and range from nonspecific small punctate focal hyperintense lesions in periventricular white matter, to more severe findings such as cortical atrophy, ventricular dilation, cerebral oedema, cerebral infarctions and intracranial haemorrhage.5,6 These findings are attributed to different mechanisms, including thrombosis, vasculopathy and antibody-mediated neuronal injury.
Although clinical assessment is the cornerstone of the NPSLE diagnosis, this diagnosis can be difficult to make and is frequently presumptive. Previous magnetic resonance spectroscopy (MRS) studies have demonstrated changes of the brain metabolites in SLE patients both in abnormal- and normal-appearing white matter and in more recent changes in glutamine and glutamate in the insular region in both SLE and NPSLE patients.7 Common metabolites previously evaluated are N-acetyl-aspartate (NAA) which is considered a marker for neuronal viability and function; creatine (Cr), a marker of cell energy and cell metabolism; and choline (Cho). Cho molecules derive largely from phosphorylcholine and glycerophosphorylcholine, which are precursors to cell membrane biosynthesis and breakdown.
In the present prospective study, we used 2D-chemical shift imaging (CSI), a multi-voxel proton spectroscopy technique, to evaluate the brain metabolites on conventional MRI in normal-appearing white and grey matter in SLE patients without (non-NPSLE) and with neuropsychiatric symptoms (NPSLE), and healthy controls (HCs). Our goal was to find metabolites that discriminate amongst these cohorts and look for correlations with clinical parameters and disease activity.
Material and methods
Subjects
Our prospective study included 23 consecutive female patients (age 23.7-69.8; mean age 42.4 years) with NPSLE, defined as ≥ 1 neuropsychiatric manifestations within 2 weeks prior to inclusion in the study; 20 consecutive SLE patients (18 female, 2 male, age 23.4-64.6; mean age 43.9 years) without current or past history of neuropsychiatric symptoms (non-NPSLE); and 21 HCs (19 female, 2 male, age 21.0-65.7; mean age 43.4 years). The classification of NPSLE was based on the 19 American College of Rheumatology 1997 case definitions.4 To participate in the study, individuals needed to meet ≥ 4 ACR classification criteria and present within 2 weeks of the initial neuropsychiatric event. All participants were recruited from the Department of Internal Medicine, Division of Rheumatology, and the Department of Emergency Medicine at the University of Michigan. Informed consent was obtained for all participants, and the study was approved by the local institutional review board. Exclusion criteria included previous and/or known drug abuse, alcohol abuse, diabetes, stroke and/or renal insufficiency.
Subjects' clinical assessment
All the patients and HCs were submitted to a standardised clinical and neurological examination including medical history (age, gender, race, age at disease onset, disease duration, smoking history, cardiovascular risk factors, etc.), physical examination, standard laboratory assessment and a mini-mental state examination. SLE and NPSLE patients underwent required laboratory tests to determine disease activity by the systemic lupus erythematosus disease activity index (SLEDAI).8 SLE was considered active with a SLEDAI score > 3. Disease duration was defined as the time between the diagnosis of SLE and the day of the MRI. Cumulative damage in both patient groups was assessed using the Systemic Lupus International Collaborating Clinics/American College of Rheumatology damage index (SLICC/ACR) at the time of MRI acquisition.9
MR imaging and MR spectroscopy
All subjects underwent conventional MRI pre- and post-contrast administration on a 3T scanner (Achieva MRI system, Philips, Best, Netherlands) with the following sequences: T1-weighted 3D turbo field echo images pre- and post-contrast enhancement, diffusion-weighted imaging, axial T2-weighted, and fluid-attenuated inversion recovery (FLAIR) images. Twenty mL of Gd-DTPA was intravenously injected before post-contrast enhanced images.
After the post-contrast images, 2D-chemical shift imaging MR spectroscopy (2D-CSI) was performed. The following parameters were used for the 2D-CSI spectroscopy: point-resolved spectroscopy (PRESS) sequence, TE/TR 144/2000 ms, field of view (FOV) 240, acquisition matrix 16 x 16, slice thickness 15 mm, and scan time 4.20 minutes. The volume of interest (VOI) was placed on the non-angled FLAIR or on the non-angled contrast-enhanced axial T1-weighted images. One VOI was placed at the level of the basal ganglia and a second VOI in the centrum semiovale. Multiple regions of interest (ROI) within the larger VOI were manually and systematically placed in the anterior and posterior insula, anterior frontal and parietal white and grey matter, thalamus, basal ganglia, and occipital grey matter bilaterally. Each individual ROI was carefully placed to minimise partial volume effects of surrounding structures. This was especially important when analysing the grey matter, and therefore all ROIs were placed in the same location in all the subjects. This procedure ensured that any possible contamination of white matter to grey matter measurements would be the same for all subjects and could be considered negligible. All the manually placed voxels were located in normal-appearing white and grey matter based on conventional MRI.
Imaging post-processing and analysis
Conventional MRI
Conventional MR images were interpreted by an attending neuroradiologist (27 years' experience) who was blinded to patient history and asked to comment on morphological abnormalities. Lesion burden in the form of white matter T2/FLAIR hyper-intensive lesions was defined as mild (1-5 small white matter lesions), moderate (5-10 white matter lesions), or severe (> 10 white matter lesions). Any clinically relevant findings on structural MRI were reported to the patient's primary physician.
2D-CSI analysis
LC-model10 is a well-known postprocessing analysis programme for single voxel spectroscopy (SVS) data but LC-model is not as suitable for 2D-CSI analysis. Therefore, as this was a 2D-CSI MRS study, the individual voxels were analysed using the manufacturer's software package for MRS analysis (Philips, Best, Netherlands) on an independent workstation. It is known that manually adjusted peak boundaries are more accurate than the manufacturer's default setting.11 Therefore, a visual review of the spectra was initially performed and, if needed, an adjustment of the individual peak edges was performed by a neuroradiologist experienced in MRS evaluation to ensure that the signal intensity was measured as the integration between the peak edges (surface under the peak). The individual metabolic peaks were carefully selected by the experienced neuroradiologist performing the spectra analysis to ensure that the whole peak was well defined. As long TE (144 ms) was used to collect the data, the baseline of the spectrum was fairly flat owing to lack of macromolecule contamination, and therefore the baseline of the spectrum was not subtracted from the peak integration. The mean signal-to-noise ratios of creatine and choline were estimated as 15-20, and the noise was defined as the root-mean-square of the values between 0.5 ppm and 1.0 ppm in the spectrum. No threshold was used in calculating the present data. The metabolic spectra were analysed for NAA, Cho and Cr metabolites, and the following ratios were calculated: NAA/Cr, Cho/Cr, and Cho/NAA.
Statistical evaluation
Regarding age, disease duration, SLEDAI and SLICC scores, as well as most laboratory data (except from the lupus anticoagulant), were compared using analysis of variance (ANOVA), for comparison of all three groups. For the longitudinal assessment of changes in metabolite levels, we used a repeated measures general linear model for each metabolite and compared baseline, 3-month, and 6-month follow-up values. Post hoc t-tests were used to determine which group (SLE, NPSLE or control) displayed different values. Non-parametric tests (chi-square) were applied to compare gender distribution, smoking history and cardiovascular risk factors. Statistical significance was set at p ≤ 0.05.
Results
Clinical manifestations, disease severity, and serological data
Seventeen diffuse neuropsychiatric manifestations and 7 focal manifestations were present in the NPSLE group, with 18 central and 2 peripheral events: psychosis (three), acute confusional state (six), cerebrovascular disease (five), headache (three) and cranial neuropathy (one). Nineteen out of 20 patients were acutely treated with intravenous and/or oral steroids. One patient was treated exclusively with selective serotonin reuptake inhibitors. Thirteen patients required the addition of immunosuppressive drugs.
SLE disease duration was longer in the NPSLE group (mean 7.8 years, range 0.7-23, SD 6.7) compared with the non-NPSLE group (4.7 years, range 0.6-15, SD 5.1); however, this difference did not achieve significance (p = 0.11). SLE disease activity was significantly higher in the NPSLE group, according to the SLEDAI score (p < 0.001). No differences were found in SLICC scores or mini-mental examinations between groups. Further details regarding patient demographics and disease activity are described in our previous paper.12
Conventional MRI
Conventional MR imaging demonstrated mild or moderate diffuse brain atrophy in 25% of the patients (16/64). One patient with non-NPSLE had a wedge-shaped area of encephalomalacia in the right frontal lobe, and one patient with NPSLE had an old infarct in the right frontal lobe. Mild lesion burden was seen in 70% of the non-NPSLE patients (14/20), moderate in 15% (3/20), and severe in 5% (1/20). Mild lesion burden was seen in 52.2% of the NPSLE patients (12/23), moderate in 21.7% (5/23), and severe in 13% (3/23). In the HC group, 6 patients had mild lesion burden, 1 patient had moderate lesion burden, and 1 patient had severe lesion burden. The non-NPSLE and NPSLE patients had significantly more white matter lesions (p = 0.01, p = 0.002, respectively) than the HCs. No significant differences were seen between NSPLE and non-NPSLE patients regarding white matter lesions.
2D-CSI MR spectroscopy
A one-way ANOVA of the 2D-CSI spectroscopy data revealed differences in metabolic ratios between the groups in different locations in the brain. The results are presented by the different locations.
Insula
The NAA/Cr ratio in the left anterior insula (LAINS) was lower in the NPSLE patients than in the HCs (p < 0.05), whilst in the left posterior insula (LPINS), Cho/NAA was significantly higher in NPSLE patients than in both the non-NPSLE and HC groups (ANOVA, p = 0.008). The latter figure seems driven by the significantly higher ratios in the NSPLE subjects, whilst no significant differences were seen between SLE and HC.
Internal capsule
In the right and left internal capsule (RIC, LIC), the Cho/Cr ratio was higher in NPSLE patients than in non-NPSLE and HCs (RIC p < 0.05, LIC p = 0.06), whilst the Cho/Cr ratios in the non-NPSLE patients did not significantly differ from those of the HCs. In the RIC, the NAA/Cr ratios demonstrated a trend to be higher in the NPSLE and non-NPSLE than in the HC group (ANOVA, p = 0.06).
Thalamus
In the left thalamus, the NAA/Cr ratios were significantly higher in the NPSLE than in the non-NPSLE and HC groups (p = 0.011). Also, the Cho/Cr ratio showed a trend to be higher in the NPSLE than in the non-NPSLE and HC groups (p = 0.057, p = 0.058, respectively) for both the left and right thalamus.
Anterior grey matter
In the right and left anterior grey matter, the Cho/Cr ratios seemed to have higher variability in the non-NPSLE than the NPSLE group. The Cho/Cr ratio was significantly higher in non-NPSLE patients than in the NPSLE and HC groups (p = 0.036) in the right anterior grey matter, and was also significantly higher in non-NPSLE than HC subjects in the left anterior grey matter (p = 0.043). NAA/Cr ratios were higher in the NPSLE than non-NPSLE (ANOVA, p = 0.004), with no significant differences between the HC and non-NPSLE groups. The Cho/NAA ratio was higher in the non-NPSLE than in the NPSLE and HC groups for both left and right anterior grey matter (ANOVA, p = 0.005, p = 001, respectively).
Posterior grey matter
In the left posterior grey matter, the Cho/NAA was higher in the NPSLE than the non-NPSLE patients and the HCs (ANOVA, p = 0.016). No significant differences were present between the non-NPSLE and HC groups.
Anterior white matter
In the right anterior white matter, the NAA/Cr ratio was higher in the NSPLE compared with the non-NPSLE and HC groups (ANOVA, p = 0.012). A lower NAA/Cr demonstrated a significant trend to higher SLEDAI score in the NPSLE patients. No differences between non-NPSLE and HC groups were seen.
Posterior white matter
In the left posterior white matter, the NAA/Cr ratio was higher in non-NPSLE than NPSLE (ANOVA, p = 0.024), and the Cho/NAA ratio was higher in NPSLE than in both non-NPSLE and HC groups (ANOVA, p = 0.022). In the right posterior white matter, there were no group differences with respect to metabolic ratios.
Longitudinal data
Sixteen of the 23 NPSLE patients completed the 3- and 6-months follow-up studies and demonstrated interval increase in the NAA/Cr and Cho/Cr ratios over time compared with baseline in the posterior insula, right and left internal capsule and right parietal white matter (p = 0.03). The SLEDAI score significantly decreased over the course of 6 months (13.07 [6.20]; 3.80 [2.86]; p = 0.001).
Conclusion
In the present study, we found several significant metabolic differences between NPSLE, non-NPSLE and HC patients in various brain areas. As mentioned previously, NAA is a marker for neuronal health and, as NPSLE patients are known to have cortical and central atrophy, we expected to see decreased NAA/Cr diffusely.
Looking at our results that showed differences between the NPSLE and the non-NPSLE/HC patients, we found significantly increased NAA/Cr in the left thalamus, left anterior grey matter, and right anterior white matter in NPSLE patients. This finding is the opposite of what we expected, but perhaps the increased NAA/Cr might be due to a compensatory hypertrophy of neurons after injury (similar to hypertrophic olivary degeneration), as recently described in a murine NPSLE study.13 Another possibility could be that Cr, a marker for cell energy and metabolism, was low in these areas, increasing the NAA/Cr ratio.
Other metabolic changes were seen in NPSLE patients that were significantly different from the non-NPSLE patients and HCs, such as increased Cho/Cr in the internal capsule and increased Cho/NAA in the left posterior insula and posterior grey matter. Choline (Cho) is a marker for membrane metabolism and cell proliferation, which may be altered in NPSLE patients in these areas.
We also found when we looked at the 16 patients who had 3- and 6-month follow-up studies that the NAA/Cr and Cho/Cr ratios increased over time. Interestingly, a recent study using PET found that NPSLE mice had decreased metabolism in the first two weeks and then increased metabolism thereafter.13 It is therefore possible that brain cellular metabolism is more dynamic than we originally assumed, and the exact timing of the MRI study after symptom onset is more critical than we realised.
The NPSLE patients had significantly increased SLEDAI scores than those of the non-NPSLE and HC patients, which is not surprising as these patients are more symptomatic. No significant differences were seen with conventional MRI, looking at the degree of white matter burden between the NPSLE and SLE patients.
In summary, we found several significant differences in brain metabolites comparing NPSLE with non-NPSLE and healthy patients; however, further study is needed to make sure that the relationships that we found are reproducible in larger patient cohorts, with attention to timing of the study relative to symptom onset.
Acknowledgements
The study was supported by the Department of Radiology Seed Grant U008039, the MICHR UL1RR024986, the Skåne University Foundation, and the Rheumatology Foundation of Sweden.
Competing interests
The authors declare that they have no financial or personal relationships which may have inappropriately influenced them in writing this article.
Authors' contributions
P.C.S. was the project leader. P.C.S., T.L.C., and P.I.W. were responsible for experimental and project design. W.J.M. was responsible for the recruitment of patients and clinical evaluation. P.C.S., P.I.W., and R.E.H. performed the analysis. P.C.S., and P.I.W., T.L.C., W.J.M. and R.E.H., all participated in the writing and preparation of the manuscript.
References
1. Somers EC, Richardson BC. Environmental exposures, epigenetic changes and the risk of lupus. Lupus. 2014;23:568-576. [ Links ]
2. Bernatsky S, Joseph L, Pineau CA, Tamblyn R, Feldman DE, Clarke AE. A population-based assessment of systemic lupus erythematosus incidence and prevalence-results and implications of using administrative data for epidemiological studies. Rheumatology. 2007;46:1814-1818. [ Links ]
3. Brey RL. Neuropsychiatric lupus: Clinical and imaging aspects. Bull NYU Hosp Jt Dis. 2007;65:194-199. [ Links ]
4. The American College of Rheumatology nomenclature and case definitions for neuropsychiatric lupus syndromes. Arthritis Rheum. 1999;42:599-608. [ Links ]
5. Appenzeller S, Vasconcelos Faria A, Li LM, Costallat LTL, Cendes F. Quantitative magnetic resonance imaging analyses and clinical significance of hyperintense white matter lesions in systemic lupus erythematosus patients. Ann Neurol. 2008;64:635-643. [ Links ]
6. Kozora E, Filley CM. Cognitive dysfunction and white matter abnormalities in systemic lupus erythematosus. J Int Neuropsychol Soc. 2011;17:385-392. [ Links ]
7. Cagnoli P, Harris RE, Frechtling D, et al. Reduced insular glutamine and N-acetylaspartate in systemic lupus erythematosus: A single-voxel (1)H-MR spectroscopy study. Acad Radiol. 2013;20:1286-1296. [ Links ]
8. Bombardier C, Gladman DD, Urowitz MB, Caron D, Chang CH. Derivation of the SLEDAI. A disease activity index for lupus patients. The Committee on Prognosis Studies in SLE. Arthritis Rheum. 1992;35:630-640. [ Links ]
9. Gladman DD, Goldsmith CH, Urowitz MB, et al. The Systemic Lupus International Collaborating Clinics/American College of Rheumatology (SLICC/ACR) damage index for systemic lupus erythematosus international comparison. J Rheumatol. 2000;27:373-376. [ Links ]
10. Provencher SW. Estimation of metabolite concentrations from localized in vivo proton NMR spectra. Magn Reson Med. 1993;30:672-679. [ Links ]
11. Petrou M, Sundgren PC, Pang Y, Rohrer S, Foerster B, Chenevert TL. Manually adjusted versus vendor-preset definition of metabolite boundaries. Acad Radiol. 2007;14:340-343. [ Links ]
12. Schmidt-Wilcke T, Cagnoli P, Wang P, et al. Diminished white matter integrity in patients with systemic lupus erythematosus. NeuroImage Clin. 2014;5:291-297. [ Links ]
13. Vo A, Volpe BT, Tang CC, et al. Regional brain metabolism in a murine systemic lupus erythematosus model. J Cereb Blood Flow Metab. 2014;34:1315-1320. [ Links ]
 Correspondence:
Pia Sundgren
pia.sundgren@med.lu.se
Received: 03 Jan. 2016
Accepted: 22 Mar. 2016
Published: 14 June 2016

