


Services on Demand
Article
 English (pdf)
 Article in xml format
 Article references
Indicators

Related links
-
 Cited by Google
 -
 Similars in Google
Share

 Permalink
Southern African Journal of HIV Medicine
On-line version ISSN 2078-6751
Print version ISSN 1608-9693
South. Afr. j. HIV med. (Online) vol.22 n.1 Johannesburg 2021
http://dx.doi.org/10.4102/sajhivmed.v22i1.1273
ORIGINAL RESEARCH
Geographical variation in HIV testing in South Africa: Evidence from the 2017 national household HIV survey
Sean JoosteI, II; Musawenkosi MabasoIII; Myra TaylorII; Alicia NorthI; Yolande SheanI; Leickness C. SimbayiI, IV; Tarylee ReddyV; Leonard MwandingiI, VI, VII; Tenielle SchmidtIII; Portia NevhungoniVIII; Samuel MandaVIII, IX; Khangelani ZumaX, XI
IHuman Sciences Research Council, Cape Town, South Africa
IISchool of Nursing and Public Health, University of KwaZulu-Natal, Durban, South Africa
IIIHuman Sciences Research Council, Durban, South Africa
IVDepartment of Psychiatry & Mental Health, University of Cape Town, Cape Town, South Africa
VSouth African Medical Research Council, Durban, South Africa
VIDivision of Epidemiology and Biostatistics, Stellenbosch University, Cape Town, South Africa
VIIMinistry of Health and Social Sciences, Windhoek, Namibia
VIIISouth African Medical Research Council, Pretoria, South Africa
IXDepartment of Statistics, University of Pretoria, Pretoria, South Africa
XHuman Sciences Research Council, Pretoria, South Africa
XISchool of Public Health, University of the Witwatersrand, Johannesburg, South Africa
ABSTRACT
BACKGROUND: Identification of the geographical areas with low uptake of HIV testing could assist in spatial targeting of interventions to improve the uptake of HIV testing
OBJECTIVES: The objective of this research study was to map the uptake of HIV testing at the district level in South Africa
METHOD: The secondary analysis used data from the Human Sciences Research Council's 2017 National HIV Prevalence, Incidence, Behaviour and Communication Survey, where data were collected using a multistage stratified random cluster sampling approach. Descriptive spatial methods were used to assess disparities in the proportion of those ever tested for HIV at the district level in South Africa
RESULTS: The districts with the highest overall coverage of people ever having tested for HIV (> 85%) include West Rand in Gauteng, Lejweleputswa and Thabo Mofutsanyane in Free State, and Ngaka Modiri Molema in North-West. These provinces also had the least variation in HIV testing coverage between their districts. Districts in KwaZulu-Natal had the widest variation in coverage of HIV testing. The districts with the lowest uptake of HIV testing were uMkhanyakude (54.7%) and Ugu (61.4%) in KwaZulu-Natal and Vhembe (61.0%) in Limpopo. Most districts had a higher uptake of HIV testing amongst female than male participants
CONCLUSION: The uptake of HIV testing across various districts in South Africa seems to be unequal. Intervention programmes must improve the overall uptake of HIV testing, especially in uMkhanyakude and Ugu in KwaZulu-Natal and Vhembe in Limpopo. Interventions must also focus on enhancing uptake of HIV testing amongst male participants in most districts. Strategies that would improve the uptake of HIV testing include HIV self-testing and community HIV testing, specifically home-based testing
Keywords: HIV; HIV testing; thematic mapping; districts; South African.
Introduction
Eastern and Southern Africa is home to 53% of the 36.9 million people living with HIV globally,1 with an estimated 75% of people living with HIV who actually knew their HIV status by the end of 2017.1
Furthermore, there was a 42% reduction of AIDS-related illnesses, as a result of the increase in HIV testing and treatment coverage between 2010 and 2017.1
South Africa has one of the largest HIV testing services (HTS), which is a crucial component of national HIV response.2 HIV testing services are vital in directing HIV-positive people to the treatment continuum, starting with antiretroviral therapy and, therefore, is critical in the fight against HIV.2 The Joint United Nations Programme on HIV (UNAIDS) launched the 90-90-90 targets stipulating that by 2020, 90% of people living with HIV should know their status, 90% of those who know their HIV-positive status should receive antiretroviral therapy and 90% of those on treatment have a suppressed viral load to end the epidemic by 2030. The UNAIDS has revised 2030 targets of 95-95-95, which are set out to be achieved by 2030.3
South Africa has made progress towards the UNAIDS 90-90-90 targets, especially regarding HIV testing and viral load suppression.4 Over the past decade, the country had made excellent progress in involving more people to test and become aware of their HIV status, after the launch of two national HIV testing initiatives: firstly, the national HIV testing and counselling (HTC) campaign that took place in 2010, and secondly, the HTC revitalisation strategy in 2013.5 As a result of these campaigns and other similar campaigns, more than 10 million people in South Africa test for HIV every year.5 In scaling up efforts around HTS interventions, civil society organisations continue to work with government departments in South Africa. The South African National AIDS Council continues to provide a platform for engagement between the civil society and government to work together on the HIV response.6
Although South Africa has made steady progress towards reaching the UNAIDS targets, many people affected with HIV are still unaware of their HIV status.7 Despite the availability of HTS, research studies have revealed that only a fraction of South Africans who are at risk get tested for HIV.8 Evidence shows that access to HTS may be limited geographically because of the inadequacy and heterogeneous distribution of available services.9,10 Achieving high coverage of HIV testing is critical for linking HIV-positive people to care across the country. Therefore, equitable geographical distribution of HTS is vital for achieving optimal coverage for HIV testing.10 This highlights the importance of conducting and collecting population-based HIV testing covereage data at the sub-national level needed for decision making.
In South Africa, gathering spatial data on HIV and mapping its distribution have been carried out in selected micro-geographical areas, limiting the generalisability of the findings to the country.11 The main source of estimating the number of people who tested for HIV in the country comes from the District Health Information System and from modelling.12 Both sources have limitations and rely on healthcare facility and programme data from districts to produce estimates.13,14 The current study used large-scale nationally representative population-based household survey data to describe the spatial coverage in the uptake of HIV testing amongst youth and adults 15 years and older. The aim of this research study was to identify the spatial gap in the uptake of testing in people who had ever tested for HIV at the district level in South Africa.
Methods
Study design and sampling
The data used in the secondary analysis were obtained from the National HIV Prevalence, Incidence, Behaviour and Communication Survey conducted in 2017.15 The survey used a multistage stratified, cluster randomised, cross-sectional design. The survey chose a systematic probability sample of 15 households randomly from 1000 small area layers (SALs), selected from 84 907 SALs released by Statistics South Africa in 2015.16 The sampling of SALs was stratified by province and locality type (urban formal, urban informal, rural formal and rural informal localities). An additional 457 SALs were sampled in 13 high-priority districts, which included iLembe, uMzinyathi, uThukela and King Cetshwayo in KwaZulu-Natal province; Ehlanzeni and Gert Sibande in Mpumalanga province; O.R. Tambo in the Eastern Cape province; Sekhukhune in Limpopo province; Bojanala Platinum in North-West province; and Ekurhuleni, Sedibeng, Tshwane and West Rand in Gauteng province. This study focused on the population aged 15 years and older who reported ever testing for HIV.
Measures
The primary outcome measure 'ever testing for HIV' was obtained from individuals who responded to the original survey question 'have you ever been tested for HIV?' The response was dichotomised into a binary outcome (yes = 1 and no = 0).
Ethical considerations
The survey protocol was approved by the Human Sciences Research Council's (HSRC) Research Ethics Committee (REC: 4/18/11/15), and the Associate Director for Science, Center for Global Health, Centres for Disease Control and Prevention (CDC). Ethical clearance was also obtained from the University of KwaZulu-Natal's Biomedical Research Ethics Committee (BE 646/18). Verbal or written informed consent was sought before undertaking both the behavioural data and blood specimen collection.
Statistical analysis
Statistical analysis was carried out in STATA 15.0 (Stata Corporation, College Station, TX, United States [US]) software.
Descriptive statistics were used to summarise the sample characteristics. Multilevel mixed-effects logistic regression models were used to estimate the excess probability of prior testing for HIV after adjusting for the effect of age and sex. District-level random effects predicted from the model, including age and sex were used to estimate the excess probability of prior testing. Results are shown with 95% confidence intervals (CI), and p-values < 0.05 were reported for all statistically significant associations. The proportion of the population, aged 15 years and older, that have ever been tested for HIV were geo-located using the South African district-level boundaries. The maps were generated in QGIS, version 3.14.10. An adjusted weight, benchmarked to the general population by age and sex at the national level, was computed to facilitate this analysis.
Results
Socio-demographic characteristics of the study sample
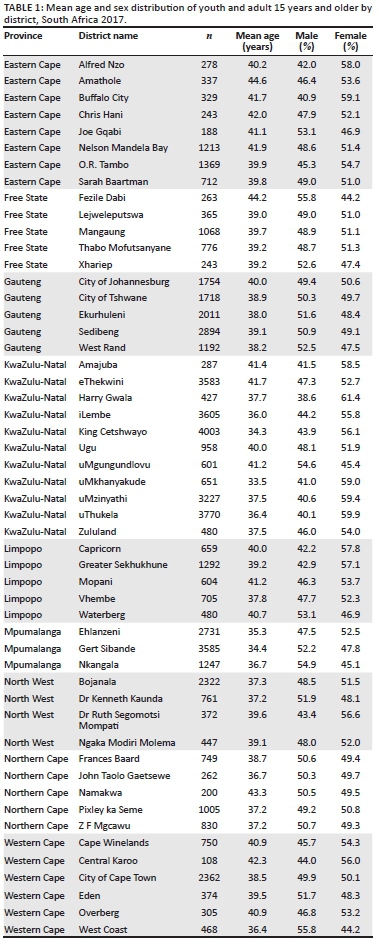
Table 1 shows the mean age and sex distribution amongst the respondents in all 52 districts. uMkhanyakude, King Cetshwayo (both in KwaZulu-Natal) and Gert Sibande in Mpumalanga had the youngest mean age of under 35 years. Amathole in the Eastern Cape, Fezile Dabi in Free State and Namakwa in the Northern Cape had the oldest mean age of 43 years. Harry Gwala, uThukela, uMzinyathi (all in KwaZulu-Natal) and Buffalo City in the Eastern Cape had the highest proportion of female participants (over 59%). Fezile Dabi in Free State, West Coast in Western Cape, Nkangala in Mpumalanga and uMgungundlovu in KwaZulu-Natal had the highest proportion of male participants (over 54%).
District-level coverage of ever being tested for HIV
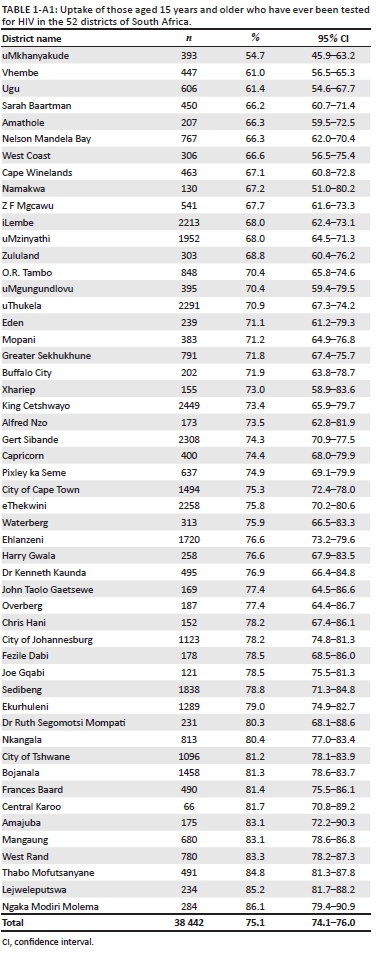
Figure 1 illustrates the geographical distribution of people who have ever been tested for HIV in the 52 districts of South Africa (Table 1-A1). The overall HIV testing uptake range was between 54.7% and 86.1%. Free State and North-West had more districts with an HIV testing coverage of over 80%, while no district in the Eastern Cape or Limpopo had an overall coverage higher than 80%.
Overall, uMkhanyakude (54.7%), Vhembe (61.0%) and Ugu (61.4%) districts had the lowest coverage for HIV testing. Ngaka Modiri Molema district (86.1%) reported the highest coverage for testing, followed by Lejweleputswa (85.2%) and Thabo Mofutsanyane (84.8%) district.
In the Eastern Cape, Joe Gqabi district had the highest overall coverage (78.5%), while Sarah Baartman district had the lowest (66.2%) coverage for HIV testing.
In the Free State, Lejweleputswa district had the highest testing uptake, followed by Thabo Mofutsanyane district, while Xhariep district (73.0%) had the lowest. In Gauteng, West Rand district had the highest coverage (83.3%), and the City of Johannesburg had the lowest coverage for testing (78.2%).
In KwaZulu-Natal, Amajuba district (83.1%) had the highest coverage, followed by Ugu district (61.4%), while uMkhanyakude district (54.7%) had the lowest coverage in the country. KwaZulu-Natal was the only province with a significant difference in testing coverage between its districts (P < 0.001).
In Limpopo, Waterberg district had the highest overall coverage (75.9%), while Vhembe district (61.1%) had the lowest coverage for testing. In Mpumalanga, Nkangala district had the highest overall coverage (80.4%), while Gert Sibande district (74.3%) had the lowest coverage for HIV testing. In North West, Ngaka Modiri Molema district (88.6%) had the highest coverage, while Dr Kenneth Kaunda district (76.9%) had the lowest coverage for testing. In the Northern Cape, Namakwa district (67.2%) had the lowest coverage, while Frances Baard district (81.4%) had the highest coverage.
In the Western Cape, Central Karoo district was the only district with over 80% coverage. In comparison, the West Coast and Cape Winelands district had the lowest coverage (< 70%), while the remaining districts' coverage ranged from 70% to 79%.
District-level coverage of ever being tested for HIV by sex
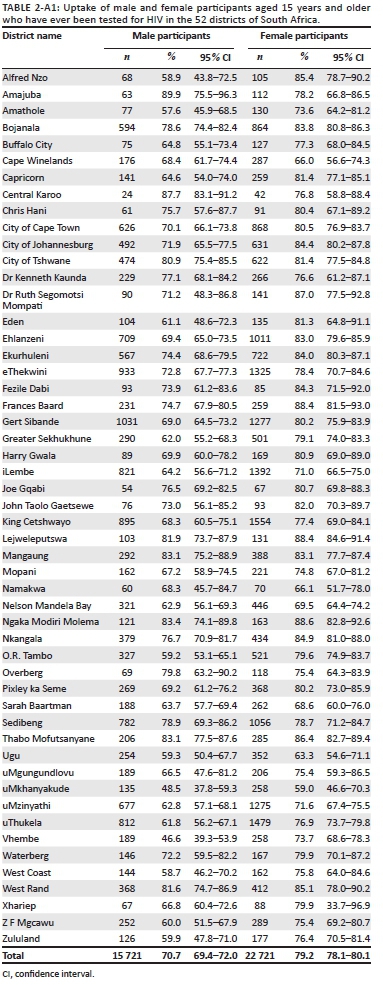
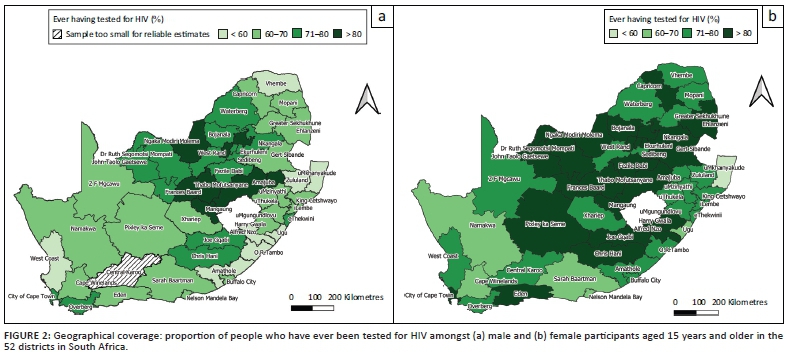
Figure 2 illustrates the geographical coverage of those who have ever been tested for HIV (Table 2-A1). The results are revealed for (1) male and (2) female participants, aged 15 years and older, across the 52 districts in South Africa. Overall, the maps show that female participants had coverage of over 80% in more districts than male participants. Female participants had a higher HIV testing rate of 20% more than male participants in Vhembe district (73.7% vs 46.6%), Eden (81.3% vs 61.1%), Alfred Nzo (85.5% vs 58.9%) and O.R. Tambo districts (79.6% vs 59.2%).
The proportion of female participants who had ever been tested for HIV ranged from 59.0% to 88.6%. uMkhanyakude district had the lowest proportion of female participants who had ever been tested for HIV (59.0%), followed by Ugu district (63.3%). Districts with the highest coverage of female participants who had ever been tested for HIV included Ngaka Modiri Molema (88.6%), Frances Baard (88.4%) and Lejweleputswa (88.4%). The coverage range of male participants who have ever been tested for HIV was 46.6% - 89.9%. Vhembe and uMkhanyakude were the only districts with < 50% coverage, that is, at 46.6% and 48.5%, respectively. Amajuba had the highest coverage (89.9%) of male participants who have ever been tested for HIV.
Adjusted coverage of ever being tested for HIV
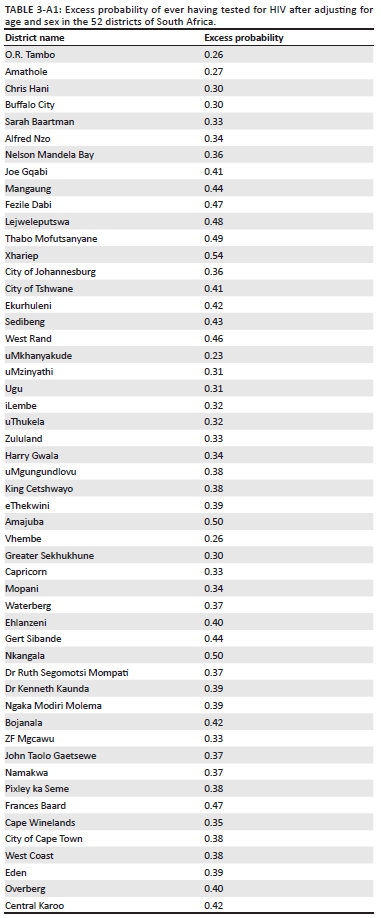
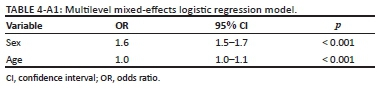
Figure 3 illustrates the geographical coverage of the excess probability of ever having tested for HIV in the 52 districts of South Africa after adjusting for age and sex (Table 3-A1). Both age and sex were significantly associated with previous testing (Table 4-A1). Specifically, female participants had a significantly higher odds of testing (OR: 1.59; 95% CI: 1.51-1.66) and a 1-year higher age associated with a 0.4% increase in the odds of testing. After adjusting for age and sex, the excess probability of ever having tested for HIV was different amongst the districts, illustrating that true heterogeneity (explained by variables other than sex and age) between the districts is present. The districts in Free State still had the highest probability for testing. Nkangala district had the second-highest probability for HIV testing. uMkhanyakude, Ugu, uMzinyathi, O.R. Tambo, Amathole, Chris Hani, Buffalo City, Vhembe and Greater Sekhukhune had the lowest probability for HIV testing.
Discussion
HIV testing is a crucial component of the national HIV response in South Africa.17 This study presents the first geographic analysis of youth and adults (≥ 15 years) who have ever been tested for HIV in South Africa using simple GIS mapping and data obtained from a cross-sectional nationally representative population-based survey.
The mapping results revealed that the uptake of HIV testing varied across the various districts in South Africa. The age and sex distribution across the districts were different. Studies have revealed that age and sex are crucial factors in HIV testing.18,19 The estimates from a multilevel model with district-level random effects showed that excess probability of ever having tested for HIV was different among the districts after adjusting for age and sex. Variations in the quality of healthcare services, health promotion activities, easier access to healthcare facilities and socio-economic status could have an impact on the uptake of HIV testing in districts.
The overall proportion of people who had ever tested for HIV at the district level in South Africa ranged from 54.7% to 86.1%. uMkhanyakude and Ugu districts in KwaZulu-Natal and Vhembe district in Limpopo had the lowest overall testing coverage of < 62%. Ngaka Modiri Molema district in North West, and Lejwelepuswa and Thabo Mofutsanyane districts both in Free State reported the highest coverage for HIV testing. None of the districts in the Eastern Cape or Limpopo had an overall coverage of higher than 80%. These districts are characterised as being predominately rural. Other studies have also found that people living in rural informal or tribal areas were significantly less likely to test for HIV when compared with those from urban areas.20,21 The finding that uptake of HIV testing was less likely amongst those in rural areas could be linked to limited resources and structural barriers to healthcare in terms of geographical and financial accessibility.22,23 Additional barriers included fear, discrimination and stigmatising attitudes, as well as lack of education and awareness.24
Another factor playing a major role in the higher coverage districts included the epidemic control plans implemented by the President's Emergency Plan for AIDS Relief (PEPFAR), which aims to achieve maximum impact and reach in areas with the highest burden of disease (COP19). This is informed by population-based surveillance. The PEPFAR country operational plan (COP) for 2017, in 27 districts with an estimated number of people living with HIV of 5.6 million, which account for 79% of number of people living with HIV in South Africa (COP19), identified 1969 sites for intensified support as part of the country's district-level implementation plan (DIP).25 According to the National Strategic Plan for 2012-2016,26 the objectives included maximising opportunities for testing and screening to ensure that everyone in South Africa got tested for HIV and was screened for TB. The overall investment for HTS programmes in 2016-2017 was $126 663 865.00, with the South African Government funding being 45% and PEPFAR funding 55% (COP-19).
Most districts had a higher coverage of ever having tested for HIV amongst female than male participants. uMkhanyakude and Ugu had the lowest coverage for female participants. Vhembe and uMkhanyakude had the lowest HIV testing coverage for male participants. Despite the countrywide scale-up, the observed geographic disparities in HIV testing are relevant from an epidemic control perspective, especially if the people who do not get tested are at higher risk of HIV infection.6 Therefore, achieving high coverage of HIV testing amongst men is critical in the fight against HIV in the country. However, data elsewhere suggest that boys and men are lagging.27,28 Men were found to have lower levels of participation in HIV testing.29 Some of these reasons include fear of damaging reputations, losing their masculine pride, fearing both community rejection and a loss of emotional control because of the psychological burden of knowing one was HIV positive.29 HIV testing programmes, therefore, need to carefully review who is being reached by their services and implement interventions specifically tailored to engage people who might be missed.
There are various settings in which HTS can be provided to the public and expanded further, for instance in healthcare facilities, such as hospitals, clinics and mobile clinics, and at community sites, be these stand-alone or even home-based services, where testing services are provided within the community.2 There is also an option for HIV self-testing (HIVST), which is carried out by an individual who wants to know his or her HIV status and is carried out privately by the individual alone.5 HIV self-testing provides an opportunity for testing to be carried out discreetly and at one's convenience, which could increase the uptake of HIV testing amongst those unable or unwilling to access other healthcare services.2 Concerns raised regarding HIVST include lack of HIV counselling,30 instructions are difficult to follow31 and there should be more of a focus on linkage to care.32
This research study has a few limitations. 'Ever testing' for HIV is self-reported, and therefore, prone to biases related to social desirability, recall and under-reporting. Nevertheless, the results of the nationally representative population-based survey can be generalised to adults aged 15 years and above who tested for HIV in South Africa. There may be a high degree of within-district heterogeneity. In future, work will include examining the sub-district level estimates applying the robust methodology of small area estimation, which involves using auxiliary predictors to improve the precision of imprecise district-level estimates.
Conclusion
This study demonstrated the utility of visually displaying spatial inequities in HIV testing using nationally representative data by presenting simple maps for targeted priority setting. The findings suggest that provinces and districts with low testing coverage, especially amongst male participants, should prioritise tailored interventions to improve uptake of HIV testing. The strategies for HTS should include scaling up of HIVST and community HIV testing, specifically home-based testing to improve the uptake of HIV testing in those districts that are lagging behind in order to ensure equity in the geographical coverage of HIV testing.
Acknowledgements
The authors thank study participants who allowed the survey fieldworkers into their households and provided the article information. They also thank the project team, especially the fieldwork teams who collected the survey data used in the analysis.
Competing interests
The authors declare that they have no financial or personal relationships that may have inappropriately influenced them in writing this article.
Authors' contributions
S.J. drafted the manuscript. S.J. and T.R. performed statistical analysis. L.M. and P.N. designed the maps. S.J., M.M., A.N., Y.S., M.T. and L.S. participated in the implementation of the survey that provided the data for the analysis. All authors contributed to the review of the draft manuscript and approved the final manuscript.
Funding information
This research work was supported by the President's Emergency Plan for AIDS Relief (PEPFAR) through the Centres for Disease Control and Prevention under the terms of Cooperative Agreement Number (NU2GGH001629), as well as the South African Department of Science and Technology, South African National AIDS Council (SANAC), Global Fund to Fight AIDS, Tuberculosis and Malaria, Right to Care, United Nations Children's Fund (UNICEF), Centre for Communication Impact, Soul City, and LoveLife.
Data availability
Data used in this analysis are available from HSRC's public data repository (data set). SABSSM 2017 Combined. Version 1.0. Pretoria South Africa: Human Sciences Research Council [producer] 2017, Human Sciences Research Council [distributor] 2020. https://doi.org/doi:10.14749/1585345902.
Disclaimer
The findings and conclusions of this research study are those of the authors and do not necessarily represent the official position of any affiliated agency of the authors or the funding agencies.
References
1. UNAIDS. Miles to go. Global AIDS update. Geneva: Joint United Nations Programme on HIV/AIDS; 2018. [ Links ]
2. NDOH. National HIV testing services: Policy 2016. Pretoria: National Department of Health; 2016. [ Links ]
3. UNAIDS. Understanding fast-track: Accelerating action to end the AIDS epidemic by 2030. Geneva: Joint United Nations Programme on HIV/AIDS; 2015. [ Links ]
4. Marinda E, Simbayi L, Zuma K, et al. Towards achieving the 90-90-90 HIV targets: Results from the South African 2017 national HIV survey. BMC Public Health. 2020;20(1):1375. https://doi.org/10.1186/s12889-020-09457-z [ Links ]
5. NDOH. Health sector HIV prevention strategy. Pretoria: National Department of Health; 2017. [ Links ]
6. SANAC. Let our actions count: South Africa's national strategic plan for HIV, TB and STIs 2017-2022. Pretoria: South African National AIDS Council; 2017. [ Links ]
7. Havlir DV, Balzer LB, Charlebois ED, et al. HIV testing and treatment with the use of a community health approach in rural Africa. N Engl J Med. 2019;381(3):219-229. https://doi.org/10.1056/NEJMoa1809866 [ Links ]
8. Kalichman SC, Simbayi LC. HIV testing attitudes, AIDS stigma, and voluntary HIV counselling and testing in a black township in Cape Town, South Africa. Sex Transm Infect. 2003;79(6):442-447. https://doi.org/10.1136/sti.79.6.442 [ Links ]
9. Chamla DD, Olu O, Wanyana J, et al. Geographical information system and access to HIV testing, treatment and prevention of mother-to-child transmission in conflict affected Northern Uganda. Confl Health. 2007;1:12. https://doi.org/10.1186/1752-1505-1-12 [ Links ]
10. Chen W, Zhou F, Hall BJ, et al. Is there a relationship between geographic distance and uptake of HIV testing services? A representative population-based study of Chinese adults in Guangzhou, China. PLoS One. 2017;12(7):e0180801. https://doi.org/10.1371/journal.pone.0180801 [ Links ]
11. Cuadros DF, Li J, Branscum AJ, et al. Mapping the spatial variability of HIV infection in sub-Saharan Africa: Effective information for localized HIV prevention and control. Sci Rep. 2017;7(1):9093. https://doi.org/10.1038/s41598-017-09464-y [ Links ]
12. SANAC. Republic of South Africa. 2018 global AIDS monitoring report. Analysis of current status and progress towards targets. Pretoria: South African National AIDS Council; 2018. [ Links ]
13. Garrib A, Stoops N, McKenzie A, et al. An evaluation of the District Health Information System in rural South Africa. S Afr Med J. 2008;98:549-552. [ Links ]
14. Van Schalkwyk C, Dorrington RE, Seatlhodi T, Velasquez C, Feizzadeh A, Johnson LF. Modelling of HIV prevention and treatment progress in five South African metropolitan districts. Sci Rep. 2021;11(1):5652. https://doi.org/10.1038/s41598-021-85154-0 [ Links ]
15. Simbayi LC, Zuma K, Zungu N, et al. South African national HIV prevalence, incidence, behaviour and communication survey, 2017. Cape Town: HSRC Press; 2019. [ Links ]
16. StatsSA. Mid-year population estimates 2017. Pretoria: Statistics South Africa; 2017. [ Links ]
17. Johnson LF, Van Rensburg C, Govathson C, Meyer-Rath G. Optimal HIV testing strategies for South Africa: A model-based evaluation of population-level impact and cost-effectiveness. Sci Rep. 2019;9(1):12621. https://doi.org/10.1038/s41598-019-49109-w [ Links ]
18. Maughan-Brown B, Venkataramani AS. Accuracy and determinants of perceived HIV risk among young women in South Africa. BMC Public Health. 2017;18(1):42. https://doi.org/10.1186/s12889-017-4593-0 [ Links ]
19. Mhlongo S, Dietrich J, Otwombe KN, Robertson G, Coates TJ, Gray G. Factors associated with not testing for HIV and consistent condom use among men in Soweto, South Africa. PLoS One. 2013;8(5):e62637. https://doi.org/10.1371/journal.pone.0062637 [ Links ]
20. Makusha T, Mabaso M, Richter L, Desmond C, Jooste S, Simbayi L. Trends in HIV testing and associated factors among men in South Africa: Evidence from 2005, 2008 and 2012 national population-based household surveys. Public Health. 2017;143:1-7. https://doi.org/10.1016/j.puhe.2016.10.017 [ Links ]
21. Magadi MA. Understanding the urban-rural disparity in HIV and poverty nexus: The case of Kenya. J Public Health. 2017;39(3):e63-e72. https://doi.org/10.1093/pubmed/fdw065 [ Links ]
22. Madiba S, Mokgatle M. Parents support implementation of HIV testing and counseling at school: Cross-sectional study with parents of adolescent attending high school in Gauteng and North West Provinces, South Africa. AIDS Res Treat. 2016;2016:4842814. https://doi.org/10.1155/2016/4842814 [ Links ]
23. Shamu S, Slabbert J, Guloba G, et al. Linkage to care of HIV positive clients in a community based HIV counselling and testing programme: A success story of non-governmental organisations in a South African district. PLoS One. 2019;14(1):e0210826. https://doi.org/10.1371/journal.pone.0210826 [ Links ]
24. Ncitakalo N, Mabaso M, Joska J, Simbayi L. Factors associated with external HIV-related stigma and psychological distress among people living with HIV in South Africa. SSM - Popul Health. 2021;14:100809. https://doi.org/10.1016/j.ssmph.2021.100809 [ Links ]
25. PEPFAR. South Africa country operational plan 2017 [homepage on the Internet]. [cited 2021 May 27] Available from: https://za.usembassy.gov/wp-content/uploads/sites/19/2017/03/SA-PEPFAR-COP-2017-Strategic-Directions-Summary-final-draft-16-March-2017-Public-Version.pdf [ Links ]
26. SANAC. National strategic plan on HIV, STIs and TB 2012-2016. Pretoria: South African National AIDS Council; 2011. [ Links ]
27. Madut DB, Manavalan P, Mtalo A, et al. Increasing the uptake of HIV testing among men in Tanzania: A novel intervention for bar patrons. AIDS Behav. 2021;25:2014-2022. https://doi.org/10.1007/s10461-020-03131-6 [ Links ]
28. Ziraba AK, Madise NJ, Kimani JK, et al. Determinants for HIV testing and counselling in Nairobi urban informal settlements. BMC Public Health. 2011;11:663. https://doi.org/10.1186/1471-2458-11-663 [ Links ]
29. Orr N, Hajiyiannis H, Myers L, et al. Development of a national campaign addressing South African men's fears about HIV counseling and testing and antiretroviral treatment. J Acquir Immune Defic Syndr. 2017;74(S69-S73). https://doi.org/10.1097/QAI.0000000000001204 [ Links ]
30. Spyrelis A, Abdulla S, Frade S, et al. Are women more likely to self-test? A short report from an acceptability study of the HIV self-testing kit in South Africa. AIDS Care. 2017;29(3):339-343. https://doi.org/10.1080/09540121.2016.1234687 [ Links ]
31. Peck RB, Lim JM, Van Rooyen H, et al. What should the ideal HIV self-test look like? A usability study of test prototypes in unsupervised HIV self-testing in Kenya, Malawi, and South Africa. AIDS Behav. 2014;18 Suppl 4:S422-S432. https://doi.org/10.1007/s10461-014-0818-8 [ Links ]
32. Hamilton A, Thompson N, Choko AT, et al. HIV self-testing uptake and intervention strategies among men in sub-Saharan Africa: A systematic review. Front Public Health. 2021;9(60):594298. https://doi.org/10.3389/fpubh.2021.594298 [ Links ]
 Correspondence:
Sean Jooste
sjooste@hsrc.ac.za
Received: 28 May 2021
Accepted: 21 July 2021
Published: 31 Aug. 2021
Appendix 1: Summary statistics and model output used in the secondary data analysis

