


Services on Demand
Article
 English (pdf)
 Article in xml format
 Article references
Indicators

Related links
-
 Cited by Google
 -
 Similars in Google
Share

 Permalink
Southern African Journal of HIV Medicine
On-line version ISSN 2078-6751
Print version ISSN 1608-9693
South. Afr. j. HIV med. (Online) vol.18 n.1 Johannesburg 2017
http://dx.doi.org/10.4102/sajhivmed.v18i1.694
ORIGINAL RESEARCH
Progress towards the 2020 targets for HIV diagnosis and antiretroviral treatment in South Africa
Leigh F. JohnsonI; Rob E. DorringtonII; Haroon MoollaI
ICentre for Infectious Disease Epidemiology and Research, University of Cape Town, South Africa
IICentre for Actuarial Research, University of Cape Town, South Africa
ABSTRACT
BACKGROUND: The UNAIDS targets for 2020 are to achieve a 90% rate of diagnosis in HIV-positive individuals, to provide antiretroviral treatment (ART) to 90% of HIV-diagnosed individuals and to achieve virological suppression in 90% of ART patients
OBJECTIVES: To assess South Africa's progress towards the 2020 targets and variations in performance by province
METHODS: A mathematical model was fitted to HIV data for each of South Africa's provinces, and for the country as a whole. Numbers of HIV tests performed in each province were estimated from routine data over the 2002-2015 period, and numbers of patients receiving ART in each province were estimated by fitting models to reported public and private ART enrolment statistics
RESULTS: By the middle of 2015, 85.5% (95% CI: 84.5% - 86.5%) of HIV-positive South African adults had been diagnosed, with little variation between provinces. However, only 56.9% (95% CI: 55.3% - 58.7%) of HIV-diagnosed adults were on ART, with this proportion varying between 50.8% in North West and 72.7% in Northern Cape. In addition, 78.4% of adults on ART were virally suppressed, with rates ranging from 69.7% in Limpopo to 85.9% in Western Cape. Overall, 3.39 million (95% CI: 3.26-3.52 million) South Africans were on ART by mid-2015, equivalent to 48.6% (95% CI: 46.0% - 51.2%) of the HIV-positive population. ART coverage varied between 43.0% in Gauteng and 63.0% in Northern Cape
CONCLUSION: Although South Africa is well on its way to reaching the 90% HIV diagnosis target, most provinces face challenges in reaching the remaining two 90% targets
Introduction
Expanded access to HIV testing and antiretroviral treatment (ART) is critical both to reducing levels of AIDS mortality and to reducing HIV incidence, at a population level. This is therefore the focus of the UNAIDS 2020 targets, which aim to achieve a 90% rate of diagnosis in people living with HIV, a 90% rate of ART coverage in HIV-diagnosed individuals and a 90% rate of virological suppression in patients on ART.1
However, few African countries have been able to report progress towards these '90-90-90' targets.2,3 Most household surveys conducted in African countries do not include questions about whether HIV-positive individuals know they are HIV-positive, which prevents estimation of the fraction of HIV-positive individuals who have been diagnosed. In addition, most African countries have only recently introduced virological monitoring of ART patients, and there is thus limited ability to report on progress towards the last 90% target. This means that the few African studies published to date have relied on special surveys for tracking progress towards the 90-90-90 targets,4,5 and almost none have made use of routine monitoring systems.6
In South Africa, it has been shown that by triangulating HIV testing data from a number of sources, it is possible to arrive at estimates of the fraction of HIV-positive adults who have been diagnosed positive.7 The South African ART programme has also recommended virological monitoring since its inception,8 and systems for reporting rates of virological suppression have been established.9,10 South Africa is therefore well placed to track its progress towards the 90-90-90 targets. This article aims to estimate progress towards the targets in the period up to 2015, at national and provincial levels.
Methods
Progress towards the 90-90-90 targets is estimated using the Thembisa model, a combined demographic and HIV model of the South African population. HIV disease progression prior to ART initiation is modelled using a staged model of CD4 decline, with rates of transition between CD4 stages set so that the modelled estimates of the fraction of HIV-positive adults in different CD4 stages match those observed in South African surveys, and HIV mortality assumptions by CD4 stage being set so that the model matches observed trends in mortality by age.11
As described previously, the model was fitted to national age-specific HIV prevalence data from antenatal surveys and household surveys to determine key sexual behaviour and HIV transmission parameters.12 Separate versions of the model were then created for each of the nine provinces. Key parameters that differed between provinces included the demographic assumptions, marriage rates, initial prevalence of male circumcision, fraction of the population in the 'high-risk' and 'low-risk' groups, sexual mixing between high- and low-risk groups, initial HIV prevalence and uptake of HIV services (HIV testing, prevention of mother-to-child transmission, ART, medical male circumcision and condoms). To allow for the uncertainty regarding a number of the behavioural parameters, a Bayesian approach was adopted in fitting the model to province-specific HIV prevalence data from antenatal and household surveys.13 The model estimates of HIV prevalence were in reasonable agreement with the provincial HIV prevalence data.13 The uncertainty regarding the behavioural parameters and the level of HIV prevalence in each province is reflected in the confidence intervals around the model estimates of diagnosis levels and ART coverage.
Modelling HIV testing
The modelling of HIV testing and diagnosis has been described previously.7 Briefly, individuals are assumed to get tested in one of three ways: through antenatal services (women only), through treatment of patients with opportunistic infections (OIs) and through other testing services. The model allows for provincial variation in rates of antenatal HIV testing based on data from the District Health Barometer reports14,15,16 and other surveys.17,18,19 Proportions of OI patients tested for HIV are assumed to be the same as assumed in the national model, for all provinces, because of lack of province-specific data. Province-specific rates of testing for other reasons are set in such a way that the model estimates of the total number of HIV tests are consistent with estimates of the annual total numbers of HIV tests performed in each province (Online Appendix Figure 4). These province-specific estimates of total HIV tests were derived by disaggregating previously estimated total numbers of HIV tests for the country as a whole.7 The totals were calculated for the public health sector, medical schemes, the life insurance industry and other private providers of HIV testing (e.g. workplace HIV testing programmes). Most of the public health sector statistics include provincial disaggregation (from 2004 to 2015), and these were used to calculate the numbers of individuals tested for HIV in the public sector in each province. Information is also available on the provincial profile of HIV testing by insurers20 and other private providers.21 In the case of medical schemes, data on the provincial profile of individuals tested were not directly available, but rates of HIV testing by province in the Discovery medical scheme22 were assumed to apply to other medical schemes in distributing the total HIV tests in medical schemes between provinces. For all three private sector data sources, the fraction of HIV tests in each province that was estimated was assumed to apply in all years, because of the lack of information on temporal changes in provincial distributions. Assumptions about the effect of age, sex and HIV testing history on rates of HIV testing were held constant at the levels estimated previously when the model was fitted to national HIV testing statistics.7
Modelling antiretroviral treatment uptake
The Thembisa model requires as inputs estimates of the total numbers of individuals starting ART in each year, split into three categories (children aged < 15 years, adult males and adult females). These estimates are derived from public sector statistics combined with biennial surveys of numbers of individuals treated in the private and NGO sectors.23 Public sector statistics included in the modelling are those from the Comprehensive Care, Management and Treatment (CCMT) reporting system,24 in the period prior to 2012, and the District Health Information System (DHIS),9,25 in the period from 2012 to 2015. Because of frequent 'self-transfer',26 many patients who move between ART services are incorrectly recorded as new ART patients, and reporting of 'new' ART enrolment is therefore not considered reliable. Instead, annual numbers of new ART patients are modelled using Bayesian B-splines,27,28 with the B-splines being fitted to produce estimates of current ART enrolment consistent with reported public and private statistics for each province (Online Appendix Figures 1-3). The model fitting procedure takes into account the change over time in the reporting of ART enrolment (from reporting cumulative enrolment in the period up to 2009 to reporting total current enrolment in subsequent periods, with allowance for provincial differences in the timing of the change in reporting). The model fitting procedure also takes into account possible errors in the reporting (e.g. late reporting and double-counting), with the spline functions 'smoothing out' fluctuations because of reporting errors, and with the extent of the fluctuations in the reported totals determining the 95% confidence interval widths. A more detailed statistical description of the B-spline fitting procedure is provided in Online Appendix 1. National ART enrolment was calculated by summing the province-specific totals.
Modelling viral suppression
Viral suppression is defined in the model as a viral load of less than 400 RNA copies/mL. The model input is the annual rate of viral suppression in patients starting ART with a CD4 count of < 200 cells/µL, and this rate is adjusted to allow for higher rates of viral suppression in patients starting ART at higher CD4 counts.29 The input parameters have been estimated from provincial DHIS statistics in 2013/2014, for patients who had been on ART for 48 months (viral load data were available for 55% of these patients).9 These rates were 73.4% in Eastern Cape, 80.1% in Free State, 72.5% in Gauteng, 84.2% in KwaZulu-Natal, 67.5% in Limpopo, 68.2% in Mpumalanga, 84.9% in North West, 75.8% in Northern Cape and 84.8% in Western Cape. Because of lack of historical data on viral suppression, the same input parameter was assumed to apply in all years.
The Thembisa model is programmed in C++, and all results presented are based on the C++ version of the model. An Excel version of the model, as well as outputs from the Excel model, is available for download from the Thembisa website (www.thembisa.org).
Results
By the middle of 2015, high levels of HIV diagnosis were achieved in South Africa, with an estimated 85.5% (95% CI: 84.5% - 86.5%) of HIV-positive adults diagnosed. Rates of HIV diagnosis were similar across provinces, ranging from 82.0% in Gauteng to 88.3% in KwaZulu-Natal (Figure 1a).
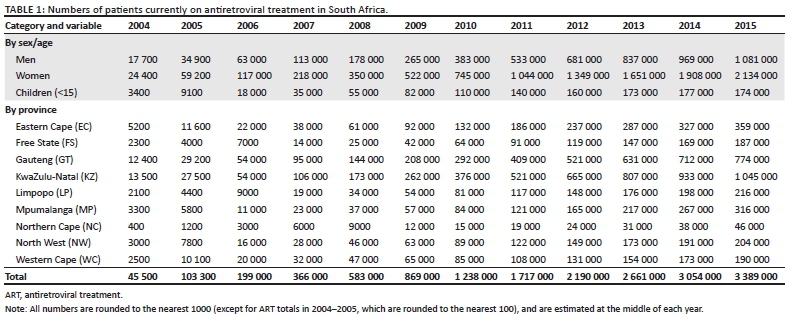
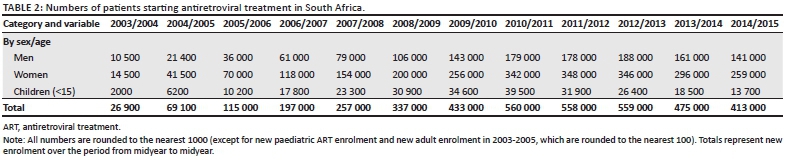
Table 1 shows that 3.39 million (95% CI: 3.26-3.52 million) South Africans were on ART by mid-2015, a more than 30-fold increase on the total in 2005 (103 300, 95% CI: 100 900-105 600). Approximately 287 000 ART patients in 2015 (8.5%) were receiving treatment from the private sector or NGOs. Over the period from mid-2010 to mid-2013, the annual number of new ART patients was relatively stable at around 560 000 per annum, but in the more recent years enrolment declined, reaching 413 000 (95% CI: 342 000-486 000) over the period from mid-2014 to mid-2015 (Table 2). The decline in annual new enrolment was particularly pronounced in children: from 39 500 (95% CI: 36 000-43 100) in 2010-2011 to 13 700 (95% CI: 9600-18 900) in 2014-2015.
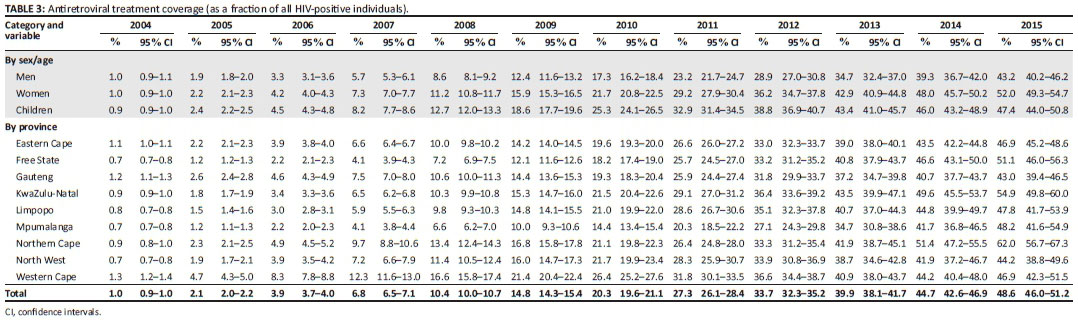
Expressed as a fraction of all HIV-positive individuals, ART coverage in South Africa in 2015 was 48.6% (95% CI: 46.0% - 51.2%), more than double the ART coverage in 2010 (Table 3). ART coverage was substantially higher in women (52.0%, 95% CI: 49.3% - 54.7%) than in men (43.2%, 95% CI: 40.2% - 46.2%), with coverage in children being between the two (47.4%, 95% CI: 44.0% - 50.8%). Coverage differed substantially by province, ranging from 43.0% (95% CI: 40.9% - 45.2%) in Gauteng to 62.0% (95% CI: 58.4% - 64.9%) in Northern Cape. Similar differences were observed when coverage was expressed as a fraction of all HIV-diagnosed adults: 56.9% (95% CI: 55.3% - 58.7%) of all HIV-diagnosed adults were on ART, with this proportion varying between 50.8% (95% CI: 47.5% - 54.6%) in North West and 72.7% (95% CI: 68.8% - 75.8%) in Northern Cape (Figure 1b).
The fraction of ART patients who were virologically suppressed was 78.4% nationally (Figure 1c). Rates of virological suppression differed substantially between provinces, ranging from 69.7% in Limpopo and 70.3% in Mpumalanga to 85.8% in North West and 85.9% in Western Cape. Overall, the fraction of HIV-positive adults who were on ART and virologically suppressed in 2015 was 38.2% (95% CI: 36.7% - 39.7%); the proportion varied from 31.8% (95% CI: 29.2%-34.4%) in Gauteng to 48.3% (95% CI: 45.4% - 50.7%) in Northern Cape (Figure 1d).
Expressed as a proportion of new HIV infections, new ART enrolment rose to 1.00 (95% CI: 0.94-1.06) in the 2009-2010 period, then continued to increase in the subsequent years as ART eligibility criteria were revised and as HIV incidence declined (Figure 2a). However, the enrolment ratio dropped from 1.66 (95% CI: 1.48-1.84) in 2012-2013 to 1.37 (95% CI: 1.10-1.67) in 2014-2015. Although the drop was not significant in adults, the enrolment ratio declined significantly in children, from 1.26 (95% CI: 1.14-1.39) in 2010-2011 to 0.65 (95% CI: 0.45-0.90) in 2014-2015 (Figure 2b).
Discussion
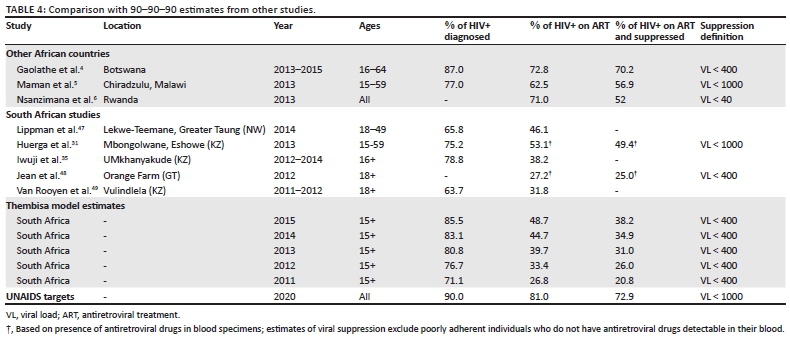
This study shows that South Africa has made good progress towards the first UNAIDS 90% target, with progress being relatively uniform across provinces. Progress towards the 90% diagnosis target is similar to that made in Botswana4 and the Chiradzulu district in Malawi5 (Table 4). However, progress towards the second and third UNAIDS 90% targets has been less impressive, with much variation between provinces. Despite its success in getting HIV-positive individuals diagnosed, South Africa has not achieved the high levels of ART coverage and viral suppression seen in Botswana, Rwanda and Malawi (Table 4).
These results are similar to the results of other South African surveys. The model estimate of the ART coverage in 2012 (33.7%, 95% CI: 32.3% - 35.2%) is consistent with the results of a national survey in the same year (31.2%, 95% CI: 28.1% - 34.5%).30 The model estimates that 26.0% of all HIV-positive adults were on ART and virally suppressed in 2012, which is consistent with an estimate of 24% based on estimates from the national laboratory system,10 as well as a smaller survey in Gauteng (Table 4). Estimates of ART coverage in other local household surveys are also consistent with model estimates (Table 4), although a survey conducted in Mbongolwane and Eshowe districts found higher ART coverage and viral suppression than expected, probably because special HIV interventions were introduced in these districts prior to the survey.31
Provincial differences in the scale-up of HIV testing and ART access may be partly explained by differences in budget allocations. In a recent analysis of HIV expenditure by province, it was found that the HIV expenditure per HIV-positive individual was highest in Northern Cape and Free State, and lowest in Gauteng and Mpumalanga.32 This could explain why progress towards the 90-90-90 targets is greatest in Northern Cape, whereas progress appears relatively poor in Gauteng and Mpumalanga (Figure 1). It is important that the underfunding of the HIV response in the latter group of provinces is corrected.
The slowdown in adult ART enrolment in recent years might be considered surprising, given the broadening of ART eligibility criteria in August 201133 and January 2015.34 Poor linkage to care following diagnosis is likely to be a key explanation; in a recent randomised trial in rural KwaZulu-Natal, less than half of HIV-positive adults not in care sought HIV care within six months.35 Even when linked to HIV care, adults with higher CD4 counts have significantly lower rates of ART initiation,36,37,38,39,40,41 and thus the broadening of ART eligibility criteria to include patients in higher CD4 categories may have less impact on enrolment than might be expected if patients at higher CD4 counts had the same rates of ART initiation as patients at lower CD4 counts. Simplified models for ART initiation may be required to increase the fraction of HIV-diagnosed adults on ART.42,43 In addition, further research is required to better understand the barriers to ART initiation in HIV-diagnosed individuals, particularly those at higher CD4 counts. Efforts to improve the transition from diagnosis to ART initiation should also focus particularly on poorly performing provinces such as North West and Gauteng (Figure 1b).
It is concerning that annual new ART enrolment in children has declined so substantially in the last five years. Although this is partly because of the success of prevention of mother-to-child transmission programmes, new enrolment has declined even when expressed as a fraction of annual new infections (Figure 2b). This might be because of inadequate HIV testing: Although great emphasis has been placed on HIV testing in early infancy,44 there has been little focus on HIV testing in children after infancy and in children who are not known to have been exposed to HIV. It is likely that an increasingly high fraction of mother-to-child transmission is postnatal transmission and transmission from mothers who have not been diagnosed positive, and thus an increasingly high fraction of transmission is likely to be missed by the current screening strategy. In addition, national HIV testing statistics and targets until recently excluded testing under the age of 15,45,46 and the absence of any monitoring of HIV testing in the 1-14 year age group means that it has not been possible to produce estimates of the fraction of HIV-positive children who have been diagnosed. A limitation of this study is therefore that it does not assess progress towards the 90-90-90 targets in children - a limitation common to most studies (Table 4). It is important that children are not neglected in the scale-up of HIV testing and ART,50 and there is an urgent need for better monitoring of HIV testing and diagnosis in children.
Viral suppression has been identified as the most important determinant of future HIV incidence trends in South Africa,12 and it is therefore concerning that rates of viral suppression are as low as 70% in Limpopo and Mpumalanga. Efforts to improve viral suppression could include adherence support interventions,51 community-supported models of care to improve retention,52 better supply chain management to avoid drug stock-outs and potentially new drugs, such as dolutegravir.53 Efforts are also required to monitor viral suppression more thoroughly, as the data on which these model estimates are based represent only 55% of adults starting ART in 2009-2010 who were followed up in 2013-2014 (the fraction of patients who had viral load results varied between 42% in Limpopo and 65% in Eastern Cape). Although viral suppression statistics are also available at other ART durations, these are generally similar to the rates at 48 months, and are based on less complete information.9 A limitation of this analysis is that it does not quantify the uncertainty because of the incomplete viral load data, but it is anticipated that it will be possible to produce confidence intervals for the modelled rate of viral suppression in future, as more data become available. To be consistent with the published statistics, we have used a viral load threshold of 400 copies/mL in defining suppression, although guidelines issued by the WHO54 and Global AIDS Response Progress Reporting55 recommend using a threshold of 1000 copies/mL. The Thembisa model estimates that using a threshold of 1000 copies/mL would increase the rate of viral suppression in 2015 from 78.4% to 81.7%.
Another limitation is that the confidence intervals around the provincial ART coverage estimates are too wide to draw firm conclusions about the relative performance of the different provinces. The wide confidence intervals are mainly because of erratic and infrequent reporting of ART totals in recent years (see Online Appendix 1). Further work is required to correct anomalies in the DHIS data and to integrate more frequent DHIS estimates into the Thembisa model fitting procedure, which should lead to narrower confidence intervals. An additional limitation is that the ART enrolment ratio that we have proposed56 may become meaningless in future if the annual number of new infections (the denominator in the calculation) declines towards zero. A strength of this analysis is that it employs a fully integrated HIV transmission and survival model, unlike previous analyses of ART coverage in South Africa, which have relied on independent models to estimate HIV incidence and HIV survival.57,58 This study estimates slightly lower levels of ART uptake than estimated previously (e.g. 1.72 million on ART in 2011 compared to 1.79 million [95% CI: 1.65-1.93 million]57) because the earlier study assumed an immediate transition from reporting cumulative totals to reporting current totals in 2009, when in fact the transition occurred more gradually in some provinces.
Achieving the 90-90-90 targets will require that at least 73% of HIV-positive individuals are on ART and virally suppressed by 2020. With the proportion treated and suppressed at 38% in 2015, South Africa still has a long way to go towards meeting the targets. However, the successes seen in Botswana, Rwanda and Malawi offer hope that the targets can be achieved, and South Africa needs to learn from these success stories if it is to maximise the impact of its ART programme.
Acknowledgements
This research was funded by the South African National AIDS Council. We are grateful to Mary-Ann Davies for providing helpful comments on an earlier version of this article. Funding Information: South African National AIDS Council.
Competing interests
The authors declare that they have no financial or personal relationships that may have inappropriately influenced them in writing this article.
Authors' contributions
L.J. developed the mathematical model, set the epidemiological input parameters for each province and drafted the first version of this article. R.D. set the demographic parameters for each province. H.M. ran the model simulations and assisted in data collection. All authors assisted in the drafting of this manuscript.
References
1. UNAIDS. Ambitious treatment targets: Writing the final chapter of the AIDS epidemic [homepage on the Internet]. Geneva; 2014 [cited 2014 Aug 19]. Available from: http://www.unaids.org/en/media/unaids/contentassets/documents/unaidspublication/2014/JC2670_UNAIDS_Treatment_Targets_en.pdf [ Links ]
2. Kelly SL, Wilson DP. HIV cascade monitoring and simple modeling reveal potential for reductions in HIV incidence. J Acquir Immune Defic Syndr. 2015;69(3):257-263. https://doi.org/10.1097/QAI.0000000000000655 [ Links ]
3. Levi J, Raymond A, Pozniak A, Vernazza P, Kohler P, Hill A. Can the UNAIDS 90-90-90 target be achieved? Analysis of 12 national level HIV treatment cascades [Abstract MOAD0102]. Eighth International AIDS Society Conference on HIV Pathogenesis, Treatment and Prevention; 2015 Jul 19-22; Vancouver, Canada. [ Links ]
4. Gaolathe T, Wirth KE, Holme MP, et al. Botswana's progress toward achieving the 2020 UNAIDS 90-90-90 antiretroviral therapy and virological suppression goals: A population-based survey. Lancet HIV. 2016;3(5):e221-e230. https://doi.org/10.1016/S2352-3018(16)00037-0 [ Links ]
5. Maman D, Chilima B, Masiku C, et al. Closer to 90-90-90. The cascade of care after 10 years of ART scale-up in rural Malawi: A population study. J Int AIDS Soc. 2016;19(1):20673. https://doi.org/10.7448/IAS.19.1.20673 [ Links ]
6. Nsanzimana S, Kanters S, Remera E, et al. HIV care continuum in Rwanda: A cross-sectional analysis of the national programme. Lancet HIV. 2015;2(5):e208-e215. https://doi.org/10.1016/S2352-3018(15)00024-7 [ Links ]
7. Johnson LF, Rehle TM, Jooste S, Bekker LG. Rates of HIV testing and diagnosis in South Africa, 2002-2012: Successes and challenges. AIDS. 2015;29:1401-1409. https://doi.org/10.1097/QAD.0000000000000721 [ Links ]
8. Department of Health. Operational plan for comprehensive HIV and AIDS care, management and treatment for South Africa [homepage from the Internet]. 2003 [cited 2003 Nov 28]. Available from: www.info.gov.za/otherdocs/2003/aidsplan.pdf [ Links ]
9. Department of Health. ART Programme Analysis: Reviewing the ART programme from April 2004 to March 2014. Pretoria; 2015. [ Links ]
10. Takuva S, Brown AE, Pillay Y, Delpech V, Puren AJ. The continuum of HIV care in South Africa: Implications for achieving the second and third UNAIDS 90-90-90 targets. AIDS. 2017;31(4):545-552. https://doi.org/10.1097/QAD.0000000000001340 [ Links ]
11. Johnson L. THEMBISA version 1.0: A model for evaluating the impact of HIV/AIDS in South Africa [homepage from the Internet]. Centre for Infectious Disease Epidemiology and Research, University of Cape Town; 2014 [cited 2016 April 21]. Available from: http://www.thembisa.org/content/downloadPage/WPversion1 [ Links ]
12. Johnson LF, Chiu C, Myer L, et al. Prospects for HIV control in South Africa: A model-based analysis. Glob Health Action. 2016;9:30314. https://doi.org/10.3402/gha.v9.30314 [ Links ]
13. Johnson LF, Dorrington RE, Moolla H. Modelling the impact of HIV in South Africa's provinces. [homepage on the Internet]. University of Cape Town; 2016 [cited 2016Aug 24]. Available from: http://www.thembisa.org/content/downloadPage/Provinces2016 [ Links ]
14. Massyn N, Day C, Barron P, Haynes R, English R, Padarath A. District Health Barometer 2011/12 [homepage from the Internet]. Durban: Health Systems Trust; 2013 [cited 2013 Oct 23]. Available from: http://www.hst.org.za/publications/district-health-barometer-201112 [ Links ]
15. Day C, Monticelli F, Barron P, Haynes R, Smith J, Sello E. District Health Barometer: Year 2008/09 [homepage on the Internet]. Durban: Health Systems Trust; 2010 [cited 2010 Jun 25]. Available from: http://www.hst.org.za/publications/864 [ Links ]
16. Day C, Barron P, Monticelli F, Sello E. District Health Barometer 2007/08: Health Systems Trust [homepage from the Internet]. 2009 [cited 2009 Jul 10]. Available from: http://www.hst.org.za/publications/850 [ Links ]
17. McCoy D, Besser M, Visser R, Doherty T. Interim findings on the national PMTCT pilot sites: Lessons and recommendations [homepage on the Internet]. Durban: Health Systems Trust; 2002 [cited 2006 Apr 9]. Available from: http://www.hst.org.za/publications/478 [ Links ]
18. Ramkissoon A, Kleinschmidt I, Beksinska M, Smit J, Hlazo J, Mabude Z. National baseline assessment of sexually transmitted infection and HIV services in South African public sector health facilities [homepage on the Internet]. Durban: Reproductive Health Research Unit; 2004 [cited 2004 Feb 13]. Available from: http://www.rhru.co.za [ Links ]
19. Reagon G, Irlam J, Levin J. The National Primary Health Care Facilities Survey 2003 [homepage on the Internet]. Durban: Health Systems Trust; 2004 [cited 2010 Aug 6]. Available from: http://www.hst.org.za/publications/617 [ Links ]
20. Swiss Re. Swiss Re HIV Testing Survey 2011: Report for the ASSA AIDS Committee. 2012. [ Links ]
21. Bizwell. Bizwell Stakeholder Report [homepage on the Internet]. 2012 [cited 2014 May 5]. Available from: http://www.bizwell.co.za/documents/newsLinks/Bizwell%20Report%201%20July%202012.pdf [ Links ]
22. Adonis L, An R, Luiz J, et al. Provincial screening rates for chronic diseases of lifestyle, cancers and HIV in a health-insured population. S Afr Med J. 2013;103(5):309-312. https://doi.org/10.7196/SAMJ.6686 [ Links ]
23. Johnson LF, McLeod HD. Steady growth in antiretroviral treatment provision by disease management and community treatment programmes. S Afr Med J. 2007;97(5):358-359. [ Links ]
24. Department of Health. Annual Health Statistics 2012 [homepage on the Internet]. 2013 [cited 2016 Sept 20]. Available from: http://www.hst.org.za/sites/default/files/AnnualHealthStatistics2012_Aug2013.pdf [ Links ]
25. Department of Health. Health indicators update: Antiretroviral indicators [homepage on the Internet]. 2013 [cited 2014 May 14]. Available from: http://www.health.gov.za/reports.php [ Links ]
26. Wilkinson LS, Skordis-Worrall J, Ajose O, Ford N. Self-transfer and mortality amongst adults lost to follow-up in ART programmes in low- and middle-income countries: Systematic review and meta-analysis. Trop Med Int Health. 2015;20(3):365-379. https://doi.org/10.1111/tmi.12434 [ Links ]
27. Lang S, Brezger A. Bayesian P-splines. J Comput Graph Stat. 2004;13(1):183-212. https://doi.org/10.1198/1061860043010 [ Links ]
28. Hogan DR, Zaslavsky AM, Hammitt JK, Salomon JA. Flexible epidemiological model for estimates and short-term projections in generalised HIV/AIDS epidemics. Sex Transm Infect. 2010;86(Suppl 2):ii84-ii92. https://doi.org/10.1136/sti.2010.045104 [ Links ]
29. Fox MP, Van Cutsem G, Giddy J, et al. Rates and predictors of failure of first-line antiretroviral therapy and switch to second-line ART in South Africa. J Acquir Immune Defic Syndr. 2012;60(4):428-437. https://doi.org/10.1097/QAI.0b013e3182557785 [ Links ]
30. Shisana O, Rehle T, Simbayi LC, et al. South African National HIV Prevalence, Incidence, and Behaviour Survey, 2012 [homepage on the Internet]. Cape Town: Human Sciences Research Council; 2014 [cited 2014 Apr 16]. Available from: http://www.hsrc.ac.za/en/research-outputs/view/6871 [ Links ]
31. Huerga H, Van Cutsem G, Ben Farhat J, et al. Who needs to be targeted for HIV testing and treatment in KwaZulu-Natal? Results from a population-based survey. J Acquir Immune Defic Syndr. 2016;73(4):411-418. https://doi.org/10.1097/QAI.0000000000001081 [ Links ]
32. Guthrie T. South African provincial and district spending on HIV: Results for development 2016. Forthcoming. [ Links ]
33. Department of Health. The South African antiretroviral treatment guidelines 2013 [homepage on the Internet]. 2013 [cited 2014 Apr 29]. Available from: http://www.kznhealth.gov.za/medicine/2013_art_guidelines.pdf [ Links ]
34. Department of Health. National consolidated guidelines for the prevention of mother-to-child transmission of HIV and the management of HIV in children, adolescents and adults [homepage on the Internet]. Pretoria; 2015 [cited 2015 Aug 12]. Available from: http://www.health.gov.za/index.php/2014-03-17-09-09-38/policies-and-guidelines/category/230-2015p [ Links ]
35. Iwuji CC, Orne-Gliemann J, Larmarange J, et al. Uptake of home-based HIV testing, linkage to care, and community attitudes about ART in rural KwaZulu-Natal, South Africa: Descriptive results from the first phase of the ANRS 12249 TasP cluster-randomised trial. PLoS Med. 2016;13(8):e1002107. https://doi.org/10.1371/journal.pmed.1002107 [ Links ]
36. Chiu C, Bor J, Ahmed S, et al. HIV treatment refusal in patients with high CD4 counts: Evidence from demographic surveillance in rural KwaZulu-Natal [WEPEC182]. Twenty-first International AIDS Conference; 2016 Jul 18-22; Durban, South Africa. [ Links ]
37. Mujugira A, Celum C, Thomas KK, et al. Delay of antiretroviral therapy initiation is common in East African HIV-infected individuals in serodiscordant partnerships. J Acquir Immune Defic Syndr. 2014;66(4):436-442. https://doi.org/10.1097/QAI.0000000000000192 [ Links ]
38. Katz IT, Dietrich J, Tshabalala G, et al. Understanding treatment refusal among adults presenting for HIV-testing in Soweto, South Africa: A qualitative study. AIDS Behav. 2015;19(4):704-714. https://doi.org/10.1007/s10461-014-0920-y [ Links ]
39. Aliyu MH, Blevins M, Parrish DD, et al. Risk factors for delayed initiation of combination antiretroviral therapy in rural north central Nigeria. J Acquir Immune Defic Syndr. 2014;65(2):e41-e49. https://doi.org/10.1097/QAI.0b013e31829ceaec [ Links ]
40. Odeny TA, DeCenso B, Dansereau E, et al. The clock is ticking: The rate and timeliness of antiretroviral therapy initiation from the time of treatment eligibility in Kenya. J Int AIDS Soc. 2015;18:20019. https://doi.org/10.7448/IAS.18.1.20019 [ Links ]
41. Geng EH, Bwana MB, Muyindike W, et al. Failure to initiate antiretroviral therapy, loss to follow-up and mortality among HIV-infected patients during the pre-ART period in Uganda. J Acquir Immune Defic Syndr. 2013;63(2):e64-e71. https://doi.org/10.1097/QAI.0b013e31828af5a6 [ Links ]
42. Rosen S, Maskew M, Fox MP, et al. Initiating antiretroviral therapy for HIV at a patient's first clinic visit: The RapIT randomized controlled trial. PLoS Med. 2016;13(5):e1002015. https://doi.org.10.1371/journal.pmed.1002015 [ Links ]
43. Wilkinson L, Duvivier H, Patten G, et al. Outcomes from the implementation of a counselling model supporting rapid antiretroviral treatment initiation in a primary healthcare clinic in Khayelitsha, South Africa. S Afr J HIV Med. 2015;16(1):367. https://doi.org/10.4102/sajhivmed.v16i1.367 [ Links ]
44. Sherman GG, Lilian RR, Bhardwaj S, Candy S, Barron P. Laboratory information system data demonstrate successful implementation of the prevention of mother-to-child transmission programme in South Africa. S Afr Med J. 2014;104(3 Suppl 1):235-258. https://doi.org/10.7196/SAMJ.7598 [ Links ]
45. Department of Health. Annual performance plan: 2014/15-2016/17 [homepage on the Internet]. 2014 [cited 2014 Aug 20]. Available from: http://www.health.gov.za/docs/strategic/2013/app201415.pdf [ Links ]
46. Department of Health. Annual report 2013-2014 [homepage on the Internet]. 2014 [cited 2015 Jan 25]. Available from: http://www.health.gov.za/annualreports.php [ Links ]
47. Lippman SA, Shade SB, El Ayadi AM, et al. Attrition and opportunities along the HIV care continuum: Findings from a population-based sample, North West Province, South Africa. J Acquir Immune Defic Syndr. 2016;73(1):91-99. https://doi.org/10.1097/QAI.0000000000001026 [ Links ]
48. Jean K, Puren A, Cutler E, et al. Level of viral suppression and the cascade of HIV care in a South African semi-urban setting in 2012. AIDS. 2016;30(13):2107-2116. https://doi.org/10.1097/QAD.0000000000001155 [ Links ]
49. van Rooyen H, Barnabas RV, Baeten JM, et al. High HIV testing uptake and linkage to care in a novel program of home-based HIV counseling and testing with facilitated referral in KwaZulu-Natal, South Africa. J Acquir Immune Defic Syndr. 2013;64(1):e1-e8. https://doi.org.10.1097/QAI.0b013e31829b567d [ Links ]
50. Davies MA, Pinto J. Targeting 90-90-90 - Don't leave children and adolescents behind. J Int AIDS Soc. 2015;18 (Suppl 6):20745. https://doi.org/10.7448/IAS.18.7.20745 [ Links ]
51. Bärnighausen T, Chaiyachati K, Chimbindi N, Peoples A, Haberer J, Newell ML. Interventions to increase antiretroviral adherence in sub-Saharan Africa: A systematic review of evaluation studies. Lancet Infect Dis. 2011;11(12):942-951. https://doi.org/10.1016/S1473-3099(11)70181-5 [ Links ]
52. Bemelmans M, Baert S, Goemaere E, et al. Community-supported models of care for people on HIV treatment in sub-Saharan Africa. Trop Med Int Health. 2014;19(8):968-977. https://doi.org/10.1111/tmi.12332 [ Links ]
53. Walmsley SL, Antela A, Clumeck N, et al. Dolutegravir plus abacavir-lamivudine for the treatment of HIV-1 infection. N Engl J Med. 2013;369(19):1807-1818. https://doi.org/10.1056/NEJMoa1215541 [ Links ]
54. World Health Organization. Consolidated strategic information guidelines for HIV in the health sector [homepage on the Internet]. 2015 [cited 2016 Aug 18]. Available from: http://apps.who.int/iris/bitstream/10665/164716/1/9789241508759_eng.pdf [ Links ]
55. UNAIDS. Global AIDS response progress reporting 2016: Construction of core indicators for monitoring the 2011 United Nations Political Declaration on HIV and AIDS [homepage on the Internet]. Geneva; 2016 [cited 2016 Aug 18]. Available from: https://aidsreportingtool.unaids.org/static/docs/GARPR_Guidelines_2016_EN.pdf [ Links ]
56. Johnson LF, Boulle A. How should access to antiretroviral treatment be measured? Bull World Health Organ. 2011;89:157-160. https://doi.org/10.2471/BLT.10.080911 [ Links ]
57. Johnson LF. Access to antiretroviral treatment in South Africa, 2004-2011. South Afr J HIV Med. 2012;13(1):22-27. https://doi.org/10.4102/sajhivmed.v13i1.156 [ Links ]
58. Adam MA, Johnson LF. Estimation of adult antiretroviral treatment coverage in South Africa. S Afr Med J. 2009;99(9):661-667. [ Links ]
 Correspondence:
Leigh Johnson
Leigh.Johnson@uct.ac.za
Received: 21 Sept. 2016
Accepted: 04 Apr. 2017
Published: 27 July 2017

