


Servicios Personalizados
Articulo
 Inglés (pdf)
 Articulo en XML
 Referencias del artículo
Indicadores

Links relacionados
-
 Citado por Google
 -
 Similares en Google
Compartir

 Permalink
The African Journal of Information and Communication
versión On-line ISSN 2077-7213
versión impresa ISSN 2077-7205
AJIC vol.31 Johannesburg 2023
http://dx.doi.org/10.23962/ajic.i31.14834
RESEARCH ARTICLES
Exploring COVID-19 public perceptions in South Africa through sentiment analysis and topic modelling of Twitter posts
Temitope KekereI; Vukosi MarivateII; Marié HattinghIII
IPhD student, Data Science for Social Impact group, Department of Informatics, University of Pretoria. https://orcid.org/0000-0002-5362-2685
IIProfessor and ABSA UP Chair of Data Science, Department of Computer Science, University of Pretoria. https://orcid.org/0000-0002-6731-6267
IIIProfessor, Department of Informatics, University of Pretoria. https://orcid.org/0000-0003-1121-8892
ABSTRACT
The narratives shared on social media during a health crisis such as COVID-19 reflect public perceptions of the crisis. This article provides findings from a study of the perceptions of South African citizens regarding the government's response to the COVID-19 pandemic from March to May 2020. The study analysed Twitter data from posts by government officials and the public in South Africa to measure the public's confidence in how the government was handling the pandemic. A third of the tweets dataset was labelled using valence aware dictionary and sentiment reasoner (VADER) lexicons, forming the training set for four classical machine-learning algorithms-logistic regression (LR), support vector machines (SVM), random forest (RF), and extreme gradient boosting (XGBoost)-that were employed for sentiment analysis. The effectiveness of these classifiers varied, with error rates of 17% for XGBoost, 14% for RF, and 7% for both SVM and LR. The best-performing algorithm (SVM) was subsequently used to label the remaining two-thirds of the tweet dataset. In addition, the study used, and evaluated the effectiveness of, two topic-modelling algorithms-latent dirichlet allocation (LDA) and non-negative matrix factorisation (NMF)-for classification of the most frequently occurring narratives in the Twitter data. The better-performing of these two algorithms, NMF, identified a prevalence of positive narratives in South African public sentiment towards the government's response to COVID-19.
Keywords: sentiment analysis, sentiment classification, topic modelling, social media, Twitter, natural language processing (NLP), COVID-19, South Africa, government response, public perceptions
1. Introduction
The World Health Organisation (WHO) declared COVID-19 a global pandemic on 11 March 2020 (Ghebreyesus, 2020) following an outbreak in Wuhan, China, in late 2019 (Relman, 2020). The South African government declared it a national disaster on 15 March 2020, and took decisive measures to combat the spread of the disease in the country (Ramaphosa, 2022). The measures implemented by President Cyril Ramaphosa's government to stem infection rates in South Africa included setting up emergency response systems for affected people; imposing travel bans on high-risk countries; requiring self-isolation and quarantine of travellers; school closures; national tracking and tracing of infected people; reducing social gatherings; and reducing the movement of people through the implementation of lockdown Alert Levels 1-5. Alert Level 5 indicated high COVID-19 spread and restricted movement, and Alert Level 1 indicated low spread of the virus and the resumption of everyday activities.
Social media was one of several platforms utilised by the South African government to provide the public with information on the symptoms, status, and spread of this highly infectious disease, and on regulations and restrictions instituted to curb the spread of the pandemic. The public also utilised social media platforms such as Twitter to express their sentiments about the government's response to the pandemic. Extracting these social media discourses can serve as a proxy for understanding the public's views. Such evolving conversations provide indications of the perceptions of those active on social media in respect of the effectiveness of government interventions.
Sentiment analysis of South African Twitter data can provide information on how the government's responses to COVID-19 were perceived. In addition, topic modelling of the same data can reveal the topics of discourses that were linked to COVID-19 and government measures. These topics can highlight critical conversational issues and underlying narratives during the pandemic. They can indicate how the populace perceived the information passed on by government officials on social media.
This study explored the ability of natural language processing (NLP) machine-learning algorithms to measure the public's perception of the South African government's COVID-19 responses through sentiment analysis and topic modelling tasks. We deployed four widely used sentiment classifier algorithms in this study: logistic regression (LR), support vector machine (SVM), random forest (RF), and extreme gradient boosting (XGBoost). For topic modelling tasks, we deployed two other frequently used algorithms: latent dirichlet allocation (LDA) and non-negative matrix factorisation (NMF).
The study generated results from the four sentiment analysis and two topic modelling methods applied to South African Twitter data, including empirical results showing the performance of the methods applied. The rest of the article follows this structure: section 2 reviews literature on sentiment analysis and topic modelling; section 3, focused on methodology, describes the data collection and modelling techniques applied in the study; section 4 provides the findings of the study; and section 5 offers conclusions and makes suggestions for future research.
2. Literature review
Sentiment analysis
Sentiment analysis, which determines whether a word or phrase indicates a positive, negative, or neutral sentiment, is an NLP tool that can measure public opinion on social media. Such measurements based on social media can complement analysis from additional data sources, such as news media and government reports, in providing insights into factors that drive citizens' perceptions of, and behaviours in response to, government regulations and policies. In the context of the COVID-19 pandemic, Mendez-Brito et al. (2021) have identified numerous studies seeking to understand public sentiment towards government interventions as national governments try to balance economic, social, and political goals while limiting the spread of the highly infectious disease.
Three main kinds of methods can be employed in undertaking a sentiment analysis task: lexicon analysis; use of machine-learning algorithms; and hybrid methods.
Lexicon analysis
This lexicon-based approach (Moussa et al., 2020; Taboada et al., 2011) can also be referred to as dictionary-based (Cruz et al., 2015) or corpus-based (Rice & Zorn, 2021). This method works with a corpus or group of words and their valence scores in a dictionary. A valence score indicates whether the text it represents has a positive, negative, or neutral sentiment. From this valence dictionary, a given text that requires sentiment classification receives a reference for its scores. The text's overall valence score, usually an aggregate, determines the polarity sentiment (polarity) of the text (Hu & Liu, 2004; Mohammad et al., 2013; Nielsen, 2011; Stone & Hunt, 1963). For example, the word "good" will receive a positive sentiment score, while "bad" receives a negative score. A word with a neutral sentiment will have a score of zero (in the middle of the range). Some sentiment scores have a range of say 0 to 5, with 5 being the score that represents the positive end of the range (spectrum) while 0 is the other extreme (a negative word). In terms of this range example, a summed sentiment score of 3 would stand for a neutral word.
The earliest dictionary built to extract the opinion of a given piece of text was the General Inquirer (Stone & Hunt, 1963), and others include the multi-perspective question answering (MPQA) subjectivity lexicon (Wiebe et al., 2005), the NRC valence, arousal, and dominance (VAD) lexicon (Mohammad, 2018), the Yelp restaurant review corpus (Kiritchenko et al., 2014) and valence aware dictionary and sentiment reasoner (VADER) lexicons (Hutto & Gilbert, 2014).
A lexicon analysis study by Domalewska (2021) explores public opinion on COVID-19 economic relief measures implemented by the Polish government between March and June 2020. The textual data or corpus comprised Polish Twitter tweets and Facebook posts. Domalewska (2021) created a manually curated dictionary of Polish words to label the sentiments in the text corpus. The curation was necessary because existing dictionaries or word lists used to label the sentiment of a tweet or post were not available in Polish. Domalewska (2021) finds that, despite the Polish government's disbursement of EUR49.24 billion in economic relief, many Poles were critical of the solution implemented. The findings also show that the negative sentiment decreased over time as the Polish people complained less about the shortfalls of the economic relief (Domalewska, 2021).
Use of machine-learning algorithms
Machine-learning algorithms learn the pattern or relationship between a text or tweet and its corresponding label (its sentiment). For every given text, a label is assigned that refers to the sentiment of the text, tweet, or post. There are three different types of training in machine learning: supervised learning (Rustam et al., 2021), unsupervised learning ( Jiang et al., 2022), and reinforcement training (Park et al., 2022).
Supervised learning
In supervised learning, the machine-learning algorithms supervise the training process based on learning example pairs-with each pair composed of text and its corresponding sentiment label (target). Human annotators often provide labels. A study by Gulati et al. (2022) compares the performance of seven sentiment classifier algorithms on COVID-19 tweets. Four of the seven classifiers tested-linear SVM, perceptron, the passive-aggressive classifier (PAC), and LR-are found to outperform the multinomial naïve Bayes (MNB), Bernoulli naïve Bayes (BNB), and adaptive boosting (AdaBoost) classifiers. The study also finds that unigram, bigram, and trigram features do not improve the performance of the three top-performing classifiers.
A study by Kuyo et al. (2021) evaluates the performance of three variants of the naïve Bayes (NB) sentiment classifier-MNB, BNB, and Gaussian naïve Bayes (GNB)- on an international corpus of COVID tweets and responses to governments' lockdown regulations. The study combines machine-learning algorithms with three different n-grams to examine which of the three classifiers' performance is better. N-grams (Jurafsky & Martin, 2018) are sequences of words wherein a single word is a unigram; two sequential words are bigrams; and three sequential words are trigrams. The Kuyo et al. (2021) study finds that the BNB classifier (with bigrams) is more effective than the MNB and GNB classifiers (Kuyo et al., 2021).
A similar study, by Aljameel et al. (2021), compares the performance of three sentiment classifiers-SVM, k-nearest neighbours (KNN), and NB-in determining public opinions towards government's COVID-19 measures in Saudi Arabia. Using a corpus of Arabic tweets from the country's five regions, the study finds that SVM (with bigrams) performs better than KNN and NB (Aljameel et al., 2021).
Unsupervised learning
This type of machine learning involves training algorithms to find patterns in clusters of text, to determine sentiment analysis, without the use of target pairs. An example of this approach is the study by Jiang et al. (2022), in which tweets were projected into high-dimensional vectors (or matrices) in order to find clusters of words, using: Kmeans++ algorithms; the synthetic minority oversampling technique (SMOTE) algorithm to balance the dataset; and a convolutional neural network (CNN) to find salient textual features. In this study, the result is then fed into a bidirectional longshort term memory (Bi-LSTM) sequence processing model, in order to capture the contextual information needed to label the text ( Jiang et al., 2022).
Reinforcement learning
This machine-learning technique uses policies that reward the algorithm for a correct output and penalise it when the output is wrong. An example of this approach is the Chai et al. (2020) study, in which the researchers manually generate descriptions for the sentiment classes and where, for each class, the algorithm has to select a text span (a portion of text) guided by a policy that rewards it when the correct description is chosen.
Hybrid methods
Hybrid sentiment analysis methods use a combination of lexicon-based and machine-learning methods. The process involves using a dictionary or corpus to look up the polarity of the text, and then the polarity becomes the label for the algorithm to learn. In the end, the algorithm provides a classification for each piece of text based on an average of the results of two or more algorithms. The Soumya and Pramod (2021) study provides an example of the hybrid method. In their study, the researchers hybridise SentiWordNet (Baccianella et al., 2010; Esuli & Sebastiani, 2006), a publicly available lexicon of positive, negative, and neutral words, together with three separate classifiers-RF, linear SVM, and radial basis function (RBF)- in order to carry out a fine-grained sentiment analysis of Malaysian tweets. The researchers translate the words in SentiWordNet into Malay using Google Translate, and then extract features using, among other tools, bag-of-words (BoW) and term frequency-inverse document frequency (TF-IDF). The study finds that RF outperforms linear SVM and RBF (Soumya & Pramod, 2021).
Sentiment analysis algorithms deployed in this study
This study adopted a hybrid methodology that combined lexicon analysis and machine-learning techniques for sentiment analysis. The four sentiment classifier algorithms used-LR, SVM, RF, and XGBoost-were selected as baseline models for machine-learning algorithms that have proven their effectiveness across various tasks. Initially, one-third of the tweet dataset was labelled using VADER lexicons, providing ground truth for training the models. The study then employed supervised training to enable the classifiers to learn from the labelled data. It then evaluated and compared the performance of each model. This process ensured that the algorithms were trained and tested on previously unseen data, enhancing the validity of the study results. Having built a sentiment model, we applied it to label two-thirds of the remaining tweets dataset.
Topic modelling
Topic modelling in NLP is the process of discovering topics or themes in an extensive collection of unstructured text by using statistical methods and unsupervised machine learning. Topic modelling provides a means of summarising large clusters of documents into a set of topics. In topic modelling, a collection of words represents a topic in the text. The goal is to find the summary description of each collection of words in a manner that allows for further analysis-while retaining semantic relationships between texts for tasks such as sentiment/text classification, summarisation, and similarity or relevance judgments. Among the most-used topic modelling algorithms are latent semantic indexing (LSI) (Deerwester et al., 1990), latent dirichlet allocation (LDA) (Blei et al., 2003), and non-negative matrix factorisation (NMF). We used LDA and NMF in this study.
LDA is a statistical generative model that extracts topics from a given corpus. It models documents as discrete dirichlet distributions over topics. In other words, LDA assumes that the topics of a document and the words in those topics follow a dirichlet distribution. Given a set of corpora with D number of documents, LDA can discover T number of topics in the document. The T number has to be set manually. LDA finds a set of weights between the documents and topics, and between topics and words.
NMF is a statistical method that reduces the input of the corpora to extract meaningful topics. Through factor analysis, it decomposes the document-term matrix into two smaller matrices that contain only positive numbers. Given a set of corpora with matrix M, NMF factorises M into smaller matrices T and H. Matrix T is a cluster of topics extracted from the document. Matrix H is the weights of topics discovered from the document. The number of topics is calculated by optimising T and H over an expectation-maximisation (EM) objective function, until both matrices converge.
In a topic-modelling study focused on South Africans' reactions to the government's efforts to manage the COVID pandemic, Mutanga and Abayomi (2022) use LDA to discover topics in a tweet corpus. Nine topics are extracted, as follows: lockdown; fifth-generation (5G) conspiracy theory; staying home; alcohol; South African National Defence Force (SANDF) and police violence; tracing of daily statistics; South African Presidential address; essential workers; and Bill Gates conspiracy theories. Since conspiracy theories and misinformation can bring about a lack of confidence in the government's efforts, this study is valuable in highlighting areas where the government can direct its communication efforts (Mutanga & Abayomi, 2022).
Nwankwo et al. (2020) use two statistical models-LDA and bidirectional encoder representations from transformers (BERT)-to model topics in a tweet corpus containing fake news about COVID-19 in Sub-Saharan Africa. Zamani et al. (2020) use topic modelling to explore public concerns from a tweet corpus in the US with respect to COVID-19. Wan et al. (2021) apply the bidirectional and auto-regressive transformers (BART) statistical model to cluster COVID-19 topics in a corpus of US digital media news content.
A study by Yan et al. (2021) uses LDA to reveal topics found in Reddit posts that indicate public fear and resentment towards COVID contact-tracing measures in Canada. Tao et al. (2020) apply LDA to Twitter data collected globally to generate a visualisation of the evolution of COVID-19 topics from March to July 2020. Xing et al. (2021) use topic-modelling of posts on Twitter and on the Chinese micro-blogging platform Weibo to explore cultural differences between social media users in the US and China as factors in public acceptance of government COVID interventions in the two countries. Hou et al. (2021) conduct topic modelling, at different intervals, with data from Weibo in order to track the evolution of Chinese public opinion on
COVID matters.
Topic modelling algorithms deployed in this study
LDA was one of the two topic modelling algorithms we used for our study, because it can be statistically validated. The other topic modelling algorithm we used, NMF, was chosen because of the non-negative constraints it has on matrices, leading to the meaningful extraction of themes.
3. Methodology
Dataset collection
As seen in Table 1, the dataset of COVID-19-related tweets used in this study was composed of three subsets, which we named NICD, Gauteng Province and Healthza. The NICD (National Institute for Communicable Diseases) subset consisted of tweets from the NICD (a government agency), from then-Health Minister Zweli Mkhize, from the South African Presidency, and from the public in response. The Gauteng Province subset consisted of tweets from then-Gauteng Premier David Makhura, from then-Gauteng MEC (Member of the Executive Council) for Health Bandile Masuku, and from members of the public in response. The Healthza subset consisted of tweets from the national Health Minister and the NICD, and from the public in response.
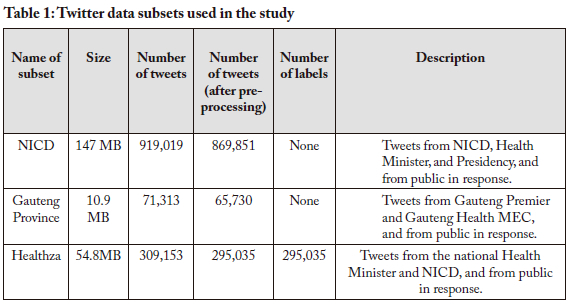
The NICD subset was collected by Marivate et al. (2021), and the Gauteng Province and Healthza subsets were compiled following the same pattern of data collection (Marivate et al., 2021).
Data preprocessing
The tweets from the three data subsets contained text mixed with numbers; misspellings; emoticons and emojis; special characters; universal resource locators (URLs); hashtags; and mentions and abbreviations in languages other than English. Before processing, we removed URLs, emojis, emoticons, and digits from the data, and converted emoticons and emojis to their text equivalent. Next, we implemented the natural language toolkit (NLTK) libraries (Loper & Bird, 2002) and the Terrier information retrieval package (Ounis et al., 2005) to remove stop words and punctuation. We also expanded contractions, removed non-English and duplicate tweets, and made all text entirely lowercase. Finally, the text was tokenised and fed into a machine-learning pipeline containing the six algorithms used in the study: four for sentiment analysis, and two for topic modelling.
Dataset annotation
The dataset primarily consisted of unlabelled texts requiring positive, negative, or neutral sentiment assignments. The Healthza data subset (comprising 295,035 tweets) underwent labelling using VADER lexicons, an approach incorporating qualitative and quantitative methods for sentiment analysis. VADER is a lexiconand rule-based sentiment analysis tool specifically attuned to social media sentiments.
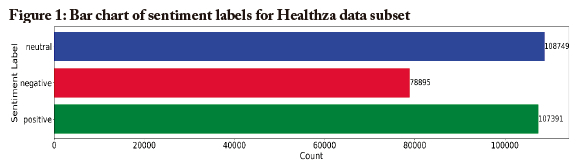
For our annotation, we set the VADER compound score threshold as follows: a score greater than 0.05 was considered positive, less than -0.05 was deemed negative, and any score within the range between positive and negative was marked as neutral. As shown in Figure 1, this process resulted in 108,749 tweets labelled neutral, 78,895 labelled negative, and 107,391 labelled positive.
This approach to labelling served two primary purposes. First, it provided a meaningful classification of the sentiments, because VADER lexicons are suited for social media content. Second, it provided an extensive set of examples for the supervised training of the machine-learning algorithms used in this study. As supervised learning involves teaching models to recognise patterns in the text by providing examples of tweet-sentiment label pairs, the substantial volume of labelled tweets contributed significantly to efficient training of the algorithms.
As seen in the bar chart in Figure 1, the dataset skews towards positive and neutral sentiments, with negative samples not represented nearly as much as the other two classes. To reduce this imbalance and ensure unbiased machine-learning model training, we employed SMOTE, which is an effective technique for generating synthetic samples for minority classes. SMOTE was used to augment the negative class. This method identifies the nearest neighbours of minority class instances and generates synthetic data points through interpolation. These new instances then add to the original dataset.
The systematic application of SMOTE allowed us to achieve a more balanced distribution of sentiment classes, enhancing the fairness of our dataset. Furthermore, by setting a random seed, we ensured the reproducibility of our results. This balancing of the dataset enabled us to improve the overall performance of our machine-learning models by mitigating initial biases, resulting in improved accuracy and generalisation. The models were then trained and evaluated on this balanced dataset, leading to improved performance.
Feature extraction and selection
Feature extraction and selection are vital to building text classification models. This study used two popular vectorisers, BoW and term frequency-inverse document frequency (TF-IDF), to measure the importance of the word vectors. BoW, a simple text representation method, generates a vector based on word counts in the document while disregarding word order. However, this approach results in a sparse dataset due to multiple term occurrences for a single word. On the other hand, TF-IDF combines term frequency of a word with the logarithm of its inverse, providing a more informative representation of word importance in the corpus. The importance of the weights of the words in the corpus is defined by the following equation:

where tfw,d is the occurrence of terms or words in the documents, and idfc is the logarithm of the ratio of total number of documents to the number of documents with terms in the corpus.
The four sentiment classifier algorithms
In this study, we built four classifiers-using LR, SVM, RF, and XGBoost-for sentiment analysis. Leveraging a third of the tweets labelled with VADER lexicons, we trained these algorithms on tweet-sentiment label pairs, enabling them to learn the sentiment patterns in the tweets. Accuracy served as the performance measure, with the sentiment polarity of each text assigned as positive, negative, or neutral, forming three target classes. We then used the entire corpus to extract features for the classifiers.
To evaluate the performance of the trained classifiers, we tested them on unseen Twitter data. The comparison resulted in a ranking based on error rates, allowing us to determine the most effective model. We subsequently utilised this top-performing model to label the remaining unlabelled data. The following sections detail the functioning of each of the four algorithms.
Logistic regression (LR)
LR is widely used for binary classification but can be modified to solve multi-class classification tasks. For example, a logistic regression model for two output classes, negative or positive labels, is described by the probability that:
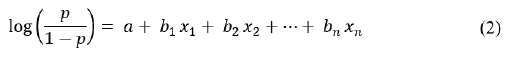
where:
1. p is the probability of the target class
2. a, b are coefficients of x
3. x is the predictor of sentiment (a BoW, for example)
4. n is an integer.
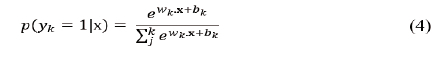
Should the value p be greater than 0.5, then the sentiment belongs to one of the classifications, say, positive class, while probabilities lower than 0.5 take the other binary class, a negative label in this case. However, for a multi-class problem we use multinomial logistic regression (Jurafsky & Martin, 2018) to determine whether the target class is positive, negative, or neutral. In other words, softmax regression or maxent classifier categorises each observation into one of the K classes where only one class is considered correct. Should the class c be correct or selected, the output pc will be set to p = 1 and other output probabilities to zero. The decision boundary is defined by the softmax function expressed as:
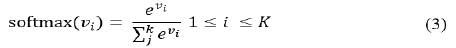
where v is a vector of dimensionality K. The softmax function is the dot product between the weights vector w and input vector x. The probabilities of each of the output or target classes, yk , can be expressed as:
Let W be the weight matrix with K rows, where each row represents the weight vector for the k-th class. The matrix W has dimensions [K X f], with K being the number of output classes and f the number of input features. Also let b be the bias vector. Then the predicted class probabilities can be computed as:

Support vector machines (SVM)
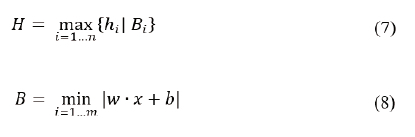
SVM algorithms find a line that maximises the separation of data points to their classes in an n-dimensional space. The line is called a hyperplane. The minimum distance between two or more hyperplanes is called support vectors. The hyperplane predicts the sentiment of the tweet defined as:

where w is a vector, x stands for the data points, and b stands for the bias.
In multi-class classification, there will be n hyperplanes, and the algorithm selects the hyperplane with the largest value.
Random forest (RF)
RF is a decision tree algorithm that grows classification trees. The input vector grows multiple trees in the forest. The forest chooses the trees with the most votes to perform classification. RF is calculated by:
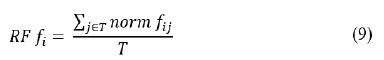
In equation 9, T stands for all the trees in the forest, and norm fij stands for the normalised features that are important for every i in tree j. RF will not overfit the model if there are enough trees in the forest.
Extreme gradient boosting (XGBoost)
XGBoost is an optimised distributed gradient boosting for predictive modelling. It minimises the loss function by averaging weak classifiers for either binary or multi-class classification expressed as:
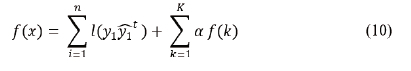
where l defines the loss function, K stands for the sum of the trees, n is the number of rows in the data, a is the regularisation term, and f is the tree.
4. Results
Exploratory analysis
Before carrying out the downstream NLP tasks, we explored each of the three data subsets based on the compilation of a word cloud. A word cloud is a visualisation of text data, showing the frequency of words in a corpus: the higher the frequency, the bigger the word in the cloud.
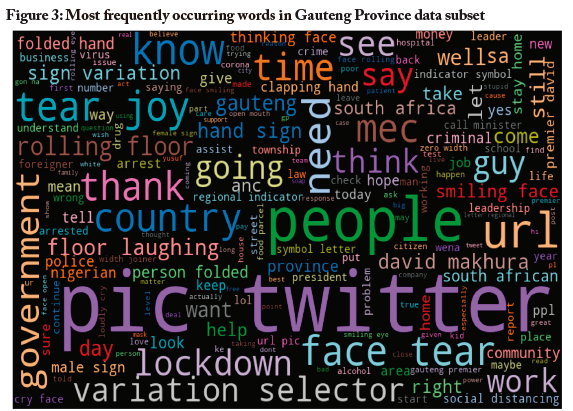
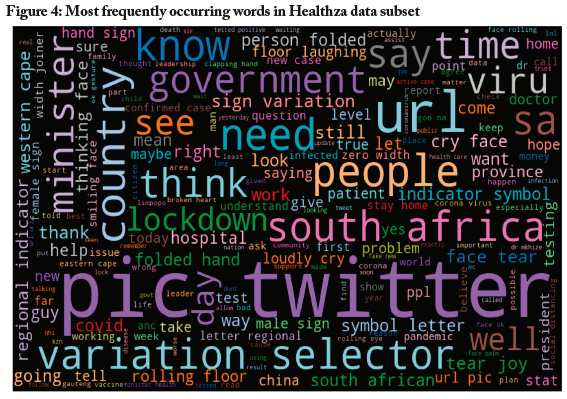
We generated one word cloud for each of the three data subsets, as shown in Figures 2, 3 and 4.
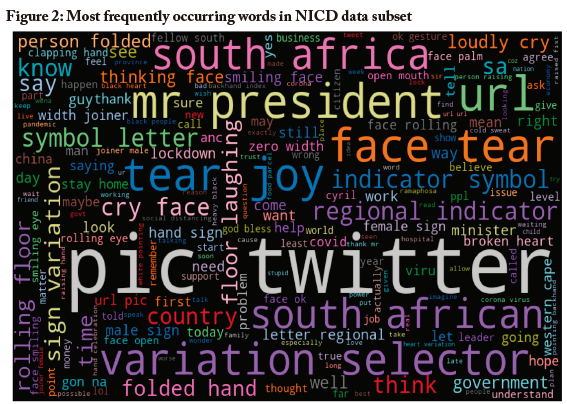
In Figure 2, we see that in the NCID data subset, among the most prominent texts (some of which were emoticons converted to text) were "pic", "twitter", "variation selector", "south africa", "south african", "mr president", "tear", "joy", "face tear" and "url".
In Figure 3, we see that in the Gauteng Province data subset, among the most prominent texts (some of which were emoticons converted to text) were "pic", twitter , people , url , face tear , government , lockdown , variation , selector , country , thank , going , tear , joy , know , need , time , see , say , mec , think guy and work .
The "mec" text stands for "Member of Executive Council (MEC)", which is a provincial government cabinet minister in the South African system. The MEC being referred to was the then-MEC of Health for Gauteng Province, "David Makhura", whose name also appears in Figure 3, below the word "people".
In Figure 4, we see that in the Healthza data subset, among the most prominent words (some of which were emoticons converted to text) were "pic", "twitter", "url", "variation", "selector", "south africa", "lockdown", "country", "people", "need", "think", "know", "minister", "government", and "time".
Performance of the four sentiment classifiers
This section describes the performances of the four classifiers-LR, SVM, RF, and XGBoost-in sentiment classification of tweets related to the government's COVID-19 response in South Africa. As stated above, in order to mitigate the effects of class imbalance in the labelled dataset, we deployed SMOTE.
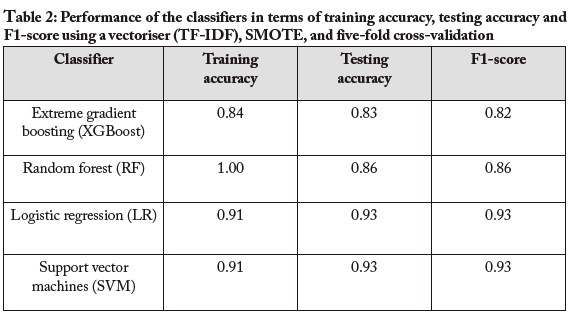
We utilised the TF-IDF vectoriser for feature selection, enabling a nuanced representation of the tweet content for analysis. Coupled with the use of SMOTE for dataset balancing, this approach aimed to reduce bias in the algorithmic training. Furthermore, we conducted a five-fold cross-validation to confirm the classifiers' robustness and generalisability. The importance of cross-validation in sentiment classification lies in its ability to offer a more reliable performance metric. It splits the data into several folds or subsets and, in each round, holds out one subset for testing while training the model on the remaining folds. Repeating this process until each fold has served as a test set assures a comprehensive evaluation that is less impacted by specific data splits.
Thus, we measured the classifiers' effectiveness based on their precision in classifying sentiments. Table 2 highlights the performance of the classifiers, indicating their accuracies and F1-scores.
Training accuracy, testing accuracy, F1-score
Accuracy is the fraction of correctly predicted polarities in the dataset.
Sensitivity, specificity, and precision
For an unbalanced dataset with multi-class classification, accuracy is not enough to measure performance. We also had to evaluate sensitivity, specificity, and precision. Sensitivity or recall is the fraction of the number of correct predictions (true positives) over the proportion of positives. It is also known as the true positive rate.
Specificity is the proportion of correct negative predictions over the total number of negatives.
Precision or positive predictive value is the number of correct positive predictions divided by the total number of positive predictions.
True positive (TP) values are instances where the actual label is positive and correctly predicited as positive. False positive (FP) values are items where the actual label is negative, but the model incorrectly predicted the label as psoitive. True negative (TN) values are samples where the actual result is negative and is correctly predicted as negative. False negative (FN) values are items where the actual label is positive but incorrectly predicted as negative. The F1-score is the harmonic mean of precision and recall. It is micro-averaged over a multi-class classification. A weighted F1-score is reported in this study. The formula below calculated the F1-score.
The weighted F1-score computes the F1-score for each class separately and then calculates a weighted average of those scores based on the samples in each class. This ensures that the metric is not biased towards the smaller classes. The weighted F1-score is expressed as:
where F1w is the weighted F1-score, Cw is the weight of class i calculated as the number of samples in class i divided by the total number of samples, and F1i is the F1-score for class i.
There are ways to calculate the accuracy, misclassification rate, true positive, false positive rate, true negative rate, precision, and prevalence from a confusion matrix. For example, in a confusion matrix, the samples featured in the cells diagonally from top left to bottom right represent correct predictions. The misclassified predictions are in the other cells.
Confusion matrices
We generated confusion matrices for each of the four algorithms-with the matrices based on the test data, i.e., the 59,007 tweets (from among the 295,035 labelled tweets) reserved for testing.
Figure 5 presents the normalised confusion matrices for the performance of the XGBoost and RF classifiers, with correct predictions as percentages. For XGBoost, the accuracy for negative, neutral, and positive classes stood at 71%, 95%, and 79%, respectively. For RF, the accuracies were 78% for negative classes, 92% for neutral, and 85% for positive.
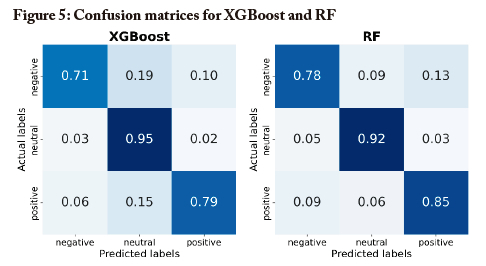
Figure 6 presents the normalised confusion matrices for the performance of the SVM and LR classifiers. Both algorithms accurately classified negative and neutral tweets, respectively, 89% and 96% of the time. However, for the positive class, SVM outperformed LR slightly, with a correct prediction rate of 94% compared to LR's 93%.
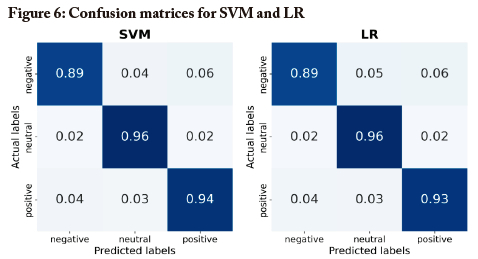
The SVM model was chosen to label the NICD and Gauteng Province data subsets, because its confusion matrix showed that it outperformed the other three models.
Figure 8 shows the sentiment distribution from the predictions of the SVM model when classifying the NICD and Gauteng Province data subsets. The predictions show that there were more neutral and positive tweets in both datasets than negative tweets. We now proceed to examine the words that that were contained in the predictions generated by the SVM model from classification of the NICD and Gauteng Province data subsets.
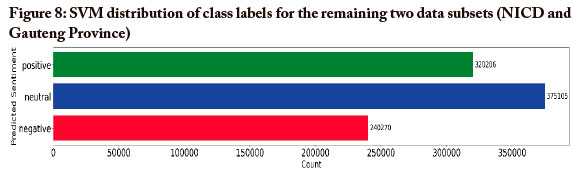
Figure 9 shows the top 20 words that the SVM model considered as negative, along with their frequency of occurrence. Topping the list was "cyrilramaphosa", which is not an inherently negative word, but which presumably often appeared within negative contexts.
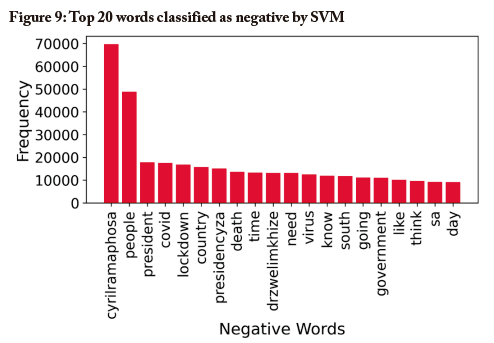
Figure 10 shows all the words classified by the model as neutral, including words such as "covid", "covidsa" and "lockdown" that would typically be expected to carry a negative sentiment. Because the SVM confusion matrix (in Figure 6) shows that SVM had 96% accuracy in labelling neutral words, it is relatively safe to assume that the context was indeed neutral for these instances of those three words as represented in Figure 10.
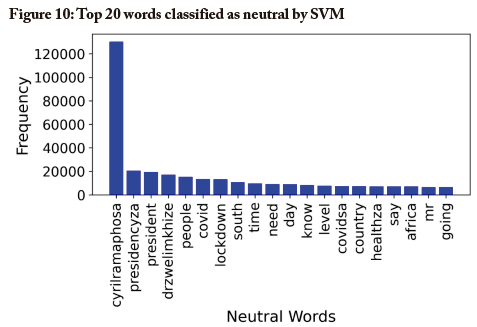
Figure 11 suggests that the SVM model was able, based on contextual factors, to recognise positive sentiment for words that typically would be expected to have negative sentiment (e.g., covid, lockdown), and for neutral-seeming word such as "number". The instances of positive sentiment for "number" presumably resulted, for example, from tweets applauding a falling number of infections.
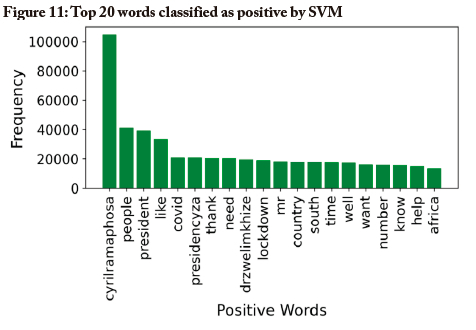
When looking across the three Figures (9, 10, 11), it can be noted that the words "cyrilramaphosa", "people", "president", "covid" and "lockdown" were represented in all three of the class labels (negative, neutral and positive), which is evidence that these words took on varying sentiments depending on their textual contexts.
Findings from topic modelling
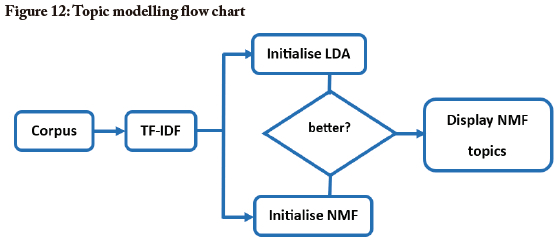
As explained in the opening sections of this article, the study also included application of two topic modelling algorithms, in order to uncover the main themes, across the entire dataset, in the South African public's Twitter discourses on the government's handling of the pandemic. The two topic modelling algorithms used were LDA and NMF. The flow chart for topic modelling is provided in Figure 12.
From the cleaned tweet corpus, a TF-IDF matrix was constructed. The parameters for the topic modeling were then systematically varied to evaluate which combinations produced meaningful topic distributions. In this study, the topics generated by NMF appeared to represent better algorithm performance than those generated by LDA-in other words, the topics produced by NMF were more coherent than those produced by LDA. Table 3 highlights the top 10 topics selected by NMF, along with the sentiments associated with each topic, and provides a thematic example for each one.
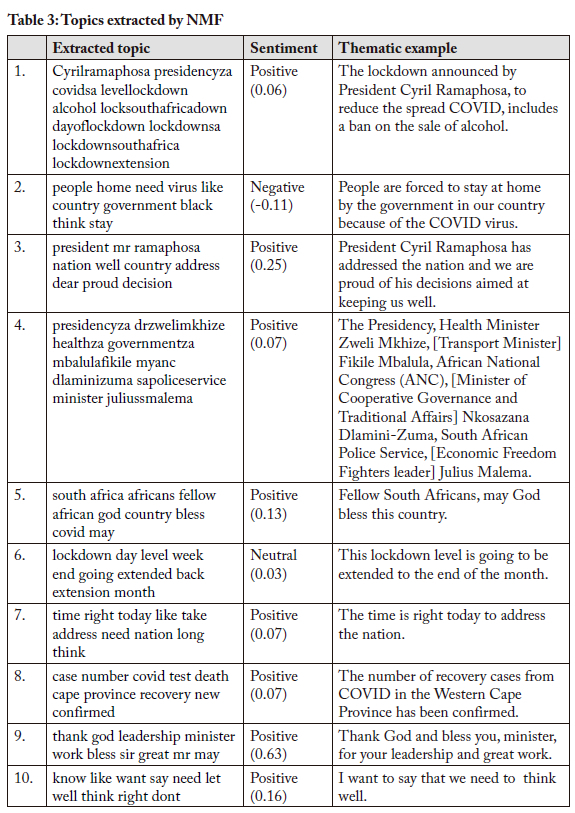
The predicted sentiments shown in Table 3 were the average sentiment values, with -1 indicating negative, 0 neutral, and 1 positive. With respect to the average values, the range between -0.05 and 0.05 was treated as representing neutral sentiment. The data suggested a prevailing positive sentiment among South Africans towards the government's pandemic response.
5. Conclusions and future research
The study has demonstrated the value of sentiment lexicons for training simple machine-learning models. It has also shown that these simple models can perform sentiment classification of social media tweets. In the study, the built model classified social media tweets into positive, negative, or neutral. The tweets were posts from the South African government, and from the public who responded, during the COVID-19 pandemic. The study examined the public's sentiment as South Africa's government imposed lockdown measures to reduce the spread of the virus.
Furthermore, the study showed that SMOTE effectively addresses dataset imbalances, and that TF-IDF is effective for feature selection and for identifying words that the model should pay attention to, and for cross-fold validation in enhancing model generalisation-as evidenced by the consistency of the F1-scores of test results when TF-IDF was used. The study also highlighted how simple topic modelling, such as that performed by NMF, could identify prevalent discussions during the COVID-19 pandemic. The topic-modelling findings suggested a general satisfaction, among the South African public, with the government's pandemic response. Such a finding can offer a valuable insight for policymakers and public stakeholders seeking to evaluate their interventions. Future work could involve exploring techniques for negation handling, or testing of the applicability of the models used in this study in domains beyond health and public safety.
References
Aljameel, S. S., Alabbad, D. A., Alzahrani, N. A., Alqarni, S. M., Alamoudi, F. A., Babili, L. M., Aljaafary, S. K., & Alshamrani, F. M. (2021). A sentiment analysis approach to predict an individual's awareness of the precautionary procedures to prevent COVID-19 outbreaks in Saudi Arabia. International Journal of Environmental Research and Public Health, 18(1), 1-12. https://doi.org/10.3390/ijerph18010218 [ Links ]
Baccianella, S., Esuli, A., & Sebastiani, F. (2010). Sentiwordnet 3.0: An enhanced lexical resource for sentiment analysis and opinion mining. In Proceedings of the Seventh International Conference on Language Resources and Evaluation (LREC'10). http://www.lrec-conf.org/proceedings/lrec2010/pdf/769_Paper.pdf
Blei, D. M., Ng, A. Y., & Jordan, M. I. (2003). Latent dirichlet allocation. Journal of Machine Learning Research, 3, 993-1022. https://www.jmlr.org/papers/volume3/blei03a/blei03a.pdf [ Links ]
Chai, D., Wu, W., Han, Q Wu, F., & Li, J. (2020). Description based text classification with reinforcement learning. Paper presented to International Conference on Machine Learning. http://proceedings.mlr.press/v119/chai20a/chai20a.pdf
Cruz, L., Ochoa, J., Roche, M., & Poncelet, P. (2015). Dictionary-based sentiment analysis applied to a specific domain. In SIMBig 2015: Information Management and Big Data (pp. 57-68). Springer. https://doi.org/10.1007/978-3-319-55209-55
Deerwester, S., Dumais, S. T., Furnas, G. W., Landauer, T. K., & Harshman, R. (1990). Indexing by latent semantic analysis. Journal of the American Society for Information Science, 41(6), 391-407. https://asistdl.onlinelibrary.wiley.com/doi/10.1002/(SICI)1097-4571(199009)41:6%3C391::AID-ASI1%3E3.0.CO;2-9 [ Links ]
Domalewska, D. (2021). An analysis of COVID-19 economic measures and attitudes: Evidence from social media mining. Journal of Big Data, 8(1), 1-14. https://doi.org/10.1186/s40537-021-00431-z [ Links ]
Esuli, A., & Sebastiani, F. (2006). Sentiwordnet: A publicly available lexical resource for opinion mining. In Proceedings of the Fifth International Conference on Language Resources and Evaluation (LREC'06). http://www.lrec-conf.org/proceedings/lrec2006/pdf/384_pdf.pdf
Ghebreyesus, T. A. (2020, March 11). WHO Director-General's opening remarks at the media briefing on COVID-19. https://www.who.int/director-general/speeches/detail/who-director-general-s-opening-remarks-at-the-media-briefing-on-covid-19---11-march-2020
Gulati, K., Kumar, S. S., Boddu, R. S. K., Sarvakar, K., Sharma, D. K., & Nomani, M. (2022). Comparative analysis of machine learning-based classification models using sentiment classification of tweets related to COVID-19 pandemic. Materials Today:Proceedings, 51(1), 38-41. https://doi.org/10.1016/j.matpr.2021.04.364 [ Links ]
Hou, K., Hou, T., & Cai, L. (2021). Public attention about COVID-19 on social media: An investigation based on data mining and text analysis. Personality and Individual Differences, 175, 110701. https://doi.org/10.1016/j.paid.2021.110701 [ Links ]
Hu, M., & Liu, B. (2004). Mining and summarizing customer reviews. In Proceedings of the Tenth ACM SIGKDD International Conference on Knowledge Discovery and Data Mining. https://doi.org/10.1145/1014052.1014073
Hutto, C., & Gilbert, E. (2014, May). VADER: A parsimonious rule-based model for sentiment analysis of social media text. In Proceedings of the international AAAI conference on web and social media (Vol. 8, No. 1, pp. 216-225). https://doi.org/10.1609/icwsm.v8i1.14550
Jiang, W., Zhou, K., Xiong, C., Du, G., Ou, C., & Zhang, J. (2022). KSCB: A novel unsupervised method for text sentiment analysis. Applied Intelligence. https://doi.org/10.1007/s10489-022-03389-4
Jurafsky, D., & Martin, J. H. (2018). N-gram language models. In Speech and language processing [draft book]. https://web.stanford.edu/~jurafsky/slp3/3.pdf
Kiritchenko, S., Zhu, X., Cherry, C., & Mohammad, S. (2014). NRC-Canada-2014: Detecting aspects and sentiment in customer reviews. In Proceedings of the 8th International Workshop on Semantic Evaluation (SemEval2014). https://doi.org/10.3115/v1/S14-2076
Kuyo, M., Mwalili, S., & Okang'o, E. (2021). Machine learning approaches for classifying the distribution of Covid-19 sentiments. Open Journal of Statistics, 11(5), 620-632. https://doi.org/10.4236/ojs.2021.115037 [ Links ]
Loper, E., & Bird, S. (2002). NLTK: The natural language toolkit. arXiv preprint cs/0205028. https://doi.org/10.3115/1118108.1118117
Marivate, V., Moodley, A., & Saba, A. (2021). Extracting and categorising the reactions to COVID-19 by the South African public - A social media study. Paper presented to 2021 IEEE AFRICON. https://doi.org/10.1109/AFRICON51333.2021.9571010
Mendez-Brito, A., El Bcheraoui, C., & Pozo-Martin, F. (2021). Systematic review of empirical studies comparing the effectiveness of non-pharmaceutical interventions against COVID-19. Journal of Infection, 83(3), 281-293. https://doi.org/10.1016/j.jinf.2021.06.018 [ Links ]
Mohammad, S. (2018). Obtaining reliable human ratings of valence, arousal, and dominance for 20,000 English words. In Proceedings of the 56th Annual Meeting of the Association for Computational Linguistics (Volume 1: Long Papers). https://doi.org/10.18653/v1/P18-1017
Mohammad, S. M., Kiritchenko, S., & Zhu, X. (2013). NRC-Canada: Building the state-of-the-art in sentiment analysis of tweets. arXiv preprint arXiv:1308.6242.
Moussa, M. E., Mohamed, E. H., & Haggag, M. H. (2020). A generic lexicon-based framework for sentiment analysis. International Journal of Computers and Applications, 42(5), 463-473. https://doi.org/10.1080/1206212X.2018.1483813 [ Links ]
Mutanga, M. B., & Abayomi, A. (2022). Tweeting on COVID-19 pandemic in South Africa: LDA-based topic modelling approach. African Journal of Science, Technology, Innovation and Development, 14(1), 163-172. https://doi.org/10.1080/20421338.2020.1817262 [ Links ]
Nielsen, F. A. (2011). A new ANEW: Evaluation of a word list for sentiment analysis in microblogs. arXiv preprint arXiv:1103.2903. https://doi.org/10.48550/arXiv.1103.2903
Nwankwo, E., Okolo, C., & Habonimana, C. (2020). Topic modeling approaches for understanding COVID-19 misinformation spread in Sub-Saharan Africa. Paper presented to AI for Social Good Workshop. https://crcs.seas.harvard.edu/files/crcs/files/ai4sg_2020_paper_70.pdf
Ounis, I., Amati, G., Plachouras, V., He, B., Macdonald, C., & Johnson, D. (2005). Terrier information retrieval platform. In Advances in Information. Paper presented to 27th European Conference on Information Retrieval (ECIR 2005), Santiago de Compostela, Spain, 21-23 March. https://doi.org/10.1007/978-3-540-31865-1_37
Park, S.-J., Chae, D.-K., Bae, H.-K., Park, S., & Kim, S.-W. (2022). Reinforcement learning over sentiment-augmented knowledge graphs towards accurate and explainable recommendation. In Proceedings of the Fifteenth ACM International Conference on Web Search and Data Mining. https://doi.org/10.1145/3488560.3498515
Ramaphosa, C. (2022, March 15). President Cyril Ramaphosa: Measures to combat coronavirus COVID-19 epidemic. https://www.gov.za/speeches/statement-president-cyril-ramaphosa-measures-combat-covid-19-epidemic-15-mar-2020-0000
Relman, D. A. (2020). To stop the next pandemic, we need to unravel the origins of COVID-19. Proceedings of the National Academy of Sciences, 117(47), 29246-29248. https://doi.org/10.1073/pnas.2021133117 [ Links ]
Rice, D. R., & Zorn, C. (2021). Corpus-based dictionaries for sentiment analysis of specialized vocabularies. Political Science Research and Methods, 9(1), 20-35. https://doi.org/10.1017/psrm.2019.10 [ Links ]
Rustam, F., Khalid, M., Aslam, W., Rupapara, V., Mehmood, A., & Choi, G. S. (2021). A performance comparison of supervised machine learning models for Covid-19 tweets sentiment analysis. PLoS ONE, 16(2), e0245909. https://doi.org/10.1371/journal.pone.0245909 [ Links ]
Soumya, S., & Pramod, K. (2021). Fine grained sentiment analysis of Malayalam tweets using lexicon based and machine learning based approaches. Paper presented to 2021 4th Biennial International Conference on Nascent Technologies in Engineering (ICNTE). https://doi.org/10.1109/ICNTE51185.2021.9487741
Stone, P. J., & Hunt, E. B. (1963). A computer approach to content analysis: Studies using the general inquirer system. In Proceedings of the May 21-23,1963, Spring Joint Computer Conference. https://doi.org/10.1145/1461551.1461583
Taboada, M., Brooke, J., Tofiloski, M., Voll, K., & Stede, M. (2011). Lexicon-based methods for sentiment analysis. Computational Linguistics, 37(2), 267-307. https://doi.org/10.1162/COLI_a_00049 [ Links ]
Tao, G., Miao, Y., & Ng, S. (2020). COVID-19 topic modeling and visualization. In IV 2020:24th International Conference Information Visualisation. https://doi.org/10.1109/IV51561.2020.00129
Wan, X., Lucic, M. C., Ghazzai, H., & Massoud, Y. (2021). Topic modeling and progression of American digital news media during the onset of the COVID-19 pandemic. arXiv:2106.09572. https://doi.org/10.1109/TTS.2021.3088800
Wiebe, J., Wilson, T., & Cardie, C. (2005). Annotating expressions of opinions and emotions in language. Language Resources and Evaluation, 39(2), 165-210. https://doi.org/10.1007/s10579-005-7880-9 [ Links ]
Xing, Y., Li, Y., & Wang, F.-K. (2021). How privacy concerns and cultural differences affect public opinion during the COVID-19 pandemic: A case study. Aslib Journal of Information Management, 73(4), 517-542. https://doi.org/10.1108/AJIM-07-2020-0216 [ Links ]
Yan, C., Law, M., Nguyen, S., Cheung, J., & Kong, J. (2021). Comparing public sentiment toward COVID-19 vaccines across Canadian cities: analysis of comments on Reddit. Journal of Medical Internet Research, 23(9), e32685. https://doi.org/10.2196/32685 [ Links ]
Zamani, M., Schwartz, H. A., Eichstaedt, J., Guntuku, S. C., Ganesan, A. V., Clouston, S., & Giorgi, S. (2020). Understanding weekly COVID-19 concerns through dynamic content-specific LDA topic modeling. In Proceedings of the Fourth Workshop on Natural Language Processing and Computational Social Science (pp. 193-198). Association for Computational Linguistics. https://doi.org/10.18653/v1/2020.nlpcss-1.21
Acknowledgements
We wish to thank University of Pretoria and Canada's International Development Research Centre (IDRC) for its funding of (first-listed author) Kekere's research, and ABSA for its sponsorship of (second-listed author) Marivate's industry chair and activities related to this study.

