


Services on Demand
Article
 English (pdf)
 Article in xml format
 Article references
Indicators

Related links
-
 Cited by Google
 -
 Similars in Google
Share

 Permalink
The African Journal of Information and Communication
On-line version ISSN 2077-7213
Print version ISSN 2077-7205
AJIC vol.30 Johannesburg 2022
http://dx.doi.org/10.23962/ajic.i30.14839
RESEARCH ARTICLES
Using machine learning to predict low academic performance at a Nigerian university
Ebiemi Allen EkuboI; Bukohwo Michael EsiefarienrheII
ILecturer, Department of Computer Science, Niger Delta University, Amassoma, Nigeria. https://orcid.org/0000-0001-9348-5630
IIAssociate Professor, Department of Computer Science and Information Systems, and Researcher, Material Science Innovation and Modelling (MaSIM), Faculty of Natural and Agricultural Sciences (FNAS), North-West University, Potchefstroom, South Africa. https://orcid.org/0000-0002-1631-9759
ABSTRACT
This study evaluates the ability of various machine-learning techniques to predict low academic performance among Nigerian tertiary students. Using data collected from undergraduate student records at Niger Delta University in Bayelsa State, the research applies the cross-industry standard process for data mining (CRISP-DM) research methodology and the Waikato Environment for Knowledge Analysis (WEKA) tool for modelling. Five machine-learning classifier algorithms are tested-J48 decision tree, logistic regression (LR), multilayer perceptron (MLP), naïve Bayes (NB), and sequential minimal optimisation (SMO)-and it is found that MLP is the best classifier for the dataset. The study then develops a predictive software application, using PHP and Python, for implementation of the MLP model, and the software achieves 98% accuracy.
Keywords: machine learning, educational data mining, student academic performance, university, cross-industry standard process for data mining (CRISP-DM), Waikato Environment for Knowledge Analysis (WEKA), classifier algorithms, J48 decision tree, logistic regression (LR), multilayer perceptron (MLP), naïve Bayes (NB), sequential minimal optimisation (SMO), Nigeria, Niger Delta University
1. Introduction
Low academic performance is a challenge faced by many higher education institutions worldwide (Romero et al., 2010). The challenge is more serious in developing countries, where the phenomena undermining academic success are more numerous and more pronounced than in developed-world settings (Al-Zoubi & Younes, 2015). The UN has identified the challenges present in developing countries that ultimately result in low academic performance as poverty, unstable electricity, lack of funding, diverse health challenges, environmental degradation, level of social development (low school enrolment rate), vulnerability in employment, maternal mortality, and quality of life of slum dwellers (UN DESA, 2013). With regard to low academic performance of undergraduate students, the research shows that the effects on students can be long-term, resulting in low self-esteem, unease, and fear of failure (Aryana, 2010; Nsiah, 2017; Nurmi et al., 2003). For tertiary institutions, low academic performance limits their growth in terms of, inter alia, execution of operations and rankings in global indices (Serdyukov, 2017). Thus, the challenge needs continuous monitoring and the creation of incentives to help boost students' progress.
The issue of low academic performance is prevalent in Nigeria, where many universities record a high number of low-performing undergraduate students (Oyebade & Dike, 2013). Educational research in Nigeria concerned with low academic performance has considered numerous factors, including those related to the student, the environment, the institution, and the relevant level(s) of government (Farooq et al., 2011).
The discipline of data mining seeks to discover useful patterns in large sets of data, so as to predict future outcomes (Gullo, 2015). In education, the use of data mining has led to improvements in predicting factors that will render certain students prone to struggling with their studies, to failure, and to dropping out (Hughes & Dobbins, 2015). Results from these predictions can assist stakeholders in addressing the factors identified as contributing to poor student performance. Therefore, it is necessary for tertiary institutions to make use of this useful prediction method.
Some research carried out in Nigeria using data-mining techniques with educational data has already looked at predicting students' performance using selected attributes (Adeyemo & Kuye, 2006; Oyerinde & Chia, 2017). These studies predicted students' performance using various attributes, but did not develop software based on their prediction to monitor and track the progress of students' performance. The absence of a dedicated software tool that enables Nigerian tertiary institutions to track their students' performance, despite the abundance of packages for data mining, justified this study's efforts to identify the highest-performing data-mining algorithm and to implement it in the form of customised software. This study used a case study of a single university.
Universities need to document the attributes of low performers, classify the low performers using data-mining techniques, and develop a model that can identify likely low performers. The model developed can serve as a foundation for the design and implementation of systems that can provide potential low performers with the assistance that they need to perform better. The goal of this study was to develop such a model, based on data from a single Nigerian university-Niger Delta University in Bayelsa State-and with potential applicability to multiple universities.
This research sought to: (1) identify factors that are causing the poor performance of undergraduates in Nigeria; (2) collect and represent these factors as features in machine-readable format for data mining; (3) identify the best set of features from the total features collected for predicting low academic performance; (4) identify which machine-learning technique could best classify low-performing students based on the selected features; and (5) develop a customised software system that uses the identified best machine-learning algorithm to identify low-performing students and automatically recommend various interventions.
Using data collected from the university's undergraduate student records and applying the cross-industry standard process for data mining (CRISP-DM) research methodology and the Waikato Environment for Knowledge Analysis (WEKA) tool for modelling, five machine-learning classifier algorithms were used to determine which one was the most accurate in predicting poor student performance.
Section 2 of this article reviews related literature; section 3 discusses the methodology followed; section 4 presents the testing of the five classifier algorithms; section 5 presents the feature selection process; section 6 presents the development and evaluation of the predictive software application; and section 7 provides conclusions and a recommendation.
2. Literature review
Educational data mining is the multidisciplinary research area that applies data-mining techniques to educational data (Romero & Ventura, 2013). The educational environment regularly produces large amounts of data (Romero & Ventura, 2013), and with the use of data-mining techniques, stakeholders can gain knowledge to help them understand learners and improve their learning process (Algarni, 2016). Using educational data-mining techniques can also benefit society in general, as every society thrives socially and economically when its education system performs optimally (Mitra, 2011).
Yagci (2022) proposes a model that predicts the final exam grades of students using their midterm exam grades. Six algorithms-random forest (RF), nearest neighbour, support vector machines (SVMs), logistic regression (LR), naive Bayes (NB), and k-nearest neighbours (K-NN)-are used, and their accuracy falls within the range of 70 to 75%. Thus, the Yagci (2022) study contributes to identifying high-risk students who are likely to fail their exams. Our study was different from that that of Yagci (2022), because we used the cumulative grade point average (CGPA), which is technically a student's average of all courses, instead of a single exam grade for a subject. Dhilipan et al. (2021) use four data-mining algorithms to predict the performance of students. The four algorithms used, and their levels of accuracy, are: LR (97.05%), decision tree (88.23%), entropy (91.19%), and K-NN (93.71%). While the Dhilipan et al. (2021) focuses on prediction of student performance in general, our study was focused more on identification of low-performing students. In our study, not all students' data was used-only the data related to low-performing students. Also, the algorithms we used differed from those used by Dhilipan et al. (2021).
Vergaray et al. (2022) present a stacking multi-classification model for mining academic performance of students, using five classification algorithms, with their output as a feeder to the stacking model. The five classification algorithms with their accuracies are: extra trees (ET) (57.41%), RF (61.96%), decision tree (91.44%), adaptive boosting (AdaBoost) (59.65%), and extreme gradient boosting (XGBoost) (83.3%). The proposed stacking model is then applied, combining the five algorithms, enabling accuracy of 92.86%.
So as to predict student performance at a very early stage, Li et al. (2022) propose an end-to-end deep-learning model that can automatically (with no manual intervention) extract features from datasets to form a two-dimensional convolutional neural network (CNN) of behaviours reflective of the dataset. Their experiment is conducted using university students' data from Beijing, and the results show improvement over traditional data-mining algorithms. Ofori et al. (2020) present findings from a review of literature related to using machine-learning algorithms in the prediction of students' academic performance and their learning outcomes. The reviews show various algorithms used in the prediction of students' academic performance and the highest levels of accuracy achieved.
Abu Zohair (2019) mines data on postgraduate students' performance using 50 students' datasets obtained from a university. The authors split their data into dataset1 and dataset2, and use five data-mining algorithms to train their datasets, with the following results in terms of accuracy: multilayer perceptron (MLP) (60.5%), NB (71.1%), SVMs (76.3%), K-NN (65.8%), and linear discriminant analysis (LDA) (71.1%). Flanagan et al. (2022) use the linear kernel SVMs model to predict the performance and engagement of students' behaviour using digital textbooks during an open book test. A good level of accuracy is achieved in identifying, at an early stage, students who are low performers.
Factors that influence low academic performance generally vary from society to society, and from individual to individual. In many developed countries, low academic performance often relates to personal issues such as a lack of inspiration to study or emotional trauma resulting from certain situations (Banerjee, 2016). However, in many developing countries, factors emanating from institutions and the government, in addition to individual factors, also contribute to poor academic performance. Thus, the causes of poor academic performance in developing countries can broadly be divided into individual, institutional, and governmental factors.
The individual factors relate to students' capacity to focus and concentrate on their academic work. Some individual factors that affect the performance of students in the Arab countries of Jordan and Oman, as outlined by Al-Zoubi and Younes (2015) and Alami (2016), are: poor motivation, lack of planning, low self-confidence, fretfulness about exams, poor examination practices, low opinion of the course, lack of interest in the course, laziness, and lack of future plans. Other individual factors identified as affecting low student performance are medical or mental problems, and the family's financial background (Al-Zoubi & Younes, 2015). Factors associated with low tertiary performance in Nigeria include students' uncertainty about their future because of high levels of unemployment; the large number of low-salary earners; lack of funding (e.g. bursaries); a lot of competition for scholarships; self-sponsoring students' distractions due to their engagement in temporary jobs; engaging in small-scale business activities such as buying and selling of goods and services, which then occupies most of their time, leaving little for studies; lack of planning; poor study habits; negative peer influence; family crises; lack of support from guardians or parents; students' view of a course as difficult; and the family's financial or psychological background (Oyebade & Dike, 2013).
Contributing factors associated with tertiary institutions, according to Frimpong et al. (2016), writing in the Ghanaian context, include poor conditions in the learning environment and educators' inadequate knowledge of educational and psychological matters.
Government factors include unstable electricity within and outside the school environment; insufficient security in learning environments; failure to adequately address high levels of poverty in the country; insufficient budgets for the education sector; and pay disputes between the academic staff of higher education institutions and government, which result in regular strike activities (Adeyemi & Adeyemi, 2014; Longe, 2017; Ugar, 2018).
3. Methodology
The process model followed in this study was the widely used CRISP-DM. It involves six steps (Wirth & Hipp, 2000):
• Business understanding: Scouting relevant stakeholders and assembling vital information to make sure the goals of the research are achievable.
• Data understanding: Data gathering and investigation to ensure that the data has quality and shows useful patterns.
• Data preparation: Cleaning and converting gathered data into a suitable format for mining and ensuring the dataset fits the selected modelling tool.
• Modelling: Use of the cleaned dataset and application of selected algorithms for knowledge mining.
• Evaluation: Examination of the output of the modelling step to ensure the knowledge gained is in line with the proposed goals of the project.
• Deployment: Display of the discovered knowledge by either integrating it into an existing system or developing a new system to assist stakeholders in benefiting from the knowledge gained (Wirth & Hipp, 2000).
In line with the CRISP-DM process model, the study consisted of the following steps: a survey of literature (as summarised above in section 2) on data-mining of educational data and on the causes of low performance in Nigerian universities; the gathering of student details from Niger Delta University and the storage of the details in Microsoft Excel; the testing of five machine-learning algorithms to determine the best algorithm for identifying low student performance based on collected data; using four feature selection techniques to choose the optimal features from the dataset; and designing and testing a predictive system, using the PHP programming language, for the identification of potential low performers.
The CRISP-DM methodology was used in this study because it provided all the phases necessary for our research endeavour, including a phase for data collection and pre-processing (necessary for us as our data was mostly in the form of physical files obtained from the university administrator). The methodology also provided a phase for data mining and then construction of a solution for implementation. Using the CRISP-DM methodology saved us from having to combine numerous methodologies for the different parts of the research, particularly the software development (we relied on the CRISP-DM deployment phase to develop the software). The WEKA tool was used for modelling because of its simplicity and its ability to present results in a concise form.
The study used data stored in the Niger Delta University repository, and sampled 2,348 low-performing students' data, i.e., data on students with a CGPA of less than 3.00 (CGPA < 3.00).
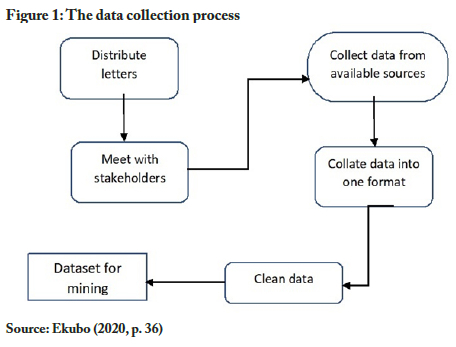
Data collection
Figure 1 shows the complete data collection process followed in this study. The process involved letters being distributed to key stakeholders for permission to obtain data, which led to a meeting with stakeholders to agree on terms regarding the data-collection process and privacy issues. The next steps were the collection and collation of existing data from the available sources into one format, cleaning data to rid it of inaccurate or incomplete information, and preparation of the data for mining.
The lead researcher (the first-listed author, Ekubo) had a meeting with the Deputy Vice-Chancellor (Academic) of the Niger Delta University, who oversees the handling of all information related to students' academic results. The DVC assisted the researcher by sending out memos to all faculty deans, heads of department, faculty officers, and faculty examination officers to assist the researcher in datagathering from the university repositories. The faculty officers stored the students' details in spreadsheet files and gave the researcher the data on USB flash drives. The collection of students' results data involved meeting with examination officers within departments. Where the examination officers were unavailable, the heads of department provided the data, which was in either pdf or hard copy files. The researcher transferred the files on USB flash drives immediately to his laptop and stored all hard copy files in a file jacket.
Data preparation
The data collected was incomplete and inaccurate. The students' details collected from the university comprised 10,472 records. After manually inserting CGPAs from the pdfs and hard copies, the total number of students with assigned CGPAs comprised 5,631 records, of which students with CGPAs less than 3.00 comprised 3,481 records. This formed the entire population of low-performing undergraduate students used in this research.
Attribute selection
At the end of the data preparation process, one class attribute (CGPA, the core attribute used for the prediction) and 24 dependent attributes were selected for mining. Table 1 shows the class attribute and 24 dependent attributes, the attributes' variable codes, and the codes' corresponding values. In the table, "JAMB score" refers to the student's score on the exam provided by the Joint Admissions and Matriculation Board (JAMB)-the exam called the "UTME" (the Unified Tertiary Matriculation Examination). The "course from JAMB" attribute indicates whether the course the student was admitted to study was the actual course the student chose to study from JAMB. The "post-UTME score" is the score the student obtained on the university's internal entrance examination.

Also in Table 1, "SSCE" refers to the Senior Secondary School Certificate Examination. The student's "average SSCE score" was calculated as the average of the student's pre-university academic performance. Nigerian high school students write exams in a minimum of seven subjects and a maximum of nine subjects, and earn grades A, B, C, D, E, or F, based on their performance. For the purpose of the research, the values 6, 5, 4, 3, 2 or 1 replaced the respective grades, and the sum for each student divided by the number of subjects the student wrote gave the value of the average SSCE score.
The dataset was split into two parts: one for training and the other for testing of the models to be built with the five machine-learning classifier algorithms chosen for testing:
• J48 decision tree;
• logistic regression (LR);
• multilayer perceptron (MLP);
• naive Bayes (NB); and
• sequential minimal optimisation (SMO).
These algorithms were selected for testing based on their frequent use in existing similar studies (see literature reviewed in section 2) and their high rates of accuracy in such studies. The dataset also underwent a feature selection process, to retrieve the optimal features from the dataset for prediction of low academic performance, using the following four feature selection techniques:
• correlation;
• gain ratio;
• information gain; and
• ReliefF.
The next phase of the study was development of a predictive software application, using the best-performing machine-learning model (among the five tested) and the optimal features (as identified in the feature selection exercise). Finally, the study evaluated this predictive application with the test dataset to determine its effectiveness.
4. Testing of the five classifier models
In line with the objectives of this research, the study developed five machine-learning models. It started by splitting the entire dataset into two parts, using a 70:30 ratio. The first part, with 70% of the dataset, was for training, while the other 30% was for testing, i.e., testing the model built to ensure that the model performed well with unseen data. This study employed the resample filter available in WEKA for the splitting purpose. This filter ensured that the dataset split has no duplicates.
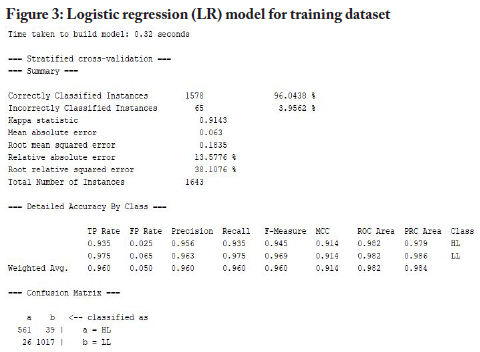
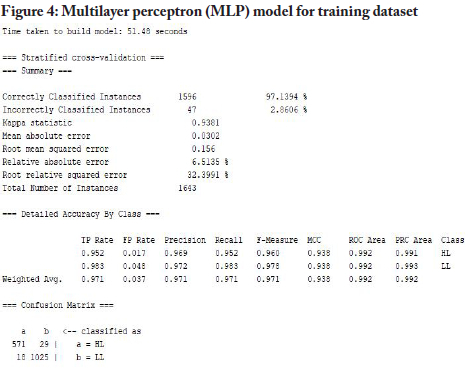
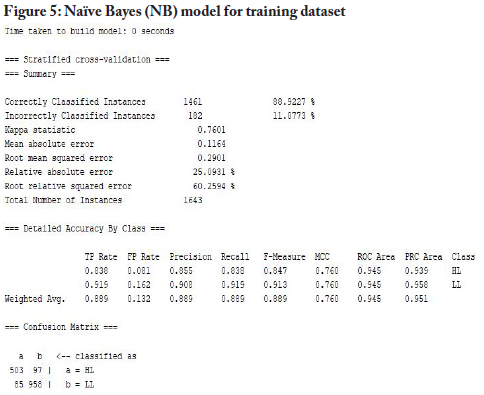
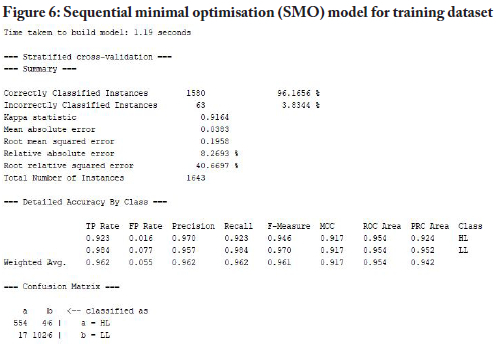
For the modelling process, the study used the WEKA tool to build models with the training dataset for the five selected machine-learning algorithms, namely J48 decision tree, LR, MLP, NB and SMO. Figures 2 to 6 below provide snapshots of the results from the modelling processes.

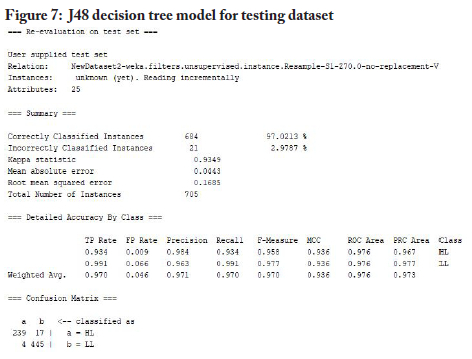
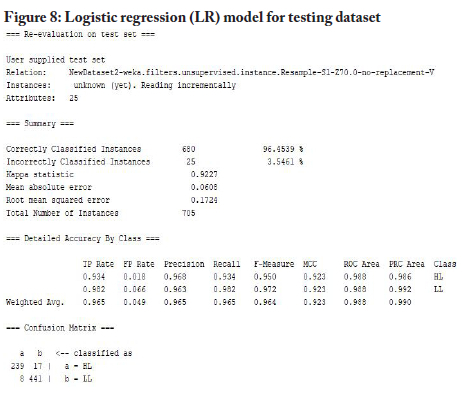
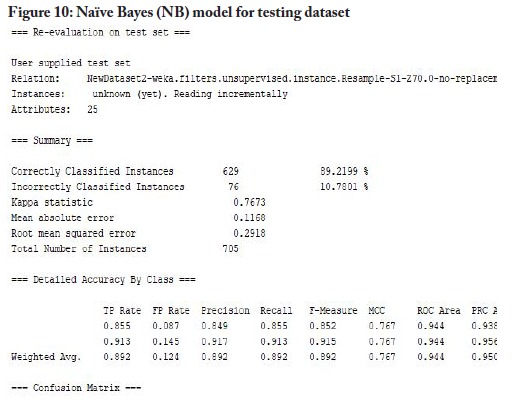
After successful modelling of the training dataset, the study used the testing dataset to test the models built to confirm how well each built model performed with the unseen dataset. Figures 7 to 11 are snapshots of the results from this process.


Model performance
This sub-section presents the performance of the trained and tested models by exploring the number of correctly classified datasets and looking at performance in terms of six metrics.
Table 2 compares the performance of the classifier models based on correctly and incorrectly classified student data for the training dataset. The acronyms "LL" and "HL" in the table stand for "LowLow" and "HighLow", which were this study's two hyperparameters, i.e., parameters whose values controlled the learning process. Each machine-learning model had to deliver either an LL or HL classification for each student record. The focus in this study was on classifying low-performing students into two groups-HL and LL-with the idea being that students in the LL group would be the ones to receive urgent assistance to improve their chances of performing well. As seen in the table, the MLP algorithm correctly classified the highest number of students (1,596) for the entire training dataset and misclassified the lowest number of students (47). SMO had the next best performance, with 1,580 records classified correctly and 63 misclassifications. LR followed SMO with a classification margin of two less than SMO: 1,578 records were correctly classified, and 65 records were incorrectly classified. J48 correctly classified 1,566 student records and misclassified 77 records. NB showed the poorest performance, with 1,461 correctly classified records and 182 misclassified records.

For the performance of the algorithms in correctly classifying students in the HL class, MLP outperformed the other algorithms, while for the performance of the algorithms in correctly classifying students in the LL class, SMO performed the best. However, the difference in performance between SMO and MLP in correctly classifying students in the LL class was just one record.
Table 3 shows the five models' performance on the training dataset in terms of six selected metrics:

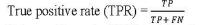
Recall is the proportions of positive instances that are correctly classified. It is often called sensitivity. Recall

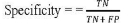
Specificity is the proportion of true negatives that are correctly predicted by the model.
The receiver operating characteristic (ROC) curve gives the performance of a classification model at all classification thresholds.
True positive rate
False positive rate
True positive rate (TPR) is a synonym for recall and is therefore defined as follows:
False positive rate (FPR) is defined as follows:
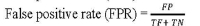
Therefore, the ROC curve plots TPR vs. FPR at different classification thresholds.
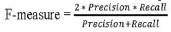
F-measure is a measure that conveys the balance between recall and precision and can be said to be the harmonic mean of recall and precision.
The kappa value is a statistic used to control only those instances that may have been correctly classified by chance.

The root mean square error (RMSE) is a standard way to measure the error of a model in predicting quantitative data. RMSE is calculated as:
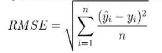
where,
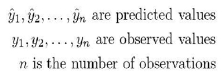
As seen in the results in Table 3, SMO had the best performance (98.4%) in terms of the recall metric, followed closely by MLP (98.3%). For all of the other five metrics- specificity, ROC curve, F-measure, kappa and RMSE-MLP performed best. For all six metrics, the weakest performer was NB.
After modelling the training dataset, the study compared the performance of the five algorithms on the testing dataset. Table 4 shows the results of the comparison of the performance based on correctly and incorrectly classified data, and Table 5 shows the performance in terms of the six metrics.


As seen in Table 4, the MLP algorithm performed best, correctly classifying the entire dataset, and achieved the best performance for classifying students in the HL and LL groups. Overall across the metrics, as seen in the findings presented up to this point, MLP was the best performer.
As seen in Table 5, for the recall metric, MLP and J48 both achieved the highest value (99.1%). For the other five metrics-specificity, ROC curve, F-measure, kappa and RMSE-MLP was the best performer. For all six metrics, NB scored worst.
5. Feature selection
Feature selection in data mining helps models by looking out for the most important features in the dataset, reducing complexities and increasing the accuracy of the model (Neumann et al., 2016). This study ranked the attributes in order of importance using four feature selection techniques available in WEKA, namely: correlation, gain ratio, information gain, and ReliefF. Figures 12 to 15 are snapshots of the results.


Figure 12 gives the ranking of the features (attributes) in order of contribution to the low performance of students, ranked from highest to lowest, as determined by the correlation feature selection technique. The four most-correlating attributes were: sponsor qualification, secondary school type, work and study, and university accommodation. The four least-correlating attributes were: family size, smart phone assistance, attended primary school, and marital status.
Figure 13 provides the feature rankings generated by the gain ratio technique. The strongest (most-correlating) four attributes were: sponsor qualification, work and study, secondary school type, and average SSCE score. The weakest (least-correlating) four attributes were: sex, family size, attended primary school, and marital status.
Figure 14 presents the features ranked by the information gain technique. The four strongest attributes were found to be: sponsor qualification, weekly study time, sverage SSCE score, and sponsor type. The weakest attributes were: family size, sex, attended primary school, and marital status.
As shown in Figure 15, use of the ReliefF technique generated these four strongest attributes: family size, sponsor type, seekly study time, and sponsor qualification. The weakest features were: course from JAMB, own smart phone, marital status, and attended primary school.
The results as set out in Figures 11 to 14 indicated that, across all the techniques used, certain attributes were consistently identified as most relevant, meaning they were likely to contribute greatly to predicting a student's classification as HL or LL. At the same time, there were certain attributes that consistently emerged as the least relevant, suggesting that these features contribute least to predicting a student's classification.
Accordingly, we tested the performance of the five classifier algorithms through successive modelling of the features in each feature selection technique starting from the top four attributes. The ROC curve and RMSE values, which are two widely used metrics (Caruana & Niculescu-Mizil, 2004), were used to evaluate the performance of the models. Table 6 provides a summary of the results obtained.

Table 6 shows that all algorithms achieved a higher level of performance on the reduced dataset than on the complete dataset. The information gain feature selection algorithm had the highest performance, with an ROC curve value of 99.7% and an RMSE value of 13.82%, and with the features identified as most relevant ranging between 15 and 16 of the features in Table 1.
Performance of MLP classif ier using the 16 most relevant attributes
Since MLP had proven to be the best classifier, we built a new MLP model, now using only the 16 attributes determined to be most relevant by the information gain feature selection technique. The modelling process began by extracting the selected attributes in WEKA and then using the MLP classifier to build the model. Figure 16 shows the model built, and Table 7 presents the performance of the model using the 16 most relevant attributes identified.


In Table 7, all the metric values for the 16 most relevant attributes dataset show good performance. A comparison of these metrics values with those for the complete database of all attributes revealed the following: recall was 98.5% for the 16 most relevant attributes dataset, while it was 98.3% for the complete database; specificity was 96.5% for the most relevant attributes and 95.2% for the complete database; the ROC curve was 99.7% for the most relevant attributes and 99.2% for the complete database; the F-measure was 98.2% for the most relevant attributes and 97.8% for the complete database; the kappa value was 95.13% for the most relevant attributes and 93.81% for the complete database; and the RMSE was 13.82% for the most relevant attributes and 15.6% for the entire database.
The results showed improvement for every metric value using the 16 most relevant attributes when compared with using all 24 attributes. It was thus concluded that the MLP classifier, using the 16 most relevant features ranked with the information gain algorithm, was the best classifier for the dataset generated by this study. Accordingly, it was determined that it would be beneficial to design and implement the prediction application with the MLP classifier and the 16 identified attributes.
The 16 selected attributes
Table 8 shows the variable codes and values, and descriptions, of the 16 most relevant attributes identified from the modelling process. These were the features used for development of the predictive application.

6. Development and evaluation of predictive software application
The predictive application was developed with the goal of creating a tool that could help Nigerian universities to identify potentially low-performing students-so as to be able to provide targeted intervention measures to address these students' needs.
Application development
The design process followed the following four steps: input students' features, which were the 16 most relevant attributes identified; use the best classifier algorithm identified, which was the MLP model; predict students' failure risk level as HL or LL; and output an intervention summary for students, with HL students requiring low intervention and LL students requiring high intervention. The main users of the software would be faculty officers in charge of gathering and storing students' information. Their role would be to use the application to obtain predictions and to forward results to the relevant authorities in the institution for the purpose of intervention in the form of one or more of: study load rescheduling, counselling, financial intervention in the form of bursary, and/or government assistance through various funding agencies for indigent students.
A 17th attribute was added (as seen below in Figure 17), called "matric number", to identify specific students whose information had been processed. This was the ID number of the student, unique to each student and eliminating the need to record student names in the application. The software interface was developed with the PHP programming language, while the part of the software that would handle the prediction used the Python programming language-incorporating the MLP model built in WEKA. Snapshots of the predictive application follow in Figures 17 to 19.


Figure 17 shows the welcome screen, which offers instructions to users on the relevant student details to gather, and informs users that only authorised persons can access the system.
Figure 18 shows the user input page for the 16 most relevant attributes and the added "Matric number". Users select options from the dropdown menu for each feature. The page also has a button for viewing the predicted results, and another button for resetting the page.
Figure 19 displays a "Result prediction" for a student, indicating (in this example case) an LL classification and specifying the need for "high intervention".
Application evaluation
The software was evaluated in two phases. The first phase evaluated the software based on its requirements, and the second phase evaluated the software based on its performance. The first phase ensured that the application met the following requirements:
• Simple and interactive interface: Easy navigation between pages and straightforward instructions for users
• Secured system: Login interface to ensure that only authorised persons can access the software
• Avoidance of prediction error: Notifications to users of empty fields to ensure the application has received values for all 17 features before allowing the generation of a prediction
• Rapid results: Provision of results with a single click
• Provision of risk level: Offering a result prediction value for each student, and a risk intervention summary based on predicted value
The second phase of the evaluation involved testing the software using the 30% testing dataset, which contained 705 records. The process of evaluation began by entering the details of each record into the predictive application to obtain a prediction. Figure 20 shows a cross-section of the stored results in Excel, including "Actual" and "Predicted" values in terms of the "LowLow" and "HighLow" classifications.

From the data in the spreadsheet shown in Figure 20, a confusion matrix was constructed, as represented in Table 9, to determine the accuracy of the predictive application when engaging with the testing dataset.

The confusion matrix in Table 9 shows that 446 out of 449 records were correctly predicted for the LL group, and 245 out of 256 records were correctly predicted for the HL group. Furthermore, using the values obtained from the confusion matrix, the values obtained for recall and sensitivity were both 99.3%, and the value obtained for specificity was 95.7%. For prevalence, the software obtained 63.7% for LL students and 36.3% for HL students, which meant that high-risk students were found to be twice the number of low-risk students in the institution. The software achieved accuracy of 98%, which demonstrated a high level of dependability. For precision, the software achieved 99.3%, and its F-measure was 98.5%. Thus, the performance obtained from an evaluation of the software showed that the application could accomplish its objectives.
7. Conclusion and recommendation
This study was grounded in an understanding that low student performance is a global challenge that affects every tertiary academic institution in the world-and that the challenge is particularly prominent in developing countries, including Nigeria. In looking for ways to monitor and improve the performance of students, the study explored machine learning as a technique to assist Nigerian universities in identifying the potential for low academic performance among undergraduate students. With a dataset collected from Niger Delta University, which comprised 24 attributes, this study identified the 16 features (student attributes) that give optimal prediction results when subjected to machine learning. The study also identified the MLP classifier algorithm as the best model for generating such predictions. Furthermore, the study developed a predictive software application for potential deployment by Nigerian universities, using the 16 attributes and MLP model identified.
It is recommended that future research should study the performance of the MLP model, and of predictive applications, using datasets from other Nigerian higher institutions-so as to work towards enabling a robust and unified system for all institutions in the country.
References
Abu Zohair, L. M. (2019). Prediction of student's performance by modelling small dataset size. Journal of Educational Technology in Higher Education, 16, 27. https://doi.org/10.1186/s41239-019-0160-3 [ Links ]
Adeyemi,A.M.,&Adeyemi,S. B.(2014).Institutional factors as predictors of students'academic achievement in colleges of education in South Western Nigeria. International Journal of Educational Administration and Policy Studies, 6(8), 141-153. https://doi.org/10.5897/IJEAPS2014.0342 [ Links ]
Adeyemo, A. B., & Kuye, G. (2006). Mining students' academic performance using decision tree algorithms. Journal of Information Technology Impact, 6(3), 161-170. [ Links ]
Alami, M. (2016). Causes of poor academic performance among Omani students. International Journal of Social Science Research, 4(1), 126-136. https://doi.org/10.5296/ijssr.v4i1.8948 [ Links ]
Algarni,A.(2016). Data mining in education. International Journalof.'Advanced Computer Science and Applications, 7(6), 456-461. https://doi.org/10.14569/IJACSA.2016.070659 [ Links ]
Al-Zoubi, S. M., & Younes, M. A. B. (2015). Low academic achievement: Causes and results. Theory and Practice in Language Studies, 5(11), 2262-2268. https://doi.org/10.17507/tpls.0511.09 [ Links ]
Aryana, M. (2010). Relationship between self-esteem and academic achievement amongst pre-university students. Journal of Applied Sciences, 10(20), 2474-2477. https://doi.org/10.3923/jas.2010.2474.2477 [ Links ]
Banerjee, P. A. (2016). A systematic review of factors linked to poor academic performance of disadvantaged students in science and maths in schools. Cogent Education, 3(1). https://doi.org/10.1080/2331186X.2016.1178441 [ Links ]
Caruana, R., & Niculescu-Mizil, A. (2004). Data mining in metric space: An empirical analysis of supervised learning performance criteria. In Proceedings of the 10th ACM SIGKDD International Conference on Knowledge Discovery and Data Mining (pp. 69-78). https://doi.org/10.1145/1014052.1014063
Dhilipan J., Vijayalakshmi N., Suriya S., & Arockiya, C. (2021). Prediction of students performance using machine learning. IOP Conference Series: Materials Science and Engineering, 1055, 012122. https://doi.org/10.1088/1757-899X/1055/1/012122 [ Links ]
Ekubo, A. E. (2020). Predictive system for characterizing low performance of undergraduate students using machine-learning techniques. PhD thesis, North-West University, South Africa. [ Links ]
Farooq, M. S., Chaudhry, A. H., Shafiq, M., & Berhanu, G. (2011). Factors affecting students' quality of academic performance: A case of secondary school level. Journal of Quality and Technology Management, 7(2), 1-14. [ Links ]
Flanagan, B., Majumdar, R., & Ogata, H. (2022). Early-warning prediction of student performance and engagement in open book assessment by reading behavior analysis. International Journal of Educational Technology in Higher Education, 19(41), 1-23. https://doi.org/10.1186/s41239-022-00348-4 [ Links ]
Frimpong, E. A., Agyeman, G. A., & Ofosu, F. F. (2016). Institutional factors affecting the academic performance of polytechnic students in Ghana. International Journal of Humanities & Social Science Studies (IJHSSS), 2(5), 102-109. [ Links ]
Glewwe, P., & Kremer, M. (2006). Schools, teachers, and education outcomes in developing countries. In E. Hanushek, & F. Welch (Eds.), Handbook of the economics of education, vol. 2 (pp. 945-1017). https://doi.org/10.1016/S1574-0692(06)02016-2
Gullo, F. (2015). From patterns in data to knowledge discovery: What data mining can do. Physics Procedia, 62, 18-22. https://doi.org/10.1016/j.phpro.2015.02.005 [ Links ]
Hughes, G., & Dobbins, C. (2015). The utilization of data analysis techniques in predicting student performance in massive open online courses (MOOCs). Research and Practice in Technology Enhanced Learning, 10(1), 1-18. https://doi.org/10.1186/s41039-015-0007-z [ Links ]
Li, X., Zhang, Y., Cheng, H., Li, M., & Yin, B. (2022). Student achievement prediction using deep neural network from multi-source campus data. Complex and Intelligent Systems, 8, 5143-5156. https://doi.org/10.1007/s40747-022-00731-8 [ Links ]
Longe, O. (2017). Graduate unemployment in Nigeria: Causes, consequences and remediable approaches. American International Journal of Contemporary Research, 7(4), 63-73. [ Links ]
Mitra, D. (2011). Pennsylvania's best investment: The social and economic benefits of public education. Pennsylvania State University.
Mohammed, A. (2022). Data mining classification simplified: Key types, steps & 6 best classifiers. Hevo. https://hevodata.com/learn/data-mining-classification
Neumann, U., Riemenschneider, M., Sowa, J. P., Baars, T., Kalsch, J., Canbay, A., & Heider, D. (2016). Compensation of feature selection biases accompanied with improved predictive performance for binary classification by using a novel ensemble feature selection approach. BioData Mining, 9(36), 1-14. https://doi.org/10.1186/s13040-016-0114-4 [ Links ]
Nsiah, H. (2017). Fear of failure and the academic performance of students from low-income families. International Journal of Education and Social Science, 4(10), 19-26. [ Links ]
Nurmi, J. E., Aunola, K., Salmela-Aro, K., & Lindroos, M. (2003). The role of success expectation and task-avoidance in academic performance and satisfaction: Three studies on antecedents, consequences and correlates. Contemporary Educational Psychology, 28(1), 59-90. https://doi.org/10.1016/S0361-476X(02)00014-0 [ Links ]
Ofori, F., Maina, E., & Gitonga, R. (2020). Using machine learning algorithms to predict students' performance and improve learning outcome: A literature based review. Journal of Information and Technology, 4(1), 33-55. [ Links ]
Ololube, N. P. (2013). The problems and approaches to educational planning in Nigeria: A theoretical observation. Mediterranean Journal of Social Sciences, 4(12). https://doi.org/10.5901/mjss.2013.v4n12p37 [ Links ]
Oyebade, S. A., & Dike, C. (2013). Restructuring Nigerian tertiary (university) education for better performance. Paper presented at the 11th Annual Meeting of the Bulgarian Comparative Education Society, Plovdiv, Bulgaria, 14-17 May.
Oyerinde, O. D., & Chia, P. A. (2017). Predicting students' academic performances - A learning analytics approach using multiple linear regression. International Journal of Computer Applications, 157(4), 37-44. https://doi.org/10.5120/ijca2017912671 [ Links ]
Romero, C., & Ventura, S. (2013). Data mining in education. Wiley Interdisciplinary Reviews: Data Mining and Knowledge Discovery, 3(1), 12-27. https://doi.org/10.1002/widm.1075 [ Links ]
Romero, C. B., Ventura, S. N., Pechenizkiy, M., & Baker, R. S. (Eds.) (2010). Handbook of educational data mining. CRC Press. https://doi.org/10.1201/b10274
Serdyukov, P. (2017). Innovation in education: What works, what doesn't, and what to do about it? Journal of Research in Innovative Teaching & Learning, 10(1), 4-33. https://doi.org/10.1108/JRIT-10-2016-0007 [ Links ]
Ugar, A. A. (2018). ASUU strike: The Federal Government and Nigerian educational system. International Journal of Education and Research, 6(5), 19-32. [ Links ]
UN Department of Economic and Social Affairs (UN DESA). (2013). World economic and social survey 2013: Sustainable development challenges.
Vergaray, A. D., Guerra C., Cervera, N., & Burgos, E. (2022). Predicting academic performance using a multiclassification model: Case study. International Journal of Advanced Computer Science and Applications (IJACSA), 13(9), 881-889. https://doi.org/10.14569/IJACSA.2022.01309102 [ Links ]
Wirth, R., & Hipp, J., (2000). CRISP-DM: Towards a standard process model for data mining. In Proceedings of the 4th International Conference on the Practical Applications of Knowledge Discovery and Data Mining (pp. 29-39). Springer-Verlag.
Yagci, M. (2022). Educational data mining: Prediction of students' academic performance using machine learning algorithms. Smart Learning Environments, 9(1), 1-9. https://doi.org/10.1186/s40561-022-00192-z [ Links ]
Acknowledgements
The authors thank the Material Science Simulation and Modelling (MaSIM) research focus area in the Faculty of Natural and Agricultural Sciences (FNAS), the School of Postgraduate Studies, and the Department of Computer Science and Information Systems, all at North-West University, for their assistance throughout this research. We also thank Niger Delta University for making its data available for research purposes. This paper draws on the contents of the first-listed author's PhD thesis at North-West University (Ekubo, 2020).

