


Servicios Personalizados
Articulo
 Inglés (pdf)
 Articulo en XML
 Referencias del artículo
Indicadores

Links relacionados
-
 Citado por Google
 -
 Similares en Google
Compartir

 Permalink
Law, Democracy and Development
versión On-line ISSN 2077-4907
versión impresa ISSN 1028-1053
Law democr. Dev. vol.20 Cape Town 2016
http://dx.doi.org/10.4314/ldd.v20i1.7
ARTICLES
The state of political inclusion of ethnic communities under Kenya's devolved system
Ben Christopher NyabiraI; Zemelak Ayitenew AyeleII
IProgram Officer at Katiba Institute - Kenya
IIAssistant Professor, Centre for Federal Studies, Addis Ababa University, Ethiopia
1 INTRODUCTION
Relations among some ethnic communities in Kenya have been characterised by deep animosity and suspicion, which heighten during election periods. This is so largely because individuals hailing from a few ethnic communities dominated the political structures and economic resources of the country, to the exclusion of other communities, both before and after Kenya became an independent country. The people in authority used the State apparatus to economically benefit themselves, their kin, their friends and regions. The exclusion was exacerbated as the country increasingly became centralised, contributing to intermittent conflicts, which often occur following general elections, the worst being the 2007 post-election violence. Kenya adopted a new Constitution in 2010 with a view, among other things, to curbing this decades long inter-ethnic animosity.
This article argues that the 2010 Kenyan Constitution by creating 47 counties, sub-national territorial and political units, has enhanced the opportunities for the political inclusion of hitherto excluded communities. Moreover, the 2013 election results show that several previously excluded communities not only have become represented at county level, but have in fact gained control of one or more of the counties where they form the majority. The system of devolution that Kenya adopted has not however entirely done away with the possibility of some ethnic communities being excluded. Several ethnic communities now form a new minority at intra-county level, since the devolved system has not provided a county for each territorially structured ethnic community. Moreover, many who have migrated from what traditionally would have been viewed as their "home county" to other counties now form intra-county minorities. Practice shows a trend in which the communities forming the majority in some counties are excluding those who are in the minority in those counties. Furthermore, the national executive still retains a significant political and economic clout and hitherto excluded communities are not necessarily guaranteed representation in it.
The article begins by describing how the pre-2010 centralised system brought about the political exclusion of several ethnic communities in Kenya. Then it discusses the principles under the 2010 Constitution that recognise the ethnic diversity of the Kenyan people and call for their political inclusion. It then deals with the territorial and non-territorial institutional mechanisms that the Constitution envisages would be used for the purpose of ensuring the inclusion of the various ethnic communities of the country. Finally, based on the 2013 general election results, it examines whether there is a trend in the political inclusion of hitherto excluded communities.
2 HISTORY OF ETHNIC BASED POLITICAL EXCLUSION IN KENYA
The political exclusion of many ethnic communities in Kenya is the legacy of colonial rule and a decades long centralised, ethnicised, and personalised presidential system. The presidency was used for the political and material benefit of the holder of the office and his close political associates, often belonging to the ethnic community from which the president hailed.1
The British, as part of their divide and rule colonial policy, chose individuals from specific ethnic communities, to the exclusion of others to allow access to the country's political and administrative institutions, as a reward for this collaboration. After independence, Jomo Kenyatta, the first Kenyan President, largely maintained the colonial political and economic structures, and chose to politically and economically empower himself and those, mainly, from his ethnic community - the Kikuyu - to the exclusion of others. To this effect he abolished the Independence Constitution that provided for a semi-federal political system and centralised all political powers in his office.2 He justified the centralisation of powers by the ideal of nation building, a project that was predicated on a denial of the ethnic diversity of the Kenyan people. Dubbed pejoratively "majimboism", the semi-federal system was viewed as a system that would exacerbate the ethnic cleavages of the Kenyan people and sabotage the nation-building project3
The centralised system however had the opposite effect of ethnic-based exclusion and division. This trend continued under the second President, Daniel Arap Moi, who, having assumed the presidency after Kenyatta died in 1978, also used it to empower the Kalenjin, an ethnic community to which he belongs.4 Even worse, Moi formalised a mono-party political system- which had in any case been the de-facto system in Kenya since 1969 - thereby ending any semblance of democratic pluralism in the country.5 President Mwai Kibaki, the third President of Kenya, who was also from the Kikuyu ethnic group like President Kenyatta, was no exception to this since, having assumed the presidency after Moi, he also increasingly preferred his Kikuyu kinsmen in political appointments.6
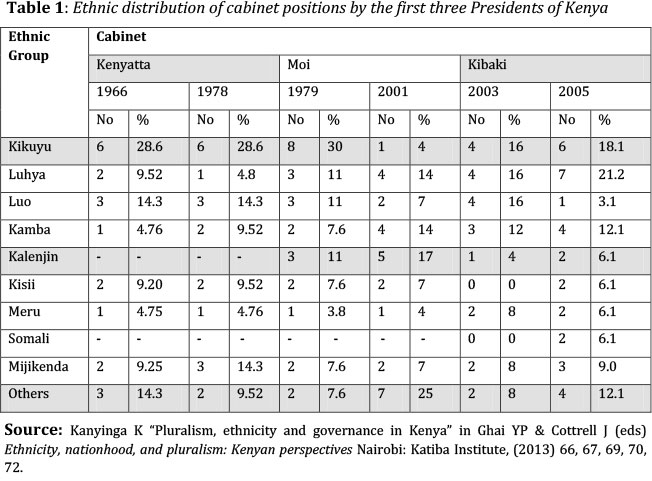
As can be seen from Table 1, during the presidency of Kenyatta, the percentage of cabinet ministers from the Kikuyu community was 28.5. However, in 2001 the percentage of ministers from the Kikuyu community dropped to just 4% and that of the Kalenjin rose to 22 %. Moreover, a maximum of 10 ethnic communities were represented in the cabinet of both Kenyatta and Moi out of about 43 ethnic communities. The same trend followed in the appointments of the Permanent Secretaries (PS). In 1970, for example, the PS from the Kikuyu community constituted 37.5% while those from the Kalenjin community were just 8.3%. The percentage of the PS from the Kikuyu community dropped to 8.7% in 2001 while that of the Kalenjin community rose to 34.8%. This was once again reversed when Mwai Kibaki, a Kikuyu, came to power in 2001.
In short, those holding the presidency effectively entrenched the politics of "it's our turn to eat" in Kenya, leaving other ethnic communities with a feeling of exclusion.7In such a centralised and personalised political system, and in the absence of alternative sub-national political institutions, controlling the national government, in particular the presidency, became a life and death matter for every ethnic community during general elections.8
There had been sporadic inter-ethnic violent conflicts in what came to be known as Kenya even before the emergence of colonialism towards the end of the 19th century. The creation of the Kenyan State and the systematic exclusion of the various ethnic communities, in particular after independence, however, politicised the conflict to the extent that it reached a catastrophic proportion in the aftermath of the 2007 general elections.9 The 2007 post-election violence resulted in the death of more than 1,133 people, displacement of approximately 350 000 others and destruction of property. 10
The political exclusion of, and economic discrimination against the various ethnic communities, and the urgency to curb these problems triggered persistent demands for constitutional reform from the 1980s.11 At the centre of the call for constitutional reform was the demand to remove the centralised government system and replace it with a decentralised one. There was an even stronger demand for equitable representation in the national government of all regions and communities, which had been the domain of a few communities and individuals. These demands could not be ignored after the 2007 post-elections violence. Thus serious moves were begun towards constitutional reform resulting in the adoption of the 2010 Constitution. The Constitution, among other things, introduced a devolved system of government, composed of 47 counties and a national government.
The introduction of the devolved system was predicated, among others, on the need to enhance the political and economic inclusion of previously excluded ethnic communities.12 Moreover, as per the constitutional prescription, general elections were conducted in 2013 in which the President of the Republic, members of parliament, members of county assemblies, women representatives, county governors and their deputies were elected. This raises two key questions: How does the Constitution seek to achieve the political inclusion of hitherto excluded ethnic communities? Have the 2013 elections brought about the political inclusion that was envisaged by the Constitution?
3 ETHNIC INCLUSION IN THE 2010 KENYAN CONSTITUTION
The 2010 Kenyan Constitution contains several principles that aim to bring about the political inclusion of all the ethnic communities of Kenya. The first principle in this respect is the one that recognises the very existence of diverse ethnic communities in Kenya, which had been thus far viewed as a taboo in Kenya's political discourse. The third paragraph of the Preamble of the Constitution therefore recognises the "ethnic, cultural and religious diversity" of the Kenyan people. Such recognition is an important first step towards mandating "the state to acknowledge the ethnic plurality that characterises the society it seeks to govern".13
However, the Constitution does not go much further in terms of boldly giving institutional expression to the ethnic diversity of Kenyans, which would have the impact of institutionalising ethnicity. This means that unlike, for instance, the Ethiopian or South African Constitutions, the Kenyan Constitution does not give an official status to the languages of the various ethnic communities both at national and county levels.14Nor does it expressly provide, unlike the Ethiopian Constitution,15 for the creation of states and sub-state territorial units along ethnic lines.16 In fact, it counterbalances the recognition of the ethnic diversity of Kenyans with its emphasis on their unity, by stressing their determination to "live in peace and unity as one indivisible sovereign nation". Granting ethnic diversity an institutional expression is still a political taboo that the framers of the Constitution could not overcome. Thus the Constitution is mostly vague and hazy about the institutional accommodation of ethnic diversity.
The above however does not mean that the Constitution is completely silent on the matter. It seeks to ensure the political, economic, social, and cultural inclusion of all ethnic communities, in particular ethnic minorities. And devolution is the principal institutional mechanism that the Constitution seeks to use for this purpose. This can be gathered from the constitutional objectives of devolution that include recognising the diversity of the Kenyan people and protecting and promoting the interests of minorities and marginalised communities.17
3.1. Devolution and the territorial inclusion of excluded communities
Devolution, as an institutional mechanism for the political inclusion of ethnic communities, has a territorial aspect: it entails the structuring of the sub-national boundaries of a country in a manner allowing the territorial accommodation of various ethnic communities of a country. The Constitution thus provides for the creation of 47 counties, spread across the country, as the sub-national units of the country.18 The Kenyan Constitution does not in fact expressly provide that ethnicity should be a factor that informs the demarcation of the boundaries of the counties. The boundaries of the counties were however demarcated along the boundaries of the former districts which were largely based on the colonial districts that were demarcated along ethnic lines.19The boundaries of the 47 counties that were finally adopted largely correspond to the settlement pattern of a number of ethnic communities of the country.
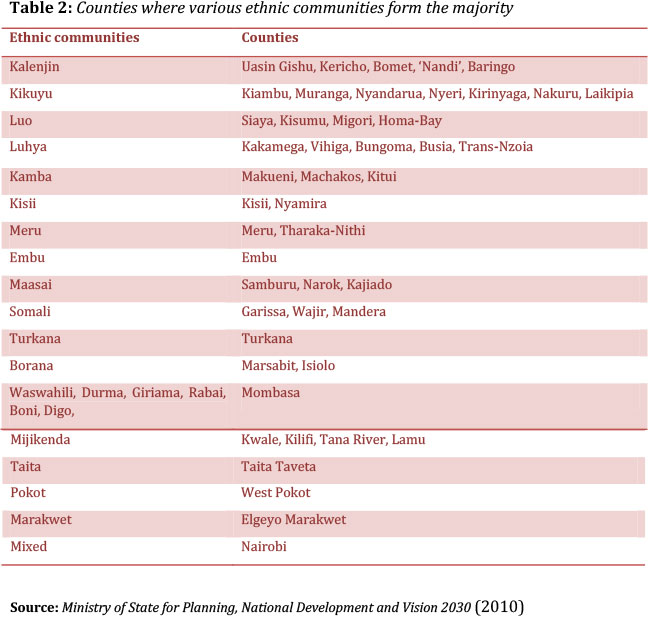
The Kenyan devolved system - unlike, for instance, the Ethiopian federal system that encloses each of the five largest ethnic communities of the country within a single region20 - does not attempt to create a single mega-county for each ethnic community. It rather divides the ethnic communities with large populations into several counties. The division of the larger ethnic communities into several counties is meant to territorially accommodate the ethnic diversity of Kenyans without balkanising the country into ethnic enclaves. The end result of this arrangement is that one or more counties have been created where an ethnic community, including some of those hitherto excluded communities, forms a majority. As can be seen from Table 2 above each county has a single ethnic community constituting a majority. Some of the counties in fact bear the names of hitherto excluded communities - including Turkana, Pokot, Taita Taveta and Samburu. The exceptions are two counties, Nairobi and Mombasa, which have no single ethnic community that is in the majority. There are other counties, such as, Isiolo, Lamu, Marsabit and Tana River, which are also said not to have an absolute majority ethnic community. Nakuru, Laikipia and Trans Nzoia counties, are predominately populated by people from communities that ancestrally hail from other counties. This territorial arrangement can be assumed to bring about a sense of ownership to the relevant communities.
Moreover, some of the former provinces were considered to belong to specific ethnic communities, and other communities were considered outsiders. This perception had been used as an excuse to evict people based on their ethnic identity from some areas in Kenya. For example, the former Rift Valley Province was considered to belong to the Kalenjin, Maasai, Turkana and the Samburu communities leading to the formation of the ethnic alliance of the said communities called KAMATUSA.21 Yet there are many belonging to the Kikuyu community who reside in some parts of the former Rift Valley Province. These moved to after independence by purchasing the former colonial lands through the Gikuyu, Meru and Embu Association (GEMA) and cooperative societies.22Other regions were also considered to belong to other communities. Such sense of ownership and the branding of other communities as "outsiders" was one of the reasons cited for the abolition of the semi-federal independence constitution and have over years contributed to the ethnic conflicts. Now some communities heretofore considered outsiders have become among the largest communities in some of the newly established counties. For example, in Nakuru and Laikipia Counties, both in the former Rift Valley Province, the Kikuyu have become the largest community.23
This territorial arrangement is not, however, without limitations. There are about 43 ethnic communities in Kenya, not to mention the numerous sub-tribes in these communities.24 However, only 16 ethnic communities form the majority in one or more counties. Eleven of the 16 ethnic communities form the majority in more than one county, while the other five, form the majority in one county each. The Kikuyu are in majority in seven counties followed by the Kalenjin and the Luhya, each of which is in the majority in five counties. Cumulatively, the 11 ethnic communities dominate 40 of the 47 counties. This means that out of the 43 ethnic communities, 27 are minorities at intra-county level. This shows that the county system has not resulted in the territorial inclusion of all ethnic communities. In fact, most of the ethnic communities of the country have now become minorities at intra-county level creating a situation similar to the one that existed at the national level before the devolved system was introduced. That is why many of those communities that currently are intra-county minorities protested during the drafting of the Constitution since their concerns were not catered for when the demarcation of the boundaries of the counties took place.25 Moreover, the creation of a county for a particular ethnic community on its own is not a sufficient factor to create among members of the Kenyan ethnic communities a sense of being included in government. Representation in the national government is still viewed as the single most critical factor in terms of evaluating the inclusiveness of the government in Kenya.26
3.2 County political institutions and inclusiveness
Under the former centralised system of government, the National Assembly was the only representative institution in the country that had political relevance. There were indeed elected local councillors.27 They had however restricted political significance. The local councils, for example, did not have constitutionally assigned legislative and revenue raising and allocation powers. Members of Parliament (MPs) were elected from 210 very large constituencies. This limited the opportunities that small ethnic communities had for political representation. Even those that were represented were outnumbered in this representative assembly. This exclusion was further exacerbated by the formalisation of a one-party-system in 1982 - that was de facto in place since 1969 - until it was abolished in 1991. Moreover, the only existing executive organ was the National Cabinet, which, as Table 1 shows, was composed of 20 to 30 individuals, often hailing from the largest 10 or so ethnic communities. The small ethnic communities were thus seldom represented in these political institutions leaving them with a sense of exclusion.
The 2010 Constitution, on the other hand, through devolution, creates multiple political institutions at two levels of government, among others, for the purpose of enhancing the political inclusion of the various ethnic communities of the country. It provides for the establishment of political institutions not only at national level but also at county level. Each county has a representative council, a County Assembly, which is composed of directly elected, and "nominated", representatives.28 Each county also has an executive organ referred to as the county executive committee (CEC) composed of a directly elected governor and deputy governor and other members appointed by the governor with the approval of the County Assembly.29 The governor and his deputy are the chief executive and deputy chief executive of the county, respectively.30
The total number of the seats in County Assemblies exceeds 145031. There are also hundreds of executive offices that have been established in each county. These, obviously, open up a wide political space for the inclusion of many ethnic communities of the country. Each county also has its own administrative apparatus and an independent County Public Service Board (CPSB) to assist the county executive in the recruitment of the county administration staff.32 Civil servants hailing from different ethnic communities are expected to fill these administrative vacancies. This is an important departure from the previous centralised system where a single civil service system existed which, especially the senior management level, was dominated by people from just a few ethnic communities. The creation of so many political and administrative institutions at county and national levels in and of itself creates a wide political space for the inclusion of hitherto excluded communities.
The Constitution does not stop at creating the political institutions. It goes further and provides several principles requiring the representation in these institutions of hitherto excluded communities. It requires that the composition of the political organs of a county reflects the community and cultural diversity of its residents33 even though the effective implementation of this principle is dependent on political parties. It also requires Parliament to enact legislation that gives effect to this constitutional principle.34 Accordingly Parliament enacted the County Government Act (CGA) of 2012, which contains several provisions requiring ethnic inclusion in the political institutions of counties.
The Constitution adopts the First Past the Post (FPTP) system as the principal electoral system through which the great majority of members of County Assemblies are elected. 35 A County Assembly is thus composed of members elected from wards within a county that serve as single member electoral constituencies in county elections.36 However, under the FPTP system there is a possibility that members of an ethnic community may not be politically represented unless they are found to be in the majority in one or more electoral districts (wards) of a county, particularly where ethnicity is the major factor in determining who gets elected.37 The electoral system may thus result in the exclusion of, particularly, people from intra-county minority ethnic communities from political representation. Moreover, the Independent Electoral Boundaries Commission (IEBC) did not take the ethnic factor into consideration when creating wards that serve as electoral constituencies. Population size was the principal factor that IEBC took into account for this purpose. This was challenged in court in Republic v Independent Electoral and Boundaries Commission & another Ex-Parte Councillor Eliot Lidubwi Kihusa & 5 others. The Court stated that the wards, which serve as electoral constituents in county elections, need, where possible, to be delimited in a manner that allows the representation of intra-county minority ethnic communities.38
The FPTP electoral system is further complemented by a system that is meant to allow the representation of special groups, such as, women and other marginalised social groups, including marginalised ethnic communities within a county.39 The CGA of 2012 requires that six members be chosen by political parties to represent the marginalised groups. 40 However, the Elections Act (2011) provides for four names, which is the number that was used in 2013, as per section 7(3) of the CGA, to represent the marginalised groups, including the marginalised communities. 41 The Elections Act, further, requires political parties to nominate eight people for the positions from either person with disability (PWD) or youths, four for each group.42 Article 36(3) of the Elections Act, further affirms that priority should be given to the above categories but also introduces a possibility for the representation of 'any other marginalised group' category. The IEBC General Guidelines to political parties on the nomination for the special seats, like the Constitution,43 exempts the members of county assemblies special list from the need to reflect the regional and ethnic diversity of the people of Kenya.44 In its Specific Guidelines, however, it requires that out of the eight nominees for special seats, there should be two seats each for the PWD, the youth and the marginalised groups. The excluded ethnic communities fall under the third category. The number of nominees that a political party may have for the special seats is however dependent on its performance in the normal electoral process. The better it performs the larger the number of nominees it can forward for the special seats. This arrangement is clearly skewed in favour of parties that are supported by the larger ethnic communities and disfavours those supported by smaller communities.
Furthermore, the Constitution - by requiring that a county executive reflects the "community and cultural diversity" of the county - implicitly requires the political inclusion of all ethnic communities of a county in the appointment of members of the CEC.45 The CGA, enacted by Parliament, thus requires county governors to ensure that their executive committees represent the community and cultural diversity of their respective counties.46 The Act further authorises the County Assemblies to reject the list of nomination submitted by a county governor if it is not inclusive of the ethnic diversity of the county.47
3.3. Political parties and ethnic inclusion
Kenya's political parties historically have been organised along ethnic lines, despite purporting to promote a national agenda and to have a national outlook. In the past political parties have been used to divide Kenyans along ethnic lines, resulting in the exclusion of several ethnic communities.48 With a view to curtailing the political exclusion of ethnic communities, the Kenyan Constitution of 2010 puts some restrictions on ethnic mobilisation by political parties.
The Constitution expressly states that political parties cannot be formed along ethnic lines and that they should have a national outlook.49 Article 91 of the Constitution further requires political parties, among others, to respect the right of all persons to participate in the political process, including minorities and marginalised groups.50 This clearly means political parties are expected to be inclusive of all ethnic communities of the country.
With a view to giving effect to this and other constitutional principles, the Political Parties Act (PPA) of 2011 was enacted. The Act requires that in order to be registered, a political party should have not less than 1000 registered voters from more than half of the 47 counties.51 Moreover, the list of voters is required to reflect the regional and ethnic balance and representation of minorities and marginalised groups.52The Act further requires that the composition of the political party's governing body should reflect, among others, regional and ethnic diversity. To this effect, Schedule 2 of the Act requires that the ethnic affiliations of members of a political party be indicated as part of the registration process.53 As will be discussed below, this legal measure has not prevented the organisation of political parties along ethnic lines. Moreover, section 7(2) of the CGA requires political parties to ensure that "community and cultural diversity of the county is reflected in the county assembly" It further requires them to ensure the "adequate representation" of, and to protect, "minorities within the county in accordance with Article 197 of the Constitution".
4 THE 2013 ELECTIONS AND THE POLITICAL INCLUSION OF ETHNIC COMMUNITIES
The above shows that the 2010 Kenyan Constitution not only recognises that Kenya's political history is replete with ethnic-based political exclusion but also seeks to curb this trend. To this effect, not only does it recognise the ethnic diversity of the Kenyan people, it also contains several provisions that are meant to ensure the political inclusion of hitherto excluded ethnic communities. It creates 47 counties, thereby territorially accommodating several ethnic communities, even though at the same time creating intra-county ethnic minorities. It creates various political institutions at county level, thereby widening the opportunities that all ethnic communities have for political representation. Furthermore, the Constitution requires that political parties should be inclusive of, among others, the various ethnic communities of the country and that the composition of the political institutions of the counties should reflect the ethnic diversity in the relevant counties.
Two-and-a-half years after the adoption of the new Constitution, general elections were held. The President, members of the National Assembly and the Senate, members of County Assemblies, county governors and deputy governors were elected in these elections. Over 50 political parties - independently or organised under different coalitions - took part in the elections. The question is whether the constitutional promise of ethnic inclusiveness has found practical expression in the 2013 elections. In order to answer this question, the following section will first identify the ethnic alignment of the political parties followed by an analysis of the 2013 election results.
4.1 THE ETHNIC ALIGNMENT OF KENYA'S POLITICAL PARTIES
It is difficult to ascertain the ethnic affiliation of each of the over 1 450 MCAs, even though one may conjecture about that, based on the names of the MCAs and the area from which they were elected. It is however possible to gain a general picture of the ethnic inclusiveness of the devolved system by looking into the core ethnic support base of the political parties that have won seats in County Assemblies. It is common knowledge that Kenya's political parties are personalised in the sense that they are organised around prominent political figures whose core political support bases are the ethnic communities to which they belong.54 This is so despite the constitutional requirement that political parties should have a national outlook and composition. Moreover several studies show that Kenyans tend to vote largely as "ethnic blocks".55 It is thus imperative to go beyond the veil of "national outlook" and examine the support base of the political parties in order to gain a clear picture of the extent of the ethnic inclusiveness of the counties' political institutions. Given the ethnic alignment of Kenya's political parties, one can make a general assumption that the larger the number of political parties that are represented in a county assembly, the larger the number of ethnic communities likely to have been represented in the County Assembly.
As was mentioned above, over 50 political parties contested the 2013 Kenyan general elections. These parties were either members of one of the three major coalitions or informally lend and receive support from the three coalitions. The three major coalitions, which are composed of over 20 smaller political parties, are the Coalition for Reforms and Democracy (CORD), the Jubilee Coalition, and the Amani Coalition. The CORD is composed of more than 10 political parties. The Orange Democratic Movement (ODM), Wiper Democratic Movement of Kenya (WDM-K) and Forum for the Restoration of Democracy- Kenya (FORD-Kenya) are the most important members of the CORD.56 The Jubilee Coalition is formally made up of four political parties: the National Alliance (TNA), the National Rainbow Coalition (NRC), the United Republican Party (URP), and the Republican Congress (RC). The Amani Coalition has three, main, political parties as its members: New Ford Kenya, United Democratic Forum (UDF), and Kenya African National Congress (KANU).
Each of the political parties, constituting the three coalitions, is organised around a prominent political figure who garners political support and votes principally from his/her own ethnic community. According to Otele and Etyang, the five major political parties, which control 70 percent of the seats in the National Assembly, received votes, principally, from counties belonging to the ethnic communities of the leaders of the parties. 57 For instance, Uhuru Kenyatta, Charity Ngilu and William Ruto head the TNA, NARC and URP, respectively, of the Jubilee Coalition. Uhuru is from the Kikuyu community while Ruto and Ngilu are from the Kalenjin and Kamba communities, respectively. In the 2013 presidential elections, Uhuru received his major support from the Kikuyu community and Kikuyu dominated counties such as Kiambu, Muranga, Nyeri, Kirinyaga, and Nyandarua.58 Presumably because of his alliance with Ruto, a Kalenjin, Uhuru also received many votes from the Kalenjin counties of Uasin Gishu, Nandi, Elgeyo-Marakwet, Baringo, Bomet and Kericho. Similarly, Raila Odinga, Kalonzo Musyoka, and Moses Wetangula head the ODM, WDM-K, and FORD-Kenya, respectively the three principal members of CORD. Odinga's major support came from Luo counties including Kisumu, Migori, Homabay and Siaya. His alliance with Kalonzo Musyoka, a Kamba, also brought Odinga votes from the Kamba counties of Machakos, Kitui and Makueni. It should be noted though that in several instances, Odinga received significant votes outside his Luo base, in his own right, as in the coastal region of Kenya. The leader of UDF, Musalia Mudavadi, received most votes from his Luhya community, a reflection of his party's support base.59
The above does not however mean that each of the existing political parties receives support exclusively from a single ethnic community. This is not even legally permissible since, as was mentioned above, the Constitution requires each political party to be inclusive of diverse ethnic communities.
4.2 Ethnic inclusion in County Assemblies
As mentioned above, the Jubilee and the CORD are the two major coalitions in Kenya. The presidential candidates of these two coalitions received approximately 94 percent of all the votes cast in the 2013 presidential elections.60 The Jubilee Coalition managed to win the presidential elections and, therefore, the CORD lost the presidency. In the absence of the sub-national political structures, the CORD - with all the political parties constituting it and the ethnic communities supporting them- would have remained with little political influence in the country's political life considering they are in a minority in the National Assembly.
Thanks to the devolved system of the country, the CORD became the ruling party in more counties than the Jubilee, even though the latter had won the presidency. Political parties belonging to the CORD Coalition now control 24 of the 47 counties, including Nairobi, the capital of Kenya. Members of the Jubilee Coalition are in control of the rest, 23 counties.61 Moreover, TNA, the core party of the Jubilee Coalition, controls the majority seats in 9 County Assemblies, while the ODM and URP control the majority seats in 8 and 7 counties respectively. The Wiper and UDF each form a majority in a single county. These political parties form a majority, mainly, in the counties where their core ethnic support base also forms a majority. For instance, as can be seen in Table 3 below, the TNA, whose core support base is the Kikuyu community, controls the majority seats of the assemblies of seven Kikuyu dominated counties: Nyandarua, Nyeri, Kirinyaga, Muranga, Kiambu, Laikipia and Nakuru. The other two are Embu County, dominated by the Embu, an ethnic community closely related to the Kikuyu, and Kajiado County, dominated by the Maasai, but has a sizable Kikuyu population as well. The URP, whose core support base is the Kalenjin ethnic community, controls the majority seats of the assemblies of the six Kalenjin dominated counties: Bomet, Kericho, Baringo, Nandi, Elgeyo-Marakwet, and Uasin Gishu.62 UDF, a political party whose support base is considered to be the Luhya community, forms a majority in Vihiga, a Luhya dominated county, and the home county of its leader. This is also the case with the Wiper Party, whose major support base is the Kamba community and forms a majority in Kitui County, a Kamba dominated county and the home county of its party leader, Kalonzo Musyoka. From this, one may safely assume that the devolved system has indeed improved the political inclusion of the ethnic communities of Kenya.
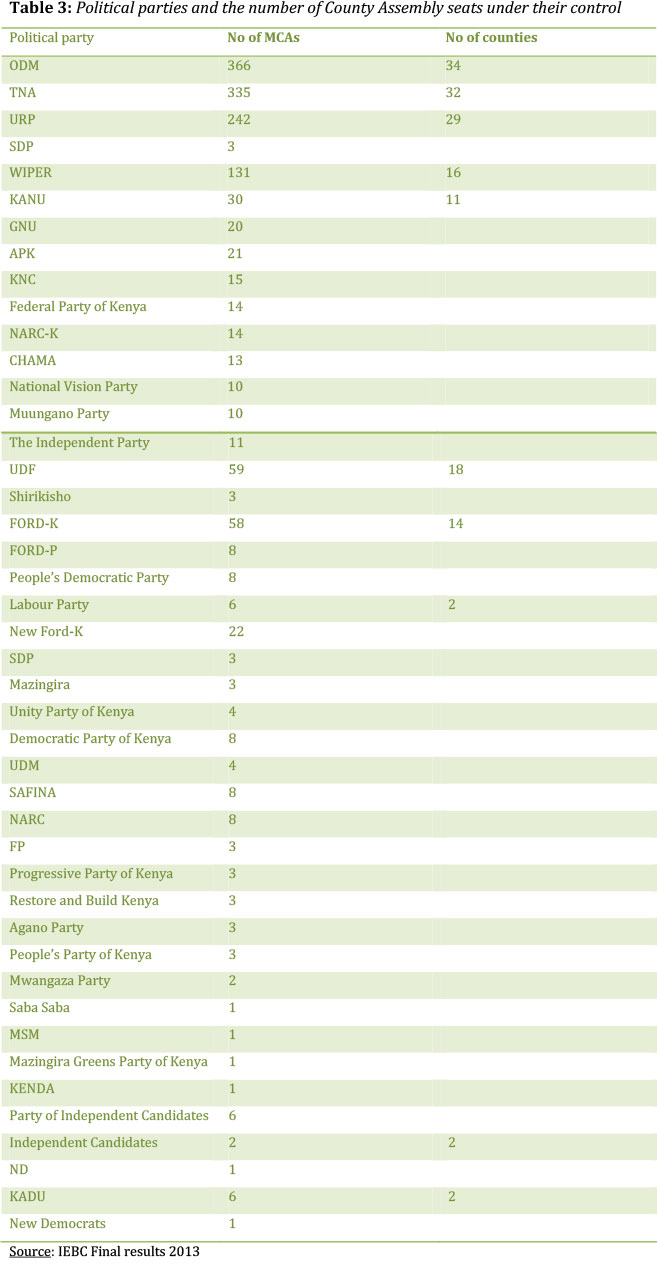
However, as can be seen from Table 3 above, the parties, which the five largest ethnic communities presumably support, control 74 percent (1074 of 1443) the total County Assembly seats.63 This shows that the political parties that are strongly supported by the five largest ethnic communities have secured the political control of their respective sub-national turfs. These communities in any case had some level of political visibility at the national level even under the centralised system. Thus, one may argue, the above does not show that the devolved system has set a trend of an enhanced political inclusion as far the remaining 39 or so small and historically excluded ethnic communities are concerned.
It should, however, be noted that there are several counties where small and hitherto excluded communities are found in the majority. Small ethnic communities, such as, the Taita, the Pokot, the Orma, the Turkana, the Mijikenda, and the like, are now numerically dominant in one or a few more counties. These communities, being in majority in these counties, are in a position not only to be represented in the County Assemblies of their counties but also to be in control of the majority seats therein. This is likely to be the case regardless of the political party/parties in control of the County Assemblies in these counties since no political party is likely to win elections in these counties without fielding candidates who are affiliated to the relevant ethnic communities.
Moreover, as can be seen from Table 3 above, over 44 political parties, constituting over 80 percent of all the political parties in the country, are represented in one or more County Assemblies, even though the ODM, TNA, URP and Wiper together control over 74 percent of the County Assembly seats. Given the ethnic alignment of the political parties, coupled with the fact that the great majority of the existing political parties are represented in the County Assemblies, one can safely assume that a greater number of ethnic communities are politically represented than was the case under the centralised system. To this extent, the argument goes, devolution has allowed the political inclusion of numerous ethnic communities of the country, including those that were previously excluded.
One may however counter the above argument by indicating the existence of over 5000 elected local councils in the pre-2010 political dispensation, which allowed a more enhanced representation for small communities at the local level. Such argument however ignores the political and constitutional significance the counties compared to the old local councils. The counties are constitutionally established subnational units with significant political and financial power. The local councils on the other hand were deconcentrated units of the national government with little political significance.
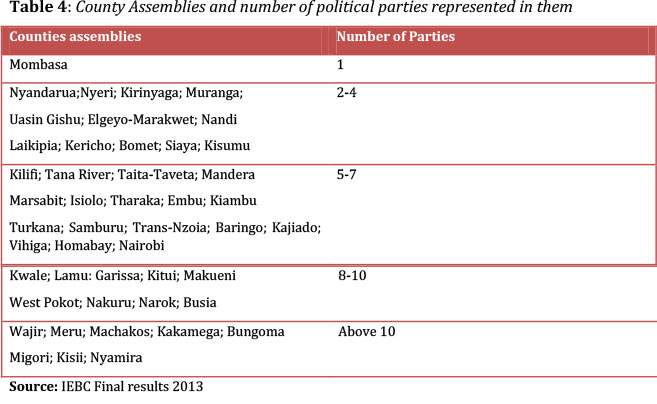
Further, with the exception of the Mombasa County Assembly, no County Assembly is fully controlled by a single political party. Two or more political parties are represented in the Assemblies of the other Counties. In 21 County Assemblies, which constitute 45 percent of all the County Assemblies, no single political party even forms a majority; a coalition of parties forms a majority in each of these County Assemblies. Some 12 counties have between two and four political parties in their Assemblies. The rest of the counties (72 percent) have between five to 14 political parties in their Assemblies. Bungoma and Kisii Counties, with 14 political parties represented in their assemblies, have the highest number of political parties. Wajir, Meru, Machakos, and Migori counties, each of which has 13 political parties, follow these.
Given the ethnic alignment of the political parties, the representation of numerous political parties within each County Assembly is, at least to some extent, due to the representation of numerous ethnic communities in each county, including intra-county minority ethnic communities. Thus, for example, some three members of the Nakuru County Assembly, belong to minority groups of the county. In Kiambu, an individual from an intra-county minority community has been elected to the County Assembly. Likewise, three individuals from intra-county minority ethnic groups have been elected into the Uasin Gishu County Assembly representing three different political parties.64
Furthermore, wards, which are often small and relatively ethnically homogenous, are used as electoral constituencies in county elections. In Kenya, where voters are mobilised along ethnic lines, a political party is less likely to win county elections in a given ward unless it fields a candidate belonging to the ethnic community that is in the majority in the ward. The existing political parties thus have no choice but to create alliances with different political figures from within such community. The political figures provide endorsement of the one or other of the strongest parties and the political parties recruit these political figures as their members and field them as candidates in the wards where the relevant ethnic communities are found to be in the majority.
The above is clearly apparent in the county elections results. As can be seen from Table 4, a small number of political parties is represented in the Assemblies of the counties where the largest five or so ethnic communities are in the majority. These include the political party that the respective ethnic community is assumed to support, and fewer than five other political parties are represented in these County Assemblies. Moreover, the seat distribution shows that the dominant parties in the assemblies of these counties control the great majority of the seats leaving only a handful of seats to the other parties. On the other hand there is a great diversity of political parties in the Assemblies of the counties where smaller ethnic communities, or those that do not have a single strong political party, are dominant. This is an indication of the fact that members of the small communities, or those from communities without a single strong political party, run for elections as candidates of one or other of the strongest political parties or supporting preferred presidential candidates of the bigger political parties. In the process, the votes of members of such ethnic communities are divided among the different political parties. .
While it is clear that the newly introduced devolved system and the 2013 election show a positive trend of greater ethnic inclusion, it nonetheless does not mean that the majority-minority political tension has been resolved. As has been stated above, almost each county has an ethnic community that is in the majority and several others that constitute the minority. The largest five ethnic communities form the majority in most of the counties. This means that the majority-minority tension is bound to resurface at county level. Moreover, in Kenya's political culture where ethnic identity and political loyalty often converge, the representation of intra-county minority ethnic communities by one or a few more members of a County Assembly, despite having an important symbolic value for previously excluded communities, does not allow the community to significantly influence policies and legislation.
4.3 COUNTY EXECUTIVES AND ETHNIC INCLUSION
As mentioned above, under the centralised system, Kenyan politics was such that those from small communities had a slim opportunity to rise to the national leadership. Devolution, through the creation of the offices of a governor and a deputy governor and other executive positions at the county level, presents a significant opportunity of political inclusion, for those from hitherto excluded communities to have access to political positions.
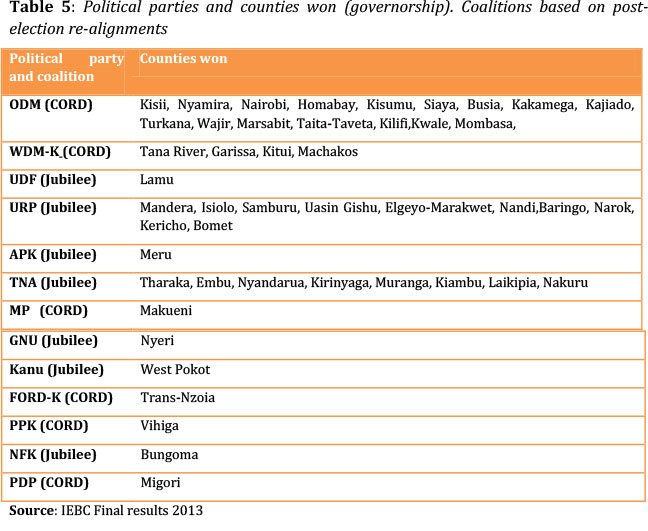
A close look at the 2013 election results shows that 14 political parties control the offices of governor and deputy governor in different counties. In 16 of the 47 counties, the ODM has control of these two executive offices, followed by URP and TNA, each of which control these executive offices in 10 and 8 counties and WDM-K, which controls 4 counties. Small political parties, such as, FORD-K, PPK, MP and PDP (both members of the CORD Coalition), UDF, NFK, KANU, APK, and GNU (members of the Jubilee Coalition) control these offices in a single county each. One can safely assume that given the ethnic alignment of the Kenyan political parties, the fact that 13 political parties are in charge of the governorship and deputy governorship offices in different counties is likely to have allowed the political inclusion of a larger number of ethnic communities than would have been the case under the centralised system.
This is not a mere conjecture. A close look at the ethnic background of governors shows that the governorship in 23 counties went to individuals belonging to ethnic communities that were either excluded from, or inadequately represented in, national politics including the Turkana, the Somali, the Coastal people, the Maasai, the Kisii, and the like. Moreover, in some cases the individuals holding the governorship and deputy governorship are not from the same ethnic community. For instance, the governors and deputy governors of Lamu, Migori, Trans Nzoia, Embu, Busia, Bungoma, Isiolo, Nakuru, Nairobi and Marsabit are from different ethnic communities. While almost in all cases county governors are from the ethnic communities forming the majority in the respective counties, the deputy governors, in most cases, but not always, are held by individuals belonging to the second largest ethnic communities in the counties. The motive for this is not always a benign need of ensuring the political inclusion of hitherto excluded communities. It is rather a political calculation intended to gain political support from different ethnic communities. Nonetheless, it has brought about the inclusion of a larger number of ethnic communities. As already stated earlier, there is a statutory requirement to the effect that the appointment of members of a CEC take into consideration the need to ensure the representation of the various ethnic communities within a county. Failing that, a County Assembly may refuse to approve the nominees for the position.
However, a look at the ethnic composition of the executive committees of many counties shows not all ethnic communities in counties are represented in most cases.65
The governor of the Nakuru County, for instance, appointed, of the ten members of the CEC, four from the Kikuyu community, three from the Kalenjin community, and one each from the Luo, Kisii and Meru communities. Thus, despite having more than 10 ethnic communities in the county, seven of the ten positions in the CEC of this county are held by individuals belonging to just two ethnic communities with none from five ethnic communities. In Laikipia County, individuals belonging to the Kikuyu community comprise four of the eight members of the county CEC while a single individual represents each of the Samburu, Maasai, Turkana, and Kalenjin communities. This means only five of the, at least, 12 ethnic communities in the county are represented in this county executive committee. The ethnic inclusiveness of Laikipia CEC, thus, became a matter of litigation in the case of Mathew Lempurkel v Joshua Wakahora Irungu County Governor, Laikipia County & 2 others.66The petitioner claimed that the respondent had violated section 35(1) of the County Government Act67 by failing to elect a person from the Samburu community to the Laikipia's CEC, although the Samburu community constitutes a substantial minority in the county. The Act requires that the CEC should reflect the community and cultural diversity of the county as much as possible. The petitioner also relied on Articles 10 and 232 of the Constitution, which emphasise inclusiveness and protection of marginalised ethnic communities.
Tana River County, which in the past experienced several violent ethnic conflicts, has several ethnic communities including the Pokomo, Orma, Wardei, Malakote, Munyoyaya, Akamba, Bajuni and Kikuyu. The Governor of this county appointed the nine members of the CEC from only the Pokomo, Orma, and Wardei communities leaving the other unrepresented. A resident in the county thus filed a case in court claiming lack of ethnic inclusiveness in the CEC in Republic v Tana River County Assembly & 2 others.68The Court ruled that the list did not comply with Article 197(2) of the Constitution, which is about the need for the Committee to reflect the county cultural diversity in the county. The court also ruled that the governor had failed to observe Article 10 on the national principles and values of inclusiveness, Articles 174 of the Constitution on the objects of devolution, which includes recognition, protection and promotion of minorities and marginalized communities, and section 35 of the CGA. The latter requires the governor and the County Assemblies to ensure that the minorities and marginalised communities are properly included and that affirmative action is taken to ensure that people from such communities qualify for the appointments as stated in Article 56 of the constitution.
Likewise, Bungoma County, which has more than six ethnic communities including the Bukusu, Batura, Tachoni, Teso, Sabout, and Bongomek, was also taken to court in the case of John Mining Temoi & another v Governor of Bungoma County & 17 others69over the lack of ethnic inclusiveness in its County Chief Officers appointment.
The issue was that the Bongomek community was not represented in any county administration. The Court ruled that the Bongomek community was among the marginalised communities that needed representation.70
Lastly, in Marsabit County, which has over 14 ethnic communities, its ten CEC slots were divided among individuals from the Borana, Gabra, Rendille, Burji, Garre and Asharaf communities. Even though this appears to be a balanced representation, the late 2013 Marsabit conflicts were allegedly caused, among others, by the lack of ethnic inclusion in the county.71
5 CONCLUSION
Kenya has been under an extremely centralised government system for over half a century that resulted in the political and economic exclusion of many ethnic communities while bringing about inequitable political and economic benefits to a few individuals hailing from specific ethnic communities. The 2010 Constitution has thus introduced a devolved system, among others, with the purpose of doing away with such political system and culture of exclusion.
The 2010 Constitution recognises the ethnic diversity of the Kenyan people. It also provides, at least implicitly, territorial and non-territorial institutional mechanisms for the purpose of ensuring their equitable political inclusion. It provides for the creation of 47 counties as autonomous sub-national territorial and political units. In some of the counties previously excluded ethnic communities now form majority. The Constitution also creates over 1400 representative positions and hundreds of executive offices at sub-national level. These have enhanced the opportunities that each ethnic community has for political representation. The Constitution requires political parties to have "a national outlook" which requires them to be ethnically inclusive. The composition of County Assemblies and some of the executives, which were formed after the 2013 elections, the first elections after the adoption of the 2010 Constitution, also demonstrates a certain level ethnic inclusiveness.
Yet the problems associated with ethnic based political exclusion of minorities are far from resolved. The very devolved system, which is meant to resolve this quandary, has created new minorities almost in all counties. Indeed, there are enhanced opportunities for the political representation of members of intra-county minorities. Yet, they are still at the mercy of the community that is in the majority in terms of crafting policies and legislation on social and economic matters that are beneficial for their communities. This includes access to job opportunities at the county government for members of the minority communities, especially those that are politically in the opposition. Moreover, some of the intra-county minorities are from communities that ancestrally hail from other counties and are often found territorially dispersed throughout a county. There is no institutional guarantee that members of such ethnic communities are politically included. Furthermore, the national executive still retains a significant political and economic clout and hitherto excluded communities are not necessarily guaranteed representation in it. Other challenges include the difficulty of determining what constitutes an ethnic community with the purpose of ensuring ethnic inclusion in both national and county governments, considering that there are more than 100 tribes and sub-tribes and even clans at the county level. In addition, there is a problem of how to assign the people that do not care to which ethnic community they belong or those that belong to several ethnic communities.
1 Kanyinga K "Pluralism, ethnicity and governance in Kenya" in Ghai YP & Cottrell J (eds) Ethnicity, nationhood, and pluralism: Kenyan perspectives Ottawa: Global Centre for Pluralism (2013) 66- 72. [ Links ]
2 Sundet G & Moen E Political economy analysis of Kenya Oslo: Norwegian Agency for Development Cooperation (2009) available at http://www.norad.no/globalassets/import-2162015-80434-am/www.norad.no-ny/filarkiv/vedlegg-til-publikasjoner/political-economy-analysis-of-kenya.pdf (accessed 25 September 2015). [ Links ]
3 Bosire CM (2013) Devolution for development, conflict resolution, and limiting central power: an analysis of the constitution of Kenya (unpublished PhD thesis), University of the Western Cape). [ Links ]
4 Republic of Kenya Report of the Commission of Inquiry into the Illegal/Irregular Allocation of Public Land" (2004). [ Links ]
5 Kindiki K "The emerging jurisprudence on Kenya's constitutional review law" (2007) 153 (1) Kenya Law Review 153. [ Links ]
6 Romero R "To what extent did ethnicity and economic issues matter in the 2007 disputed Kenyan elections?" (2013) 31 (3) Development Policy Review 292. [ Links ]
7 Romero (2013) 292.
8 Bosire (2013).
9 South Consulting The Kenya National Dialogue and Reconciliation (KNDR) Monitoring Project: Report on status of implementation (2009) available at http://south.co.ke/index.php/projects-and-reports/kndr-project/2-uncategorised/11-review-reports (accessed 30 November 2016).
10 Kenya: Commission of Inquiry into Post-election Violence (CIPEV) Final report (2008) available at http://reliefweb.int/sites/reliefweb.int/files/resources/15A00F569813F4D549257607001F459D-Full_Report.pdf accessed 22 August 2015).
11 Kindiki (2007) 153.
12 Republic of Kenya: Kenya Gazette Supplement: Constitution of Kenya Review Act No 9 (2008) Ss 4 (d) & (f).
13 Fessha Y (2010) Ethnic diversity and federalism: constitution making in South Africa and Ethiopia Farnham: Ashgate (2010) 19. [ Links ]
14 See Article 5 of Federal Democratic Republic of Ethiopia (FDRE) Constitution (1995); Section 6 (1) of Constitution of the Republic of South Africa Act 108 (1996).
15 FDRE Constitution (1995) Arts 39 (3) & 46 (2).
16 See Ayele Z A "The politics of sub-national constitutions and local government in Ethiopia" (2014) (6) 2 Perspectives on Federalism 89-115. [ Links ]
17 Republic of Kenya: Kenya Law Reports: Constitution of Kenya (2010) Art 174(b).
18 Constitution of Kenya 2010, First schedule.
19 Bosire (2013) 257.
20 See Fessha (2010).
21 Star Reporter "Ruto's plan to revive KAMATUSA" available at http://www.the-star.co.ke/news/article-23988/rutos-plan-revive-kamatusa (accessed 2 October 2014).
22 Nyukuri B The impact of past and potential ethnic conflicts on kenyan's stability and development A paper prepared for the USAID Conference on Conflict resolution in the Greater Horn of Africa June (1997) available at http://citeseerx.ist.psu.edu/viewdoc/download?doi=10.1.1.596.7855&rep=rep1&type=pdf (accessed 30 November 2016). [ Links ]
23 Horowitz J "Ethnic groups and campaign strategy in Kenya's 2007 election" (University of California, San Diego) (2009) available at http://cega.berkeley.edu/assets/miscellaneous_files/wgape/17_Horowitz.pdf (accessed 30 November 2016). [ Links ]
24 The Kenya National Bureau of Statistics (KNBS) Population and Housing Census, 2009 available at http://www.knbs.or.ke/index.php?option=com_phocadownload&view=category&id=109:population-and-housing-census-2009&Itemid=599 (accessed 20 August, 2015).
25 Nation Reporter "Draft: MPs seek more counties for marginal groups" Daily Nation 1 March 2010.
26 Bosire (2013) 257.
27 Bosire (2013) 124.
28 Constitution of Kenya 2010 Art 176(1).
29 Constitution of Kenya 2010 179(2)(b).
30 Constitution of Kenya 2010 Art 179(4).
31 This is indeed a reduction in number of elected representatives compared to the former 5000 or so elected local authorities. However, as will be discussed below, members of the county assemblies have more political powers and significance.
32 Constitution of Kenya 2010 Art (235)(a).
33 Constitution of Kenya 2010 Art 90 (2)(c).
34 Constitution of Kenya 2010 Art 197(2)(a).
35 Constitution of Kenya 2010 Art 177(1)(a).
36 Constitution of Kenya 2010 Art 177(1)(a).
37 The FPTP seeks to identify winners in electoral contestations rather than ensuring, unlike the Proportional Representation (PR) system, the equitable representation of all social groups. FPTP may thus be exclusionary. It may however allow the representation of a certain ethnic community in a subnational assembly if members of the community are found in one or more the electoral districts of the sub-national unit. Wolff S "Electoral-systems design and power-sharing regimes" in O'Flynn I & Russell D (eds) Power sharing: New challenges for divided societies London: Pluto Press (2005) 62.
38 Republic v Independent Electoral and Boundaries Commission & another Ex-Parte Councillor Eliot Lidubwi Kihusa & 5 others [2012] eKLR p 144.
39 Constitution of Kenya 2010 S 177(1)(c). In the case of marginalised groups, their number is left for national legislation to determine and even though only persons with disabilities (PWDs) and youths are explicitly mentioned in the Constitution, the list is not exhaustive as the Constitution uses the word "including".
40 Republic of Kenya: Kenya Gazette Supplement County Government Act (CGA) No 17 (2012) Sec 7(1)(a).
41 Republic of Kenya: Laws of Kenya: Elections Act (EA) (2011) S 36(8).
42 EA S 36(1) (f).
43 Constitution of Kenya 2010 Art 90(c).
44 Independent Election and Boundary Commission (IEBC) "Party list formula and submission rules" available at http://www.iebc.or.ke/index.php/media-center/press-releases/item/party-list-formula-and-submission-rules?category_id=7 (accessed 26 October 2014).
45 Constitution of Kenya 2010 Art 197(2)(a).
46 CGA S 35(1).
47 CGA S 35(2)(b).
48 Commission of Inquiry into Post Election Violence (2008), 216.
49 Constitution of Kenya 2010 Art 91(2)(a).
50 Constitution of Kenya 2010 Art 91(e).
51 Republic of Kenya: Laws of Kenya: Political Parties Act (PPA) (2011) S 7(2)(a).
52 PPA S 7(2)(b).
53 PPA Schedule 2(6)(e).
54 Kadima D & Owuor F "Kenya's decade of experiments with political alliances and coalitions" (2014) 13 (1) Journal of African Elections 150. [ Links ] See also Friedrich Ebert Stiftung (FES) (2010) Institutionalizing political parties in Kenya Nairobi: Friedrich Ebert Stiftung (FES) (2010).
55 Bratton M & Kimenyi MS Voting in Kenya: Putting ethnicity in perspective Economics Working Papers. Paper 200809 (2008). Available at http://digitalcommons.uconn.edu/econ_wpapers/200809 (accessed 24 November 2016).
56 The other members of the coalition include The Independent Party, KADDU-Asili, Peoples Democratic Party, Mkenya Solidarity Movement, Chama Cha Uzalendo, Muungano Development Movement Party of Kenya, United Democratic Movement, Chama Cha Mwananchi, Federal Party of Kenya, Labour Party of Kenya.
57 Otele O M & Etyang O "Institutionalisation of political parties? A reflection on the 2013 elections in Kenya" 2014 3 (3) Research Journal in Organizational Psychology and Educational Studies 141. [ Links ]
58 Otele & Etyang (2014) 141.
59 Independent Election and Boundary Commission (IEBC) General election results and CAW nominee list files (2013) available at http://www.iebc.or.ke/index.php/component/search/?searchword=2013+electi on+result&ordering=&searchphrase=all.(accessed 26 March 2015).
61 Makabila S "Why control of Kenya's 47 governors is the next battlefront" (Standard, 4 August 2013) available at http://www.standardmedia.co.ke/print/2000090090/why-control-of-governors-is-the-next-battlefront.(accessed 23 October 2014).
63 The other seven MCAs were either elected unopposed or their election took place on a different day.
64 IEBC (2013).
65 National Cohesion and Integration Commission (NCIC) Ethnic & diversity audit of the county public service (2016). Available at https://www.cohesion.or.ke/images/downloads/Ethnic%20and%20Diversity %20Audit%20of%20the%20County %20Public%20Service%202016.pdf (accessed 28 September 2016).
66 Mathew Lempurkel v Joshua Wakahora Irungu County Governor, Laikipia County & 2 others [2013] eKLR.
67 Act No. 17 of 2012.
68 Republic v Tana River County Assembly & 2 others [2014] eKLR.
69 John Mining Temoi & another v Governor of Bungoma County & 17 others [2014] eKLR.
70 The Bongomek community has a population of 3 704 out of a population of over two million in Bungoma County according to the 2009 Population and Housing Census Report.
71 Mohamud N & Mosley J "Insecurity in northern Kenya: Is the government losing its grip?" (African Argument, 6 January 2014) available at http://africanarguments.org/2014/01/06/insecurity-in-northern-kenya-is-the-government-losing-its-grip-by-nuur-mohamud-sheekh-and-jason-mosley/ (accessed 6 October 2014).
