


Services on Demand
Article
 English (pdf)
 Article in xml format
 Article references
Indicators

Related links
-
 Cited by Google
 -
 Similars in Google
Share

 Permalink
Health SA Gesondheid (Online)
On-line version ISSN 2071-9736
Print version ISSN 1025-9848
Health SA Gesondheid (Online) vol.20 n.1 Cape Town 2015
http://dx.doi.org/10.1016/J.HSAG.2015.02.001
The BETA® nursing measure: Calibrating construct validity with Rasch analyses*
Hendrik J. LoubserI, II, **; Daleen CasteleijnIII; Judith C. BruceIV
ISouth African Database for Functional Medicine, Johannesburg, South Africa
IIDepartment of Nursing Education, University of the Witwatersrand, South Africa
IIIDepartment of Occupational Therapy, University of the Witwatersrand, Johannesburg, South Africa
IVSchool of Therapeutic Sciences, University of the Witwatersrand, Johannesburg, South Africa
ABSTRACT
BACKGROUND: The BETA nursing measure has been introduced as a tool to routinely measure and monitor the outcomes of patients' activities of daily living in a restorative nursing care context.
OBJECTIVES: To investigate the BETA's construct validity using the Rasch model with specific reference to the BETA's potential to be used as an interval scale providing metric or interval data.
METHOD: A quantitative analytical design was followed using Rasch analyses whereby BETA raw data was collected from patients (n = 4235) receiving nursing care in 28 South African sub-acute and non-acute nursing facilities. The data was prepared for Rasch analyses and imported into WINSTEP® Software version 3.70.1.1 (2010). Final results were shown by means of figures and graphs.
RESULTS: A successful outcome was achieved by dividing the BETA into four subscales. In this process one of the original BETA items was omitted and seven other items required collapsing of their categories before the four subscales achieved a satisfactory fit to the Rasch model
CONCLUSION: The four BETA subscales achieved "very well" to "excellent" levels of fit to the Rasch model. This finding thus creates an opportunity to convert the BETA's Likert qualities into an interval measure to calculate change in patients' activities of daily living metrically as a direct result of effective restorative nursing.
Keywords: Beta, Nursing, Routine, Measure, Validity, Rasch, Activities of daily living, Restorative nursing, Rehabilitation
1. Introduction
1.1. Background
Nurses in the specialised fields of rehabilitation, gerontology and long-term care share the same objective - they have to maximise the functional ability of people living with temporary or permanent disability, commonly known as restorative nursing. There is a lack of objectively validated nursing tools to routinely and empirically establish a patient's functional ability (Loubser, 2012). This means that neither the caregivers nor the nursing staff working routinely with these patients have any method for accurately measuring, communicating, monitoring or calculating their patients' restorative nursing care plans. To bridge this incongruity, a routine nursing scale to measure patients' activities of daily living, named the BETA, has been developed. The development was done with South African nurses and its utility in nursing was tested (Loubser, Bruce, & Casteleijn, 2013). Before implementing the BETA as a routine nursing measure, its construct validity, including its ability to be successfully converted from an ordinal scale with basic Likert scoring qualities into an interval measure with metric measurement qualities had to be tested. Once validated and successfully converted, the BETA measurements can be used in metric analyses to calculate changes in patients' activities of daily living as a result of effective restorative nursing. This article reports on the BETA's construct validity properties using the Rasch measurement model.
1.2. The Rasch measurement model (RMM)
The concept of internal construct validity refers to how well a scale correlates with the construct that it purports to measure in order to be successfully operationalised (Linacre, 2010). With this in mind, there is a strong tendency to move from qualitatively-ordered scales, e.g. those producing Likert-related ordinal scores not useful in inferential statistics, towards quantitatively-ordered interval measures that can be applied in metric outcomes analyses (Bond & Fox, 2007). The RMM is suited to perform this transformation. Although the RMM has been widely used in the education sciences over the last 40 years, this method of validating scales only became popular in the health sciences in the last decade with the reporting of a variety of health care measures being validated by the RMM (Tennant & Conaghan, 2007).
In the 1960s, George Rasch, a Danish mathematician, tried to find a solution for a particular problem the Danish Department of Defence experienced with educational tests. He discovered the relationships between human abilityversus item difficulty and concluded a logic that became popular. Rasch detected an underlying probability principle in a data matrix of a well-constructed dichotomous test: "a person having a greater ability than another person should have the greater probability of solving any item of the type in question, and similarly, one (test) item being more difficult than the other means thatfor any person the probability ofsolving the second (test) item is the greater one" (Rasch, 1960, p. 117). This principle led him to devise a mathematical model to develop rules for a hypothetically perfect fundamental measure for social scientists, today known as the Rasch Measurement Model (RMM).
The original RMM was invented for dichotomous (yes/no response options) measures; and the Rasch relationship equation of the simple dichotomous formula is as follows:
Bn - Di = log(Pni/(1 - Pni))
where
Bn = Ability measure of person n
Di = Difficulty calibration measure of item i
Pni = Probability of a correct response from person n on item i
1-Pni = Probability of an incorrect response from person n on item i
In non-mathematical terms the logarithm of the odds ratio between the probability of passing an item and the probability of failing an item equals the difference between the ability of the person and the difficulty of the item. More explicitly, the Rasch analysis enables the calibration of item difficulty (e.g. where Di is placed on the straight line) and person ability (e.g. where Bn is placed on the same straight line). As both these calibrations are expressed in logits (log-odds probability units), they are additive in nature (Kottorp, 2003). The perfection of the RMM lies in its simplicity which also renders it applicable to all human sciences and is "currently the closest generally assessable approximation of fundamental measurement principles in the human sciences" (Bond & Fox, 2007, p. 14).
As the BETA has a polyotomous design (three or more response options) and characteristics, the Rasch-Masters Partial Credit Model was used in this study (PCM). Masters (1982) devised this Rasch derivative in an attempt to give partial credit for achieving a partially correct score when the "partial-correctness" structure differs from item to item in the same scale. His solution was that the Partial Credit Model recognises a partial-credit ratings scale as being specific to each item (Linacre, 2010).
loge(Pnij/Pni(j-1)) = Bn- Dij
The Partial Credit Model specifies the probability, Pnij, that person n of ability Bn is observed in category j of a rating scale specific to item i of difficulty Di as opposed to the probability Pni (j-l) of being observed in category (j-l) of a rating scale with categories j = 0. The rating scale structure (Fij) is now specific to item i. This means that partial credit items with the same number of categories and the same raw marginal scores, taken by the same people, can have different difficulties if the pattern of category usage differs between the items (Masters, 1982).
Rasch analyses provide a formal procedure to test scales against a mathematical formula for its construct validity. The results of the series of analyses guide the researcher in refining the scale to perfection.
This process of refining scale structure is referred to as scale calibration (Bond & Fox, 2007). If poor fit is achieved, poor measurement qualities are reported. However, the RMM will guide the analyst along a diagnostic pathway to identify under- and over-fitting characteristics in the scale and, if possible, provide the remedies to rectify and adjust the weaknesses in the scale structures to a point where the scale could optimally fit RMM. The degree of final fit to the RMM expectations indicates the level of confidence to which the scale can be used in future as a fundamental measure to produce measurements useful for adding and subtracting and performing parametric analysis (Bond & Fox, 2007).
1.3. Purpose of study
To calibrate and report on the BETA's internal construct validity using the RMM.
1.4. Research objectives
To investigate the BETA's internal construct validity using the RMM with specific reference to the BETA's potential to be used as an interval scale providing metric or interval data. Suitable methods had to be found whereby the BETA scores approximate ("fit") the RMM.
1.5. Definition of key concepts
1.5.1. Restorative nursing care
The process where the main nursing aim is to increase or maintain human functionality in a sub- or non-acute nursing environment (Loubser, 2012).
1.5.2. BETA®
The BETA® is the second in a series of five nursing measures on human functionality and is the intellectual property of the South African Database for Functional Measurements (SADFM). Licensed use is available provided the facility is trained, tested and credentialed in the correct application of the BETA.
1.5.3. Items of the BETA nursing measure
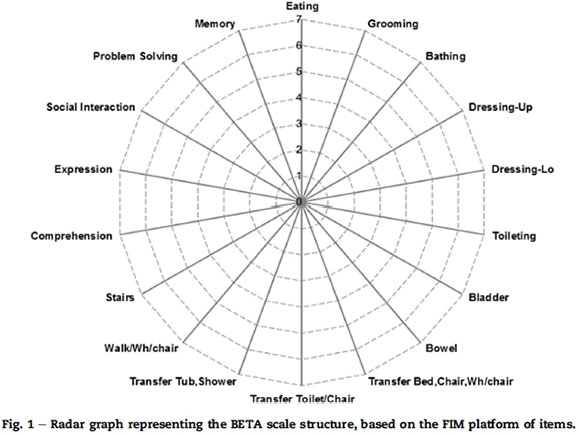
The BETA nursing measure has 18 items, 13 being motor and five being cognitive items (Fig. 1). The 18 items are based on the Functional Independent Measure (FIM®) platform of items, but the categories differ to suit the nursing sciences. Each item has seven categories (response options) based on the nursing logic and their universal language of how a patient requires nursing assistance during the restorative nursing process; e.g. 1 = patient does nothing, 2 = patient is trying, 3 = needs stay-with help, 4 = needs help with a specific task or occasional help, 5 = needs help outside definition, 6 = only needs something, 7 = OK.
Ordinal scales providing scores render qualitatively ordered data.
According to the seminal work of Stevens (1946), a precursor of measurement is firstly classification and, secondly, serration whereby arbitrary numbers are allocated according to a rule on the ordinal variation of the attribute to be investigated. An example is to score "the ability to bath" using a Likert scale such as 1 = no ability, 2 = mild ability, 3 = moderate ability, 4 = significant ability, and 5 = maximum ability. Although these scores have descriptive significance, they have no mathematical or inferential statistical value as they cannot be summed or subtracted. Serrated data is therefore qualitatively ordered and is not any form of measurement. The data is only compiled for pragmatic reasons.
Interval measures providing measurements render metric.
Stevens' (1946) third level of measurement is interval whereby there is an arbitrary unit of difference between two successive lengths that can be iterated along the measure of interest and will maintain its unit value along the whole measure. An example is centimetres that iterate into a metre or grams that iterate into a kilogram. These values have mathematical properties and can, for instance, be added, divided, summed and averaged. The challenge is to convert ordinal scales providing clinically pragmatic scores into interval measures that can provide significant measurements. If one can achieve this transformation one can achieve a clinical metric allowing inferential statistics. The Rasch mathematical model can analyse this possibility.
1.5.4. Raters
The raters included those categories of nurses and caregivers who were in a position to observe the patients while performing their activities of daily living. The raters were trained, tested and accredited in the application of the BETA to observe and score the abilities of the patients to perform their activities of daily living routinely.
1.6. Contribution to field of nursing
By converting a routinely used ordinal nursing scale into a validated interval nursing measure, one contributes to a valid calculation of patient outcomes with the use of change in a latent variable, such as activities of daily living.
1.7. Instrument for data analyses
The WINSTEP® Software version 3.70.1.1 (2010) was used to perform this analysis. A licence to utilise the software was procured through www.WINSTEPS.COM (Winsteps, 2010).
2. Research method
2.1. Design
A quantitative analytic design was followed whereby BETA raw scores were collected, data was prepared for RMM analyses, imported into the WINSTEP data files, calibration and analyses were done with WINSTEPS. The final results are shown by means of figures and graphs.
2.2. Data collection
Over a period of four years rehabilitation, convalescent care, home nursing and gerontological facilities were registered as data collecting sites (n = 28). The facilities entered into an agreement to use the BETA nursing measure; all the nursing staff were provided with a BETA training manual. They were trained, tested and accredited in the use of the BETA. This process was necessary to ensure reliability of data captured with the BETA. Credentialing certificates were issued when 80% or higher was achieved by the nursing staff, and data was collected from a facility when 80% of the nursing staff was accredited. Each facility was provided with access to an electronic database to capture the patient data.
All patients admitted into the facility were observed, scored and recorded within 48 h by the raters. This served as the admission score. From here onwards, scores were recorded daily as the raters observed the patients performing their activities of daily living. The scores were recorded on hard copy in the patient file as an integral part of the nursing process and care plan. The patients were unaware that they were being scored and their scores were recorded as an integral part of the routine nursing observations. Therefore, no consent was obtained from the patients. If different raters gave different scores during the day, it was agreed that the lowest observed score should be recorded as the patient's score of the day.
The daily scores were presented as the nursing report of the patient's progress at the weekly team meetings. The team then reviewed the interim progress of the patient as recorded by the raters. The discharge scores of the patients were similarly reviewed and recorded on the day of discharge. Each nursing team designed and developed their own nursing process documentation to record the BETA scores. An electronic, web-based application was provided to import the admission, weekly intermediate (actual score on every successive seventh day after admission) and discharge scores from the nursing documentation.
The Beta was used routinely on all adult patients (>18 years) admitted into the 28 facilities. All admission, weekly intermediate and discharge BETA scores were pooled, totalling 16,639 raw BETA scores representing 5356 patients over a period of four years.
2.3. Data preparation
Iramaneerat, Smith, and Smith (2008) advise scale developers and researchers to follow a diagnostic pathway when preparing data for the RMM. It is advisable to first consider the four basic scale requirements before valid inferences can be derived from the RMM. This includes local dependency, uni-dimensionality, monotonicity and invariance (Iramaneerat et al., 2008), which showed promising characteristics during the BETA's data preparation.
The next concern was dependency of data as the total raw scores contained admission, intermediate and discharge responses for most patients. Dependency of data exists when admission, intermediate and discharge scores of the same patient are used in a data set. This was controlled by using a computerised random sample done in Excel with the selection based on the frequency distribution of the total admission, intermediate and discharge observations. A random selection of 15% of the admission scores was selected; thereafter the same was done with the intermediate scores. As soon as the randomisation process selected a score that belonged to a person already included in the admission data, that score was ignored and the next one was selected. This process was repeated with the discharge scores. The final data set consisted of a spread across all the scores but ensuring that all scores belonged to different persons. Therefore the final dataset for analysis had raw score observations of 4235 persons representative of admission, interim and discharge scores that were free of data dependency.
The next step in the preparation of the data was to subject the resultant BETA raw score dataset, freed from dependency, to a preliminary panel of RMM diagnostic tests. The data included all 18 BETA items (see Fig. 1). The first test revealed disordering of categories across the first 13 motor items. The five cognitive items, however, provided better results than the 13 motor items. The motor and cognitive items were then grouped into a motor and cognitive subscale, and the analyses repeated. The five cognitive items showed marked improvement when analysed separately as a subscale; the 13 motor items also improved, but disordering still remained a problem in this subscale. This spontaneous improvement in the category ordering of the cognitive subscale function led the researcher to consider whether the 13-item motor scale could benefit from further subscale analysis. In considering re-calibration into subscales for meaningful routine nursing observation, the following factors were considered:
- A concern from the nurses that they were not able to observe some items (e.g. climbing stairs is a therapeutic not a nursing activity; new facilities do not have baths or showers to transfer patients into).
- The difference in rating scale structure between the items (e.g. counting frequencies, using Likert measures, using algorithms or using a combination such as walking/ wheelchair where distance and ability should be brought into consideration and which caused differences among nurses).
- The difficulty of nurses to routinely arrive at a score on certain items (e.g. counting frequencies in bowel and bladder accidents).
- The same observations for different items, where some observed activities seem to overlap with another (e.g. dressing lower body and pulling up and down pants during toileting) causing structural local dependency concerns.
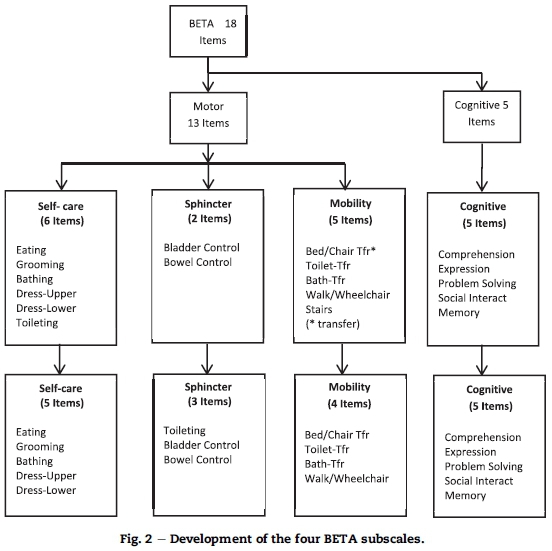
Considering the above nursing concerns plus the existing clinical knowledge and the Rasch reporting on category disordering, a decision was made to create a four-subscale structure for the BETA (see Fig. 2). The four Beta subscales are referred to as the self-care, toileting, mobility and cognitive subscales. From here onwards the four subscales were each calibrated separately. As Verhalst and Glass (1995) state, there are two methods that scale developers may use to enhance measurement construction, namely to omit "bad" items and/or temporarily remove the observations that clearly misfit the Rasch model. The main consideration for grouping and deleting items to create the four BETA sub-scales was to secure fit to both the nursing logic and the Rasch model.
The final step in the data preparation was to follow Linacre's (2010) recommendation that clinical observations with under-fitting responses over 1.7 MNSQlogits are usually associated with careless mistakes. He suggests these under-fitting data are too unpredictable for measurement development with the RMM and could be removed for calibration purposes. Therefore the under-fitting data (<1.7 MNSQlogits) were removed, leaving each subscale with its own data set free of under-fitting data.
3. Ethical considerations
This study was approved by the Human Research Ethics Committee (Medical) of the University of the Witwatersrand and an ethical clearance certificate with the number M10524 was obtained. Written approval from the clinical managers of the involved facilities was also obtained.
The researchers did not require anything from the patients, outside the normal routine of the nursing care plans and processes, therefore the rights of patients were not violated. No discomfort or harm, be it physical, emotional, spiritual, economic, social or legal was imposed.
As the research used scores from the nursing records, consent was not required from the patients in this regard. Confidentiality and anonymity was ensured by preventing any linkages of the research data which could reveal the identity of the participants (patients, nurses, or the facilities) included in this study. In the database all patient-identifying information was encrypted.
4. Results
4.1. Rasch calibration
Following the Verhalst and Glass (1995) directive, the calibration was started by omitting the items that malfunction according to the nursing logic and the Rasch model. This led to the following item adjustments to the four subscales (see Fig. 2):
- The toileting item was relocated to the sphincter subscale. This was done as some of the observed activities in dressing lower body and toileting are the same (e.g. pulling pants down and up, and loosening and fastening zips, buttons or belts whilst steadying) and in this instance, the Rasch model requirements of local dependency might be violated. By moving the toileting item to the sphincter control subscale, a nursing scale for measuring the complete toileting experience now becomes a routine scoring sequence.
- The stairs item was removed from the mobility subscale as it was evaluated not only to be a weak Rasch rating scale item (e.g. disordered categories), it also did not conform as a routine nursing measure (e.g. it is not considered part of the nursing care plan to take patients up and down stairs).
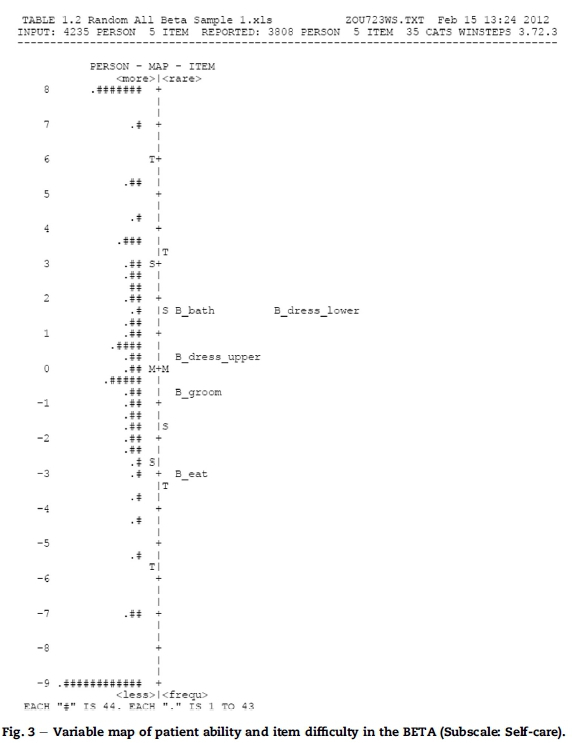
In Fig. 3 the RMM's "patient ability versus item difficulties map" illustrates how the BETA Self-care subscale succeeds to measure what it intends to measure. On the map it is evident that the Dress-Upper and Grooming items occupy the middle space, meaning the Rasch calculation places it closest to the mean difficulty estimate location, which is set at 0 logits. At this middle space (0 logits) it also means that a patient has approximately a 50% probability of succeeding on the Dress-Upper or Grooming items, with the patient having a slightly greater probability to succeed in Dress-Upper than in Grooming. With these basic principles evident from the item-person map, one can assume that the Self-care subscale might not be sensitive enough as the patient distribution shows significant clusters of scores above and below the scale distribution. These top and bottom score clusters represent a ceiling (too easy) and floor (too difficult) effect for the particular patient population. A ceiling or floor effect indicates the level above or below where the independent variable was no longer measured or estimated. However, for this particular population, clinical evidence and pragmatic reasons can be rendered, which will be discussed later.
4.2. Calibrating category function
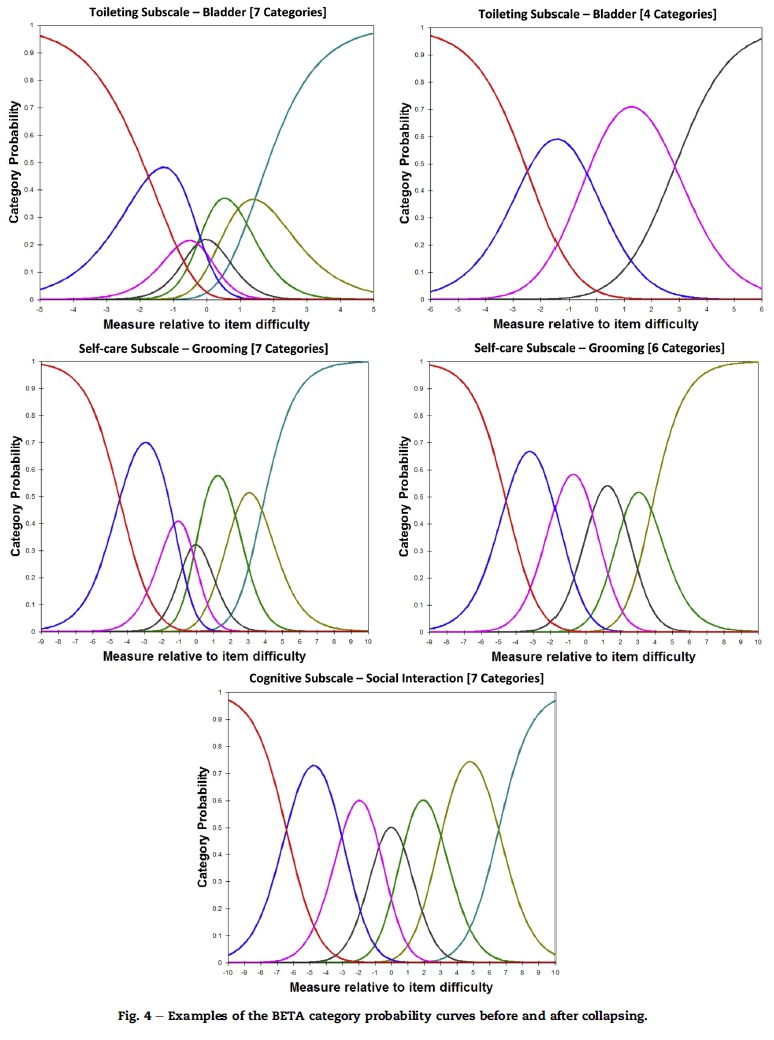
With each subscale and its allocated items in place, the focus was on calibrating the ordering of the categories of each item. Although the category observations showed a reasonable uniform distribution across all rating categories and the average measures advanced monotonically with the rating scale, the category probability curves in some items were submerged by others causing disordering, which obstructed meaningful calibration. This deficiency indicated that category collapsing was needed for some items in order to obtain an interpretable category structure. The guidelines of Linacre (2004) were followed in the process of combining adjacent categories. This, amongst others, was to check that the outfit mean squares do not exceed two logits, and threshold advances be at least 1.4 logits for a three-category scale or one logit for a five-category scale. In the final draft, the collapsed category structures also satisfied the category probability curves needed for having ordered intersections with neighbouring curves (see Fig. 4). The remedial collapsing of categories to create a well-functioning new item rating scale structure is summarised in Table 1.
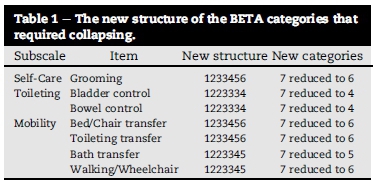
The "New structure" column in Table 1 should be interpreted as follows: The original structure for all items consisted of seven categories in the 1234567 order. If the Rasch analysis arrived at a conclusion that nurses could not distinguish satisfactorily between two neighbouring categories (say 2 and 3) and suggested that these two categories would function better as one category, then they were collapsed into one category. The new structure of the item would now read 1223456 meaning that categories 2 and 3 were collapsed to form category 2 thereby reducing the item's total category structure into six categories.
After the collapsing of items, only the mobility subscale's walking/wheelchair item reported an outfit MNSQ value of 3.41 logits which, according to the Linacre (2002) guidelines, was too high for meaningful measurement. However, during this calibration it was decided not to delete this item from the mobility subscale, but rather to recommend re-visiting the category definitions of the walking/wheelchair item. The nurses reported difficulty in arriving at a score when taking both distance and ability into consideration. This is clearly identified by the Rasch model and should be addressed at a later stage, but not in this study. All the other subscales showed reasonable to very good compliance with the Linacre guidelines for quality measurement properties.
4.3. Calibrating item function
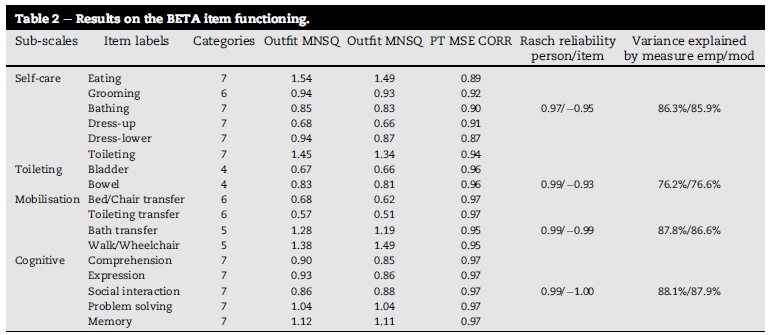
With the category functioning satisfying the Linacre (2004) guidelines, verification on the Rasch fit statistics parameters for item functioning was required. The Rasch model selected for reporting on the fit statistics for each subscale were the Infit and Outfit MNSQ values, the Point Measure Correlation (PT MSE CORR), Rasch reliability for person and item, and the variance experienced by measure (Table 2). These parameters are the most widely referred to and commonly used (Linacre, 2010).
Table 2 shows the subscales in the first column with corresponding items. The categories column is the number of categories per item after collapsing of categories that were disordered. This information corresponds to Table 1 which explains the new number of categories that needed to be collapsed.
The Infit and Outfit MNSQ values are the core statistics reporting on whether the scale fits the Rasch model or not. It also indicates how closely the scale appropriates the Rasch model. When values are around one logit, the measure is considered accurate. However, for clinical scales such as the BETA subscales, Linacre (2010) suggests Infit and Outfit MNSQ value ranges between 0.5 and 1.7 as reasonable for quality measurement. The Infit and Outfit MNSQ values in column 4 and 5 of Table 2 lie well within this range on all four subscales. It can be concluded that the item difficulty range is appropriate to the ability range of the persons being observed. Consequently, all four of the BETA subscales can be regarded as measures with good levels of accuracy and predictability.
The PT MSE CORR (Table 2, column 6) reported a noticeably positive correlation of all items well above 0.3. This indicates that all items are highly correlated with the overall measure. It also confirms that the distribution and direction from easy to difficult on each of the BETA subscales' latent variables are in alignment with the severity of the patients. The Rasch model expects the lowest category on the latent variable to be easier for severely disabled patients than the highest category.
The Rasch reliability for person and items quantifies the probability of a BETA subscale to reproduce the same relative location of the measurement point in future applications, given the same patients to observe. RMM reports on both person and item reliability, e.g. a "high person reliability" means that there is a high probability that persons estimated with high measurements actually do have higher measurements than persons estimated with low measurements. The same consideration applies to "high item reliability". All four of the BETA subscales obtained significant person reliability and item reliability values (Table 2, column 7). Three subscales are well into Fischer's (2007) range of "excellent" quality in item reliability and person reliability (>0.94). The toileting subscale falls into Fischer's "very good" classification with an item reliability value of 0.93.
The variance explained by the measure is the Rasch criterion for dimensionality and reports both empirical and modelled values (Table 2, last column). It must be interpreted as follows: if the data fits the Rasch model perfectly, and the raw variance explained on the empirical values is reported as 86.3%, then that number would have been 85.9%, which is reported as the modelled value. However, quality is not only interpreted by how close the empirical and modelled values are, but also by how high the percentages are. According to Fischer (2007), values higher than 80% and as close together as the reported values in the Self-care, Mobilisation and Cognitive subscales indicate "excellence" in quality in measurement properties. The toileting subscale values of 76.2%/76.6% again fall within Fischer's category of "very good" quality (Table 2, last column).
5. Discussion
The floor and ceiling effect revealed in Fig. 3 can be explained as follows: Firstly, the patient pool came from a wide diversity of impairments where one would expect a rapid regain to full independence in self-care (e.g. lower limb amputees, medically complex patients) and others who may never regain independence in self-care (e.g. quadriplegia, brain injuries). Secondly, a substantial number of patient scores represent admission scores into the rehabilitation facility when patients have very limited functional ability as a result of physical weakness. This explains a sizeable floor effect. The ceiling effect is explained with certain patients showing a rapid recovery to full independence on the self-care subscale, while still requiring mobilisation, cognitive or toileting rehabilitation care. The other Beta subscales provided the same level of evidence and are not discussed here due to space constraints.
An important finding is that the BETA nursing measure does not function as a single measuring unit with 18 items, but rather as a suite of four individual measuring units working in harmony to measure and explain four different dimensions of the activities ofdailyliving. In retrospect, these four subscales also make clinical nursing sense as the subscales are linked to the sequence of nursing activities performed by the same nurse at the same time. For example, the toileting subscale will record the nursing activity of undressing lower body, followed by the bladder and/or bowel sphincter control and cleaningatthe end as one activityobserved bythe same nurse at the same time. It will not be experienced as three different activities to be observed by three different nurses. In the case of the "stairs" item nurses agreed that it must be excluded from the BETA nursing measure as an item as it is not a nursing activity but rather an activity performed by physiotherapists.
Not only did the creation of the four subscales improve the fit to the Rasch model, it also gave nurses a tool to benchmark and monitor their nursing performance. There is a perceived value-adding to the nursing profession by using four individual subscales rather than one all-inclusive scale. With four subscales nursing staff might be better equipped and focused to implement and monitor new restorative nursing techniques in overcoming specific disabilities such as patients doing transfers independently. Although the four individual subscales should be analysed separately, their summed totals still reflect a total BETA on the patient's activities of daily living.
The structural changes of the BETA bring the researchers to a clinical/mathematical dilemma, which needs further consideration. Originally the BETA was designed by nurses as they experience the clinical restorative progression of patients on the pathway to relative independence. The nurses experienced intuitively seven clearly observable categories as stepping stones for each item. This meant that they provided the qualitatively ordered structure to collect the data. However, the RMM model evaluated that the nurses were correct in observing seven categories in some items (e.g. cognitive items) but in others they were only successful in observing four to six items with accuracy (see Table 1). The question now remains how to resolve the dilemma between qualitatively ordered data collection, which makes nursing sense and quantitatively ordered data that is metrically sound. The solution lies in providing a bridge from the qualitatively ordered nursing scores to the quantitatively metric measurements. The nurses will provide the raw scores according to the nursing logic of the BETA and once entered into the electronic data base the RMM software will transform the data into metric measure ments and provide it as a percentage. Thus raw scores as observed by the nurses will be used in the nursing process and care plans, but statistical analyses will use the Rasch converted metric interval data.
Traditionally, nursing management was based on an audit of the quality of the nursing care. The assumption was that good nursing observation and restorative care would result in good patient outcomes. The BETA supports that assumption. Nurses working in restorative care settings can now empirically establish how patients improve based on the effect of their nursing interventions and care plans. Collectively, these nursing data create not only a new dimension to nursing management, but also to the overall performance of the facility. For instance, a facility is able to provide evidence on how efficient nursing care is in improving or maintaining functionality in their patients. In the case of stroke patients they may report their efficiencies to be an average of 34.28% change in functional gain from admission to discharge over an average length of stay of 14.6 days. This information is valuable for nursing quality assurance as it reflects the quality of restorative nursing care rendered. The new nursing objective would be to manage these BETA gains up to higher levels over a shorter period of time. The BETA nursing measure thus gives a new perspective on quality nursing management.
6. Limitations of the study
As this is an initial Rasch analysis to verify if the BETA has potential to function as a valid nursing measure, further advanced Rash analyses need to be done over time to establish rater validity with the WINSTEP FACETS®.
7. Conclusion
With the establishment of the BETA's construct validity and the successful calibration of the ordinal scale into four sub-scales, nursing in restorative care settings has an empirical base in which to root its science. Nurses can in this way provide basic empirical evidence on the effectiveness oftheircare plans, techniques and interventions. Patient gains as calculated by the BETA could also be used to determine cost effectiveness of nursing care. Nursing management thus has access to validated patient-evidence-based methodology to benchmark and monitor the overall nursing performance. With valid BETA calculations, nurses can provide statistical evidence of the value they add to the multidisciplinary team efforts to restore the activities of daily living in patients.
Author's contribution
This article was based on the primary research conducted by HJ Loubser (Wits University) under supervision ofJC Bruce and D Casteleijn (Wits University) for the PhD thesis: "The validation ofnursing measures for patients with unpredictable outcomes". The draft was formulated by HJ Loubser and JC Bruce and D Casteleijn contributed to the finalisation of the article.
Acknowledgements
The authors would like to acknowledge the many nurses who participated voluntarily in the study and also their colleagues from the School of Therapeutic Sciences at the University of the Witwatersrand for their support as peer reviewers in the study.
REFERENCES
Bond, T., & Fox, C. (2007). Applying the Rasch model: Fundamental measures in the human sciences. Mahwah New York: Lawrence Erlbaum Associates. [ Links ]
Fischer, W. P., Jr. (2007). Rating scale instrument quality criteria. Rasch Measurement Transactions, 21(1), 1095. [ Links ]
Iramaneerat, C., Smith, E. V., & Smith, R. M. (2008) (Chapter four). In J. W. Osborne (Ed.), Best practices in quantitative methods. Thousand Oaks, California: SAGE Publishing. [ Links ]
Kottorp, A. (2003). Occupational based evaluation and intervention. Validity of the assessment of motor process skill when used with persons with mental retardation. Sweden: Umea University [ Links ]
Linacre, J. M. (2002). Optimising rating scale category effectiveness. Journal of Applied Measurement, 3(1), 85-106. [ Links ]
Linacre, M. (2004). Optimising rating scale category effectiveness. In E. V. Smith, Jr., & R. M. Smith (Eds.), Introduction to Rasch measurement: Theory, models, and applications (pp. 258-275). Maple Grove, MN: JAM Press. [ Links ]
Linacre, M. (2010). Practical Rasch measurement - Topics course. Retrieved from http://www.statistics.com. how coursework (copies in custody of researcher). [ Links ]
Loubser, H. J. (2012). The validation ofnursing measures for patients with unpredictable outcomes (PhD thesis). Johannesburg, South Africa: Department of Nursing Sciences, University of Witwatersrand. [ Links ]
Loubser, H. J., Bruce, J. C., & Casteleijn, D. (2013). The BETA nursing measure: Its development and testing for nursing utility. Art. #697 Health SA Gesondheid, 18(1), 9. Retrieved from http://dx.doi.org/10.4102/hsag.v18i1.697. [ Links ]
Masters, G. N. (1982). A Rasch model for partial credit scoring. Psychometrika, 47, 147-174. [ Links ]
Rasch, G. (1960). Probabilistic models for some intelligence and attainment tests. Copenhagen: Denmark's Paedagogiske Institut. [ Links ]
Stevens, S. S. (1946). On the theory of scales and measurements. Science, 103, 677-680. [ Links ]
Tennant, A., & Conaghan, P. (2007). The Rasch measurement model in rheumatology: what is it and why use it? When should it be applied, and what should one look for in a Rasch paper. Arthritis and Rheumatism, 57(8), 1358-1362. [ Links ]
Verhalst, N. D., & Glass, C. A. (1995). One parameter logistic model. In G. H. Fischer, & I. W. Molenaar (Eds.), Rasch models: Foundations, resent developments and applications (pp. 215-237). New York: Springer. [ Links ]
WINSTEPS®, 2010WINSTEPS®, (2010). SWREG Inc Order Number U795629501. Retrieved from https://usd.swreg.org/cgi-bin/r.cgi?o=795629501 (Processed 5 February 2010). [ Links ]
Received 21 February 2015
Accepted 26 February 2015
Available online xxx
* Research significance: The BETA nursing scale was developed to provide ordinal scores on patients' activities of daily living in a restorative nursing context. In this study the BETA's construct validity is tested to confirm the extent to which the BETA can function as a standardised measure. If successful, routine BETA measurements can be used in valuable empirical calculations such as change in activities of daily living during nursing care, nursing performance and efficiencies of service delivery.
** Corresponding author. Box 2356, Houghton, 2041, Johannesburg, South Africa. Tel.: +27 82 574 5129 (mobile). E-mail addresses: hennie@sadfm.co.za (H.J. Loubser), Daleen.casteleijn@wits.ac.za (D. Casteleijn), Judith.bruce@wits.ac.za (J.C. Bruce).
17 York Road, Parktown, 2193, Johannesburg, South Africa. Tel.: +27 21 717 3701
27 York Road, Parktown, 2193, Johannesburg, South Africa. Tel.: +27 21 717 2063

