


Services on Demand
Article
 English (pdf)
 Article in xml format
 Article references
Indicators

Related links
-
 Cited by Google
 -
 Similars in Google
Share

 Permalink
African Journal of Primary Health Care & Family Medicine
On-line version ISSN 2071-2936
Print version ISSN 2071-2928
Afr. j. prim. health care fam. med. (Online) vol.8 n.1 Cape Town 2016
http://dx.doi.org/10.4102/phcfm.v8i1.913
ORIGINAL RESEARCH
Non-communicable disease risk factors and treatment preference of obese patients in Cape Town
Kathryn Manning; Marjanne Senekal; Janetta Harbron
Division of Human Nutrition, Department of Human Biology, Faculty of Health Sciences, University of Cape Town, South Africa
ABSTRACT
BACKGROUND: Insights into the characteristics of treatment seekers for lifestyle changes and treatment preferences are necessary for intervention planning.
AIM: To compile a profile of treatment-seeking obese patients with non-communicable diseases (NCDs) or NCD risk factors and to compare patients who choose group-based (facility-based therapeutic group [FBTG]) versus usual care (individual consultations) treatment.
SETTING: A primary healthcare facility in Cape Town, South Africa.
METHODS: One hundred and ninety-three patients were recruited in this cross-sectional study. Ninety six chose FBTG while 97 chose usual care. A questionnaire, the hospital database and patients' folders were used to collect data. Weight, height and waist circumference were measured. STATA 11.0 was used for descriptive statistics and to compare the two groups.
RESULTS: The subjects' mean age was 50.4 years, 78% were women and of low education levels and income, and 41.5% had type 2 diabetes, 83.4% hypertension and 69.5% high cholesterol. Mean (s.d.) HbA1c was 9.1 (2.0)%, systolic BP 145.6 (21.0) mmHg, diastolic BP 84.5 (12.0) mmHg, cholesterol 5.4 (1.2) mmol/L), body mass indicator (BMI) 39.3 (7.3) kg/m2 and waist circumference 117 (12.6) cm). These figures were undesirable although pharmacological treatment for diabetes and hypertension was in place. Only 14% were physically active, while TV viewing was > 2h/day. Mean daily intake of fruit and vegetables (2.2 portions/day) was low while added sugar (5 teaspoons) and sugar-sweetened beverages (1.3 glasses) were high. Usual care patients had a higher smoking prevalence, HbA1c, number of NCD risk factors and refined carbohydrate intake, and a lower fruit and vegetable intake.
CONCLUSION: Treatment seekers were typically middle-aged, low income women with various modifiable and intermediate risk factors for NCDs. Patients choosing usual care could have more NCD risks.
Background
Non-communicable diseases (NCDs) such as type 2 diabetes mellitus (DM) and cardiovascular disease (CVD) are among the leading causes of premature morbidity and mortality in developed1 countries and developing countries such as South Africa.2,3 Within South Africa, it is predicted that the HIV epidemic, which is currently ranked as the leading cause of premature death in the country, may be surpassed by NCDs over the next few decades.4 This trend may negatively affect the economic development of the country as the burden from NCDs and obesity is set to immobilise a large proportion of the working-age population.3,4
The causes of NCDs are multifactorial; these diseases may arise from any combination of underlying, modifiable, non-modifiable and intermediate risk factors. Research indicates that socio-economic, cultural, political and environmental determinants, including population aging, globalisation, urbanisation and the accompanied nutrition transition contribute to the increase in NCDs in developing countries.3,5,6,7 The presence of NCDs and numerous risk factors have been found to be higher in population groups with low income and low educational attainment in both low-middle income and high-income countries.5,8 It has also been reported that individuals living in urban environments in South Africa have a high prevalence of modifiable or behavioural risk factors such as an unhealthy diet, physical inactivity, smoking and excessive alcohol intake.3,6,9 These modifiable risk factors, together with the presence of non-modifiable risk factors such as age, genetic predisposition, gender and race, result in the development over time of intermediate risk factors such as obesity, high blood pressure, high blood glucose and cholesterol.10 The increasing prevalence of obesity worldwide and in South Africa is of particular concern as it exacerbates the other intermediate risk factors and NCDs, resulting in a greater risk for disability and mortality.11 The 2003 South African Demographic and Health Survey12 reported that 27.4% of women and 8.8% of men aged 15 years and older were obese, which increased to 39.2% of women and 10.6% of men as reported in the 2012 South African National Health and Nutrition Examination Survey (SANHANES).9
Both international and national policymakers have called for urgent prioritisation of the prevention and management of NCDs.3,13,14 Levitt et al.4 suggested that the considerable attention and robust interventions implemented to manage the HIV and AIDS epidemic in South Africa should be applied similarly to NCDs. The restructuring of primary health care (PHC) and district health services in areas of the country such as Cape Town in Western Cape Province to improve standards of care, accommodate the growing population and manage escalating disease burdens15 is a step in the right direction. The substantial improvements in NCD surveillance,3,9 medication distribution16 and policy development17 in the country are also encouraging. However, according to Parker et al.,18 health promotion, behavioural counseling services and continuity of care in PHC facilities for patients with obesity and NCDs are probably insufficient to address the mentioned lifestyle risk factors. In an attempt to improve this situation, the Western Cape Provincial Department of Health (DoH) developed a NCD management policy that included a six-week, group-based intervention for roll-out at governmental PHC facilities to address modifiable risk factors through behaviour change and treatment adherence.19 At the point of roll-out, no research had been done on the socio-demographic, lifestyle and health profiles of patients seeking treatment at these facilities or the potential efficacy. Interestingly, there seems to be a paucity of research on the effectiveness/efficacy of group-based lifestyle interventions in the international literature.20 The same is true for research on the characteristics of those who would choose to enroll in such interventions.20 Work by Steinsbek et al.21 and Galagher et al.22 showed that there was little difference between baseline characteristics of participants in group versus standard treatment modalities. However, current literature suggests that patients' preference for a treatment type for obesity or NCDs in general may be influenced by factors such as age, gender, cultural perceptions, health status, access to quality healthcare and practical difficulties.23,24,25 Insights into the characteristics of treatment seekers regarding lifestyle changes and treatment preference are necessary for intervention planning.
The aims of the present research were to compile a socio-demographic, health, lifestyle and stage of change profile of treatment-seeking obese patients with NCDs or risk factors for NCDs attending a district PHC hospital in Cape Town, and to compare these characteristics between patients who chose the group-based programme and patients who chose the usual care option.
Methods
Study design
The present paper provides secondary analysis of cross-sectional baseline data of a 6-month lifestyle intervention study where patients could choose to participate in either a 6-week facility-based therapeutic group (FBTG) programme or the usual care option available at a government district PHC hospital in Cape Town, South Africa.
The FBTG intervention comprised six weekly sessions (60 to 90 minutes per week) facilitated by a multi-disciplinary team consisting of a dietitian, medical doctor, pharmacist, physiotherapist and nurse. Education on goal setting, healthy eating, physical activity, behaviour change, adherence to medication and treatment recommendations as well as advice on weight and behaviour maintenance were provided during the six sessions. Six to twelve patients were recruited per FBTG. The usual care group received standard treatment provided to a patient with NCDs and/or risk factors for NCDs at the district PHC hospital. This involves initial one-on-one consultations with the medical doctor and dietitian. Patient-initiated follow-up appointments with the dietitian were possible, pending the availability of the dietitian.
Study population, setting and sampling strategy
The study population were obese patients attending False Bay Hospital who required management of NCDs or risk factors for NCDs. False Bay Hospital provides medical care for patients without medical health insurance. However, a small minority of patients who have private medical aid are also treated at False Bay Hospital. Patients attending this hospital feed in from suburbs containing formal and informal housing.
Eligible patients were identified by the medical doctors employed by the hospital during routine appointments and were subsequently referred to the hospital dietitian for an individual consultation and possible recruitment. Eligible patients had to be older than 18 years and have a body mass index (BMI) ≥ 30 kg/m2, with one or more intermediate risk factor(s) such as raised blood pressure (BP) (> 130/80 mmHg), raised HbA1c (> 7%), raised total cholesterol (> 4.5 mmol/L), or one or more existing NCDs such as type 2 DM or CVD. The doctors made their decision to refer eligible patients to the hospital dietitian based on the most recent biochemical and clinical measures. A basic understanding of the English language was also necessary as both interventions were conducted in English. Patients were excluded if they were pregnant or lactating, or had any form of organ failure, severe psychiatric disorder or physical restrictions. A description of the FBTG intervention was provided during the recruitment consultation with the dietitian, after which eligible patients were given the option to choose the FBTG or the usual care intervention.
The sample size for the cross-sectional arm of the study was based on the sample estimation for the intervention arm. These calculations indicated that 44 to 60 participants would be required in each treatment choice group to achieve 80% power at a 5% significance level. Relevant published results of group-based lifestyle (weight loss) interventions were used for the calculations.26,27 As attrition rates in weight loss interventions have been reported to be high (between 10 and 80%),28 we recruited a sample including 96 intervention patients and 97 usual care patients, resulting in a total sample of 193 for the development of a profile of patients seeking treatment at the hospital.
Data collection
Relevant information was obtained using an interviewer-administered questionnaire developed for the purpose of the study, the CLINICOM hospital database and patient folders. During the initial recruitment consultation, the hospital dietitian interviewed the patient to complete the questionnaire and conducted the necessary anthropometric measurements. All biochemical and clinical measures were obtained on the day of recruitment.
Socio-demographic information
Socio-demographic characteristics transferred directly from CLINICOM to the data spreadsheet included information on race (coloured, black, white and Asian), gender (male and female), date of birth, family income and residential address of patients. Family income per month was classified using the Western Cape provincial categories, namely H0 for R0.00 and/or government pension, H1 for > R0.00 to R4166.66, H2 for R4166.67 to R8333.33, H3 for > R8333.34, and P for private medical aid. Information collected using the interviewer-administered questionnaire included employment status, number of years of formal education (completed years of schooling, diplomas and certificates) and reason for declining the 6-week FBTG intervention (only asked of patients who chose the usual care option). All patients were also asked to indicate their 6-month weight loss goal.
Physical activity assessment
For the physical activity assessment, patients were asked whether or not they participated in formal and/or informal exercise and to specify the exercise type. The frequency of exercise sessions was recorded as the number of times each exercise type was performed per day, per week or per month. The typical duration for each session was recorded in minutes. To calculate the minutes of physical activity performed per week, the number of times the patient exercised was multiplied by seven if daily, divided by one if weekly, and by four if monthly. The subsequent value was multiplied by the indicated duration. If a patient participated in more than one type of exercise, the weekly minutes per week of each exercise were summed. The number of minutes per day spent watching television was recorded and used as a reflection of leisure time sedentary activity.
Dietary intake assessment
The focus of the dietary assessment was on determining the number of standard portions consumed per day from indicator food groups. For these purposes, a semi-quantified food frequency questionnaire (FFQ) consisting of 54 food items was developed, from which 10 indicator food groups were derived (Table 1). The indicator food list developed by Seme29 for the assessment of the healthfulness of food choices in educators from low socio-economic areas in the Western Cape was adapted for the purposes of the present research by an expert panel of dietitians. The rigorous process followed by Seme29 in the development of the food list and the further consideration thereof by the expert panel for application in this study contributed to construct, content and face validity.
The frequency of intake of a standard portion of each food item was recorded as the number of times the food was consumed per day, per week or per month. For quantification purposes, a standard portion size was allocated to each food item and alcoholic or non-alcoholic drinks (Table 1) using the UCT exchange lists and the food-based dietary guidelines for South Africa.30 The plate model was used to illustrate standard portion sizes to patients. The number of standard portions consumed per day for each food item was calculated by dividing the number of times the patient consumed the standard portion by one if consumed daily, by seven if consumed weekly, and by 28 if consumed monthly. These values were summed for food items contributing to a particular indicator food group to calculate the daily number of standard portions consumed from each of the 10 indicator food groups. Patients were also asked how many formal meals and snacks they consumed daily.
Anthropometric measurements
Anthropometric measurements were conducted according to the World Health Organization (WHO) guidelines.14 Weight and height was measured in light clothing and without shoes, using a calibrated scale and stadiometer respectively. BMI was calculated as weight in kilograms (kg) divided by height in metres (m) squared and categorised according to the WHO classification,31 namely 30 kg/m2 - 34.9 kg/m2 as obese class I, 35 kg/m2 - 39.9 kg/m2 as obese class II, and > 40 kg/m2 as obese class III or morbidly obese. Waist circumference was measured midway between the last palpable rib and the top of the hip-bone after normal expiration using a non-stretchable tape measure.14 Waist circumference was classified as reflecting increased risk for the development of metabolic syndrome and NCDs if > 102 cm in men and > 88 cm in women.32
Biochemical and clinical measures, NCD status, medication usage and smoking
Fasting blood samples and BP measurements were collected by nursing staff. The blood samples were analysed by the National Health Laboratory Service (NHLS) for glycated haemoglobin (HbA1c) and total cholesterol. HbA1c was only analysed in patients with type 2 DM. An automated sphygmomanometer was used to measure the BP of each patient when in a seated position with the cuff above the elbow. The diagnosis of hypercholesterolaemia and high BP was confirmed by the medical doctors using the International Classification of Disease codes (ICD-10). Missing values were issued for patients who did not attend their scheduled appointment for biochemical and clinical assessments.
The diagnosis of DM and CVD (specifically ischaemic heart disease, heart failure and peripheral vascular disease) was recorded by the medical doctor in the patient's folder using the ICD-10 codes. Medication usage was recorded from the medication prescription chart in the patient's folder. Current smoking status (yes or no and number of cigarettes per day) was determined to calculate the number of 'pack years' i.e. the number of years an individual had smoked one packet of cigarettes per day.33
NCD risk factor profile
The risk factor profile calculations described by Van Zyl et al.6 were adapted to describe the risk factor profile (total number of risk factors present) in our sample. For these purposes, a score of one was allocated to each of the following: high BP, high cholesterol, current smoking, physical activity < 150 minutes per week,34 leisure time sedentary activity > 120 minutes per day,35 and fruit and vegetable intake < 5 portions per day.36 A minimum of zero indicated no risk factors present while a maximum of six could be obtained if all risk factors were present.
Readiness to increase intake of healthy foods
An adapted version of the 12-item Readiness for Change questionnaire (RCQ)37 was used to determine patient readiness to increase their intake of healthy foods. The original RCQ was developed to determine the stage of change in individuals with excessive alcohol intake.37 This was adapted by Senekal et al. (unpublished) for research on the readiness of members of a South African medical scheme to consume healthy foods. The adapted RCQ aimed to categorise patients in a pre-contemplation (PC), contemplation (C) or action stage (A). The adapted questionnaire consists of the following nine statements, with three relating to each stage of change category:
'I do not worry about what I eat.' (PC)
'I am trying to eat more healthy foods than I used to.' (A)
'I enjoy eating unhealthy foods, but eat too much of them at times.' (C)
'Eating more healthy foods would be pointless for me.' (PC)
'I recently started to eat more healthy foods.' (A)
'My intake of unhealthy foods is a problem sometimes.' (C)
'There is no need to think about changing what I eat.' (PC)
'Sometimes I think that I should eat more healthy foods.' (C)
'Anyone can talk about wanting to eat more healthy foods, but I am actually doing something about it.' (A).
The response categories and scoring were based on the scoring system used by Rollnick et al.,37 with a score of -2 allocated to 'Strongly disagree', -1 to 'Disagree', 0 to 'Unsure', +1 to 'Agree', and +2 to 'Strongly agree'. These scores were summed, with the total score for each stage potentially ranging from -6 to +6. The highest of the three scores reflects the patient's stage of change. In the event of the scores for two of the three categories being equal, the patient would be classified as being in the higher stage of the two stages.38
Data analysis
Data were entered into a Microsoft Excel (2007) spreadsheet and cleaned prior to analysis in STATA 11.0 (Statacorp Lp, 2009). Numerical variables were checked for normality by exploratory analysis using box and whisker plots and the Shapiro-Wilk test.
Descriptive analyses included calculation of frequencies for categorical data, as well as means (standard deviation) for numerical data. Independent t-tests (normal data) and rank-sum tests (non-normal data) were used to compare numerical variables between those who chose the FBTG intervention versus those who chose usual care (referred to as treatment choice groups in the results and discussion). Pearson chi-squared or Fisher's exact tests (if expected frequencies were < 5) were used to compare categorical variables between the two treatment choice groups. All results with a p-value < 0.05 were described as statistically significant.
Ethical considerations
Permission to conduct the research was obtained from the South African DoH and the medical superintendent of the healthcare facility (False Bay Hospital). Ethical approval was granted by the University of Cape Town' (UCT) Faculty of Health Science's Human Research Ethics Committee (Ref: 118/2010). Written informed consent was obtained from each patient.
Results
Socio-demographic characteristics
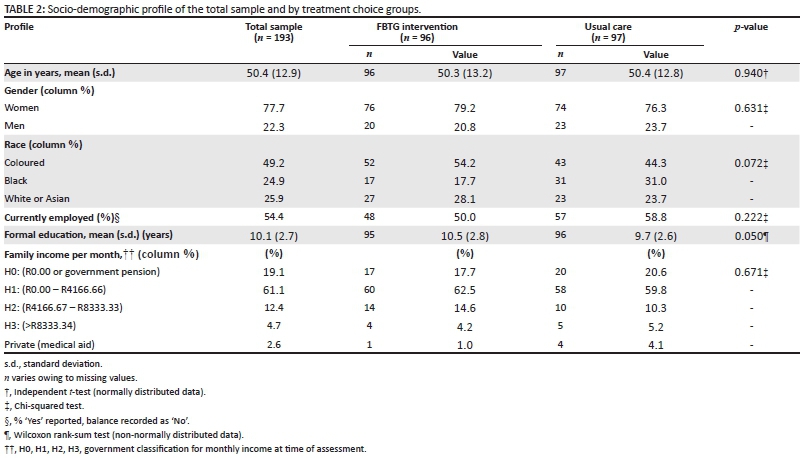
The majority of patients who entered the study were women and of the coloured race (Table 2). The patients were on average 50 years old and had a formal education of 10 years. Most patients indicated that they received a family income between R0.00 and R4166.66, and just over half of the total sample was employed at the time of assessment. There were no significant differences between treatment choice groups for any of these variables (Table 2).
The reasons indicated by usual care choice patients for declining entrance into the FBTG intervention included work commitments (n = 37; 38.1%), preference for individual consultations (n = 14; 14.4%), transport problems (n = 9; 9.3%), family commitments (n = 5, 5.2%), medical problems (n = 2; 2.1%), demotivation (n = 1; 1.0%), out of area (n = 1; 1.0%) and time limitations (n=1; 1.0%). Twenty-seven (27.8%) patients gave no reason for declining the FBTG intervention.
NCD status, biochemical values, medication usage and smoking
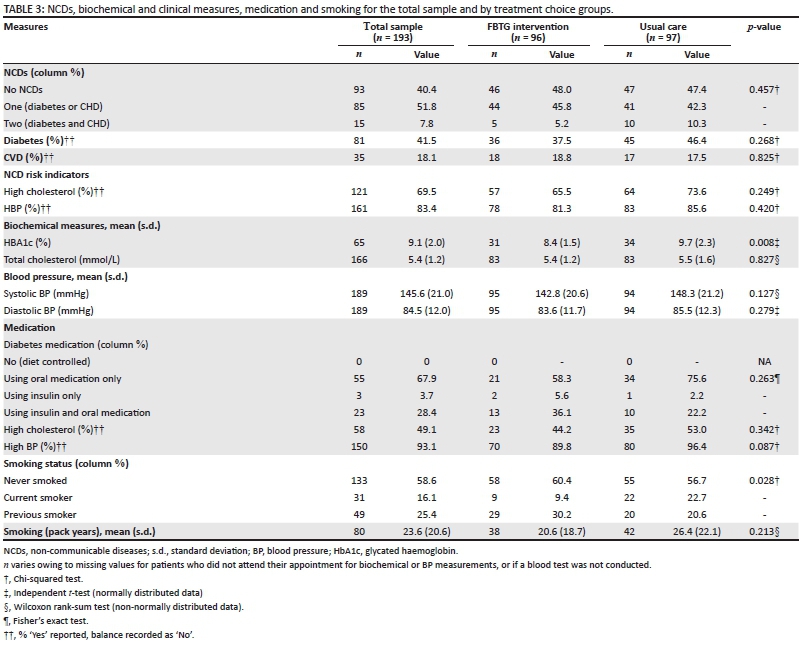
One in 2 patients had one NCD, while approximately 1 in 10 had both DM and CVD (Table 3). Overall, DM was more prevalent than CVD. The majority of patients presented with high BP and high cholesterol. There were no significant differences between the treatment choice groups for these variables (Table 3).
The mean HbA1c for all patients with DM was in the poor glycaemic control range,39 and the mean total cholesterol, SBP and DBP values were in the high range (Table 3).40 Usual care choice patients had significantly poorer glycaemic control than FBTG intervention choice patients. Total cholesterol and BP did not differ significantly between the two treatment choice groups (Table 3).
The majority of patients with DM were using oral hypoglycaemics, with very few of these patients using insulin therapy alone (Table 3). Almost half of the patients with high cholesterol and most of the patients with high BP were taking cholesterol-lowering and anti-hypertensive medication respectively. There were no significant differences in medication usage between the two treatment choice groups. The majority of the sample had never smoked, while about 1 in 6 patients were smoking at the time of assessments. The usual care choice group was significantly more likely to be current smokers. The number of pack years for the total sample was close to 25 years and did not differ between the two treatment choice groups (Table 3).
Anthropometry
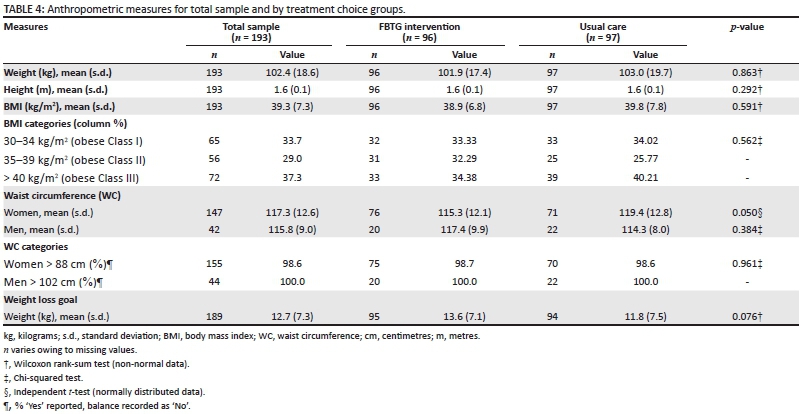
Results for weight status and other anthropometric measurements are presented in Table 4. The mean BMI of the total sample was in the obese class II range.31 Both men and women presented with a mean waist circumference above the recommended cut-offs of > 102 cm and > 88 cm respectively.32Furthermore, the waist circumference of the majority of men and women was greater than the recommended cut-offs. The mean 6-month weight loss goal for the total group was approximately 13 kg. There were no significant differences between the two treatment choice groups for any of these variables (Table 4).
Physical activity
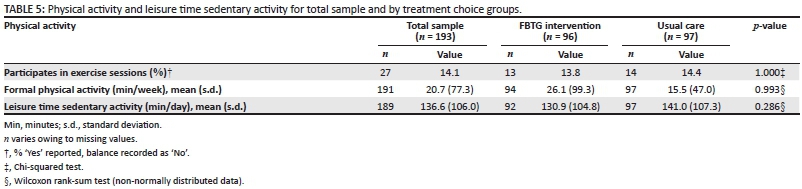
Approximately 1 in 7 patients in the total sample engaged in exercise sessions, with the mean time spent on this being less than half-an-hour per week (Table 5). Time spent watching television amounted to more than 2 hours per day. There were no differences between the two treatment choice groups for these measures (Table 5).
Dietary intake
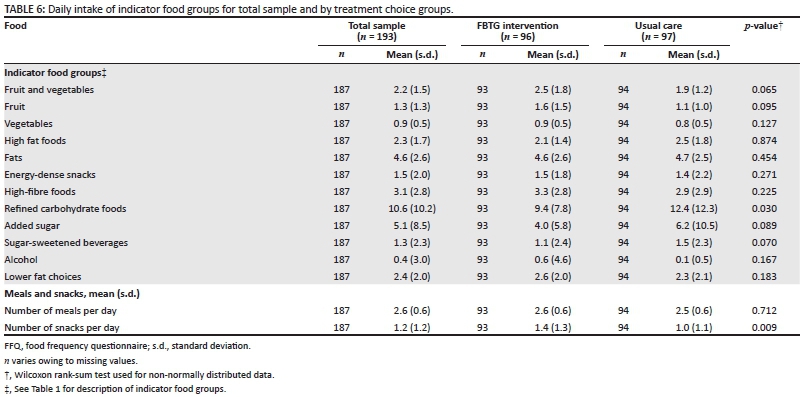
The number of standard portions consumed per day from each of the indicator food groups is presented in Table 6. Data for the total sample show that the intake of fats, high fat foods and energy-dense snacks combined was 8.4 standard portions per day. Approximately five teaspoons of added sugar, more than a glass of sugar-sweetened beverage, and approximately 10 standard refined carbohydrate portions were consumed per day. Only three standard high-fibre food portions, 2 standard fruit and vegetable portions (combined) and less than three standard portions of lower fat choices were consumed per day. Alcohol intake was close to half a unit per day in the total sample. Usual care choice patients ate significantly more refined carbohydrates than FBTG intervention choice patients. There were no differences between the two groups for the other dietary intake variables (Table 6).
Results indicated that meals were consumed 2.6 times a day while only one snack was consumed between meals on a daily basis (Table 6). Usual care choice patients ate significantly less snacks than FBTG intervention choice patients (Table 6).
NCD risk factor profile
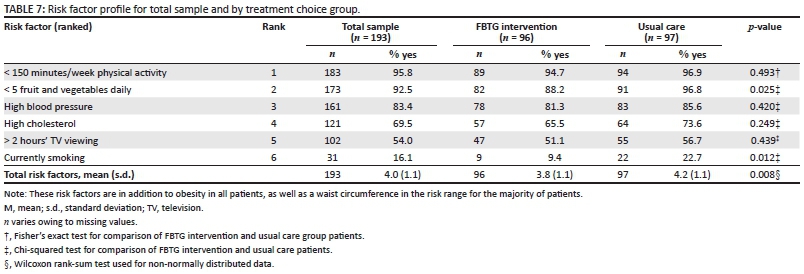
The mean number of NCD risk factors present in the total group was four out of a maximum of 6 (Table 7). Usual care choice patients had a significantly higher number of risk factors than FBTG intervention choice patients had. The three highest ranked risk factors in the total group and the two treatment choice groups were inadequate physical activity levels, inadequate fruit and vegetable intake, and high blood pressure. Fruit and vegetable intake below the cut-off and, as mentioned, current smoking, were significantly more likely to be present among usual care choice patients (Table 7).
Readiness to increase intake of healthy foods
The majority of patients (n = 130; 68.8%) were in the contemplative stage of change at the time of the study, with 1.6% (n = 3) being in the pre-contemplative stage and 29.6% (n = 56) in the action stage. There were no significant differences between the two treatment choice groups (Fisher's exact test p-value = 0.326).
Discussion
Information on the profile of patients seeking treatment for NCDs in PHC settings, as well as characteristics of those who would be willing to enter a group-based intervention such as the Western Cape DoH's FBTG, is scarce. This may in part be owing to the complexity of psychosocial, biological, ethnic and environmental influences on health-related perceptions, treatment-seeking behaviour and decision making.23,29,41 The results of our research provide important insights into this research question.
The majority of our sample was women, despite the fact that men in the study area may also be likely to be at risk for obesity and NCDs. This finding is not uncommon in lifestyle intervention studies and it has been suggested that women seek treatment for obesity and general health problems more often than men do.25,42,43 This suggestion is supported by the findings of a recent study in North-West Province in South Africa, namely that men did not actively participate in healthcare-seeking behaviour and wellbeing when compared with women.25 Evidence from developed countries shows that men appear to prefer individualised treatment for health problems and a physical activity focus, over group-based weight loss programmes.42,44 Our results indicate that the situation may be different in PHC settings in developing countries, with men being equally likely to choose group-based or usual care interventions as women. However, this trend would need to be confirmed by further research in PHC settings.
Although there were no differences in representation of races between treatment groups in our study, black participants were in the minority in both groups, which does not represent the demographics of the patients in the catchment area for the hospital. It has been reported that willingness to participate in weight loss interventions may be influenced by culture-related factors.45,46 These studies showed that recruitment rates of black participants into health research and lifestyle programmes were generally low. A number of studies have shown that black South African women may perceive adiposity as a reflection of good health and wealth, while weight loss may be perceived as an indication of illness, especially regarding HIV or AIDS and poverty.46,47 Therefore, cultural acceptance of a larger body size may thus contribute to low motivation to lose weight and thus low recruitment rates of black women into weight loss programmes. It can further be speculated that the perception among African-American women that weight loss and lifestyle programmes are not tailored to their personal challenges and cultural preferences45,48may also be true for black women attending the district PHC hospital in our study.
The mean of 10 years of education indicates that our sample (patients attending a PHC facility) on average have not completed secondary level education (12 years of schooling), with no difference between treatment choice groups. The low education level of the total sample may thus affect treatment outcomes and level of engagement in both treatment choice groups. Shankar et al.49 state that exposure to education over an individual's life course is likely to affect the individual's response to health problems in adult life. Low education attainment has been shown to be associated with reduced treatment-seeking behaviour,50 low desire to change, lower levels of health literacy,48 and poorer risk perception and external locus of control51 which could negatively affect treatment outcomes such as weight loss or adoption of a healthy eating pattern.
The total sample had an average household income of up to R4167.00 per month, with an annual income of up to R50 004.00, which is considerably less than the average annual income of R78 157.00 to R14 3460.00 in Western Cape Province, as reported in the 2011 Census.52 Although it has been suggested by the hospital administration that some patients under-report their income in order to qualify for lower hospital rates, the low income was expected as the catchment area for the hospital includes mainly low socio-economic households, education levels were low, and only half of the total sample were employed. It is plausible that low income may reduce treatment-seeking behaviour in general and, if treatment is sought, to opt for a less costly option. The perceived and actual higher cost of healthy eating53 may also be a barrier to enrolment in a lifestyle intervention for either treatment group. It is interesting to note that, despite the fact that there was no difference between treatment choice groups for employment status, usual care patients cited work commitments as the main reason for declining the FBTG intervention. It is plausible that unemployed or part-time employed individuals would be more likely to attend a regular FBTG programme or individual dietetic consultations (usual care choice) than employed individuals. However, financial constraints associated with unemployment may preclude them from doing so.
DM was more prevalent in our sample than CVD, with the elevated HbA1c in those with DM, especially patients in the usual care choice group, reflecting poor long-term blood glucose control. High BP and high cholesterol were present in the majority of the sample. Better control of blood glucose and hypertension was expected as pharmacological treatment for the management of these indicators seemed to be in place. However, only half of those with high cholesterol were on statins, possibly because doctors in this PHC hospital applied risk stratification in patient management that involves an initial focus on lifestyle change for patients who have high cholesterol levels, but are not at high risk for CVD. Factors such as poor compliance with treatment, age, weight status, unhealthy diet and physical inactivity might have contributed to the poor control of blood glucose, BP and cholesterol. Furthermore, NCD risk may be increased in the 16% current and 25% past smokers (= 41% ever smokers) in the total group. The Western Cape population is known to have the highest smoking prevalence in South Africa, with 38.5% being ever smokers, which is in line with our results but much lower than the national prevalence of 20.8%.9 Patients in the usual care choice group were significantly more likely to be current smokers, and may therefore be at higher risk for NCDs.
Although a BMI in the obese range was expected, it is very concerning that over a third (37.3%) of patients recruited into the study were morbidly obese (BMI > 40 kg/m2). Weight loss should clearly be a major priority in the treatment and management of these patients. The estimated mean 6-month weight loss goal of 12.7 kg for the total group (not significantly different between the two treatment choice groups) equates to approximately 0.5 kg per week and is in line with the general recommendation for weight loss of 0.5 kg to 1 kg per week.54 If this rate of weight loss is attained, a weight loss of 12.4% can be expected if the initial mean weight of 102.4 kg for the total group is considered. Modest but sustained weight loss of 10% of initial weight may result in substantial improvements in glycaemic control, BP and lipid profiles, if maintained.55,56 Weight loss may also contribute to a reduction in waist circumference, which was in the undesirable range for almost all patients in the study sample, that will contribute to further NCD risk reduction and improved management for those with DM and/or CVD as central adiposity is known to exacerbate insulin resistance, dyslipidaemia and hyperglycaemia.32 As there were no differences in anthropometric measures between the treatment choice groups, it is possible that weight status did not influence treatment choice in our study sample.
The need for individualised treatment appears to be an important consideration for patients seeking treatment for obesity.18 This may explain why the preference for individual consultations was the second reason most cited by patients in the usual care choice group after work commitments for declining participation in the FBTG intervention. This finding is supported by Parker et al.18 who found that the majority of patients interviewed in PHC facilities in Western Cape Province opted for individual counselling as their ideal delivery method for therapeutic nutrition education. On the other hand, patients also seem to choose group-based weight loss programmes for professional guidance and peer support.18,20 It must, however, be noted that frequent individual counselling for all patients with obesity or other risk factors for NCDs will remain a challenge for health professionals working in PHCs, as both medical18 and dietetic57human resources are inadequate to meet the increasing burden of obesity and NCDs.
One of the most concerning findings among the total group of patients in the present study is the combination of the low level of self-reported physical activity and the time spent watching TV (2 hours per day on average), which was equally poor in both treatment choice groups. Time spent watching TV is often used to gauge the level of sedentary activity.35 Excessive TV viewing (2-4 hours per day) is considered an unhealthy behaviour as it is known to displace formal moderate physical activity and promote the consumption of unhealthy snacks and beverages, increasing the incidence and mortality from DM and CVD.35 The proportion of the sample who were physically inactive was 86%, which is much higher than the national prevalence of inactivity for men (44.7%) and women (47.6%).58 It is also higher than the prevalence of 66.5% found in a study of urban dwellers in Free State Province in South Africa.6Furthermore, the reported 21 minutes per week of physical activity in the total sample is much lower than the 150 (for general health) to 300 minutes per week recommended by the WHO for adults aged 18 to 64 years old, to reduce the risk of NCDs.34 The causes of low physical activity were not assessed in this sample, although other research has indicated that socio-environmental factors such as poor neighbourhood safety, lack of recreational space, and lack of exposure to physical activity education over an individual's lifetime are the primary causes.59
The present study demonstrated that the dietary intake reflects the 'Western' eating patterns that have been associated with an increased risk of developing NCDs.10,60 On average, 8.4 standard portions of fats, high fat foods and energy-dense snacks (combined), 1.3 glasses of sugar-sweetened beverages and approximately five teaspoons of added sugar were typically consumed by our sample per day. Furthermore, refined carbohydrates (10.6 standard portions per day) were consumed more regularly than high-fibre foods (3.1 standard portions per day) and the usual care choice group had a higher intake of refined carbohydrates. The patients in the present study reside in urban communities where there is access to a variety of fast-food restaurants and informal vendors who typically sell foods that are energy-dense and high in fat, salt, sugar and refined carbohydrates. Alcohol intake amounted to approximately half a unit per day, which is in line with recommendations of one unit per day for women and two for men.61 Although moderate alcohol intake has been associated with decreased CVD risk and DM incidence, excessive alcohol intake may increase the risk for high BP.62 It is possible that some patients might have underreported their alcohol intake, which has been found to be a limitation in other South African studies investigating alcohol intake.63
Fruit and vegetable intake was low at 2.2 standard portions per day and falls short of the recommendations made by the 2012 South African food-based dietary guidelines that promote a minimum of five portions per day36 and also the recommendations of the dietary approaches to stop hypertension (DASH) programme that promotes 8 to 10 portions of fruit and vegetables per 8400 kcal.64 Low intakes of fruit and vegetables may increase the burden of disease and reduce survival rates.36 Low intakes in South African populations are not uncommon, with primary school educators in lower socio-economic areas in the Western Cape29 and South Africans in general36 reportedly consuming less than the FBDG recommendation. Intake of low-fat food choices, reflecting healthy lower fat choices over energy-dense, high fat or fried foods, was low at 2.4 standard portions per day. It is known that healthy food choices are affected by their cost, preference and access as well as cultural acceptance, knowledge and perceived control over healthy food choices.53,65 It could therefore be argued that health education may not be sufficient to change purchasing and eating behaviours if the cost of healthy foods continues to be unfavourable, while cheap, unhealthy foods are readily accessible in urban communities. In line with findings from educators in low socio-economic areas in Cape Town,29 our results show that the patients' meal patterns were regular, with infrequent snacking. The latter was more frequent in patients who chose the FBTG intervention, but still below two times per day.
Finally, over and above the presence of a high BMI (obesity), the top three risk factors for NCD development in the total group and in each treatment choice group were inadequate physical activity, low fruit and vegetable intake, and high blood pressure. It is important to note that, if the burden attributable (in percentage) to each of these three risk factors plus being obese in terms of death as reported by Norman et al.66 are summed, the total attributable burden of death from these four risk factors is 22.5%. Our findings are similar to those found in a cross-sectional study of urban dwellers in Free State Province in South Africa that ranked physical inactivity, high BMI, hypertension, smoking and high cholesterol in descending order as the primary risk factors for NCDs in their study sample.7 The mean number of risk factors was close to four in both groups, which was expected as the sample included patients seeking treatment for NCD-related conditions. The significantly higher number of risk factors in the usual care choice group is an interesting observation, especially as it seemed to be as a result of a higher prevalence of smoking and lower proportion of patients achieving five fruit and vegetable portions daily in the usual care group. Jimenez-Garcia et al.67 reported that patients who presented with several risk factors such as smoking, high alcohol intake, physical inactivity and poor diet were more likely to be non-adherent to lifestyle guidelines and have fewer contacts with health professionals. It could be argued that usual care patients were less likely to have changed their lifestyle in the past six months and therefore chose the less intensive usual care option. However, this possibility is not supported by the results of our stages of change assessment, as there were no significant differences between the two treatment choice groups for stages of change. It is important to note that the majority of patients in the total sample were in the contemplative stage, indicating that they were not actively changing unhealthy food choices yet may show intention to change behaviour.68,69
The findings of the present research need to be considered while bearing in mind the limitations of using self-reported data. The comprehensive process followed in the development of the questionnaire, as well as the fact that all interviews were conducted by the same well-trained dietitian addresses some of these concerns. Although content, construct and face validity of the food list included in the FFQ were ensured, validation of the daily frequency of intake of items in the indicator food groups is recommended. A further limitation is the fact that data for biochemical measures, including HbA1c and cholesterol levels, were not complete, reducing the sample size and therefore power to detect differences between treatment choice groups for these variables.
Conclusion
The primary aim of the present research was to describe the characteristics of patients seeking treatment for NCDs and/or risk factors for NCDs. The socio-demographic and health profile of this urbanised sample of obese patients with NCDs (DM or CVD) or risk factors for NCDs shows that treatment-seeking patients attending a district PHC hospital in Cape Town were representative of a middle-aged, low income group comprising mostly coloured women. The most prevalent NCD among this sample was DM, followed by CVD, while the majority of patients suffered from hypertension and over two-thirds had high cholesterol despite the availability of pharmacological treatment. The sample was also characterised by low levels of physical activity and poor food choices that may explain the seemingly poor management of the diseases, as well as the intermediate risk indicators, including obesity. Patients choosing the less intensive usual care may have more NCD risks as they had a higher smoking prevalence, HbA1c, number of NCD risk factors and refined carbohydrate intake, and a lower proportion consumed adequate fruit and vegetables.
The baseline patient profile may aid intervention planners, including the DoH, to ensure the planning of appropriate lifestyle interventions. The results clearly point to the importance of including a strong focus on healthy eating and physical activity options in interventions targeted at patients with NCDs or risk factors for NCDs. The inclusion of specific lifestyle advice for the management of hypertension, hypercholesterolaemia and hyperglycaemia is deemed necessary. It is also important that a behaviour change theory or model should be used in planning and implementing such lifestyle interventions. We recommend that future qualitative research should also investigate the reasons for choosing or declining specific weight loss interventions.
Acknowledgements
We extend sincere gratitude to Henri Carrara from the University of Cape Town for assisting with general statistical support, and all the staff at False Bay Hospital who provided exceptional encouragement and support for this research.
Competing interests
The authors declare that they have no financial or personal relationships that may have inappropriately influenced them in writing this article.
Authors' contributions
K.M. conducted the research under supervision of J.H. and co-supervision of M.S. All authors contributed to the conceptualisation of the study. K.M. was responsible for data collection and statistical analysis, and drafted the manuscript. J.H. and M.S. advised on statistical analyses and interpretation and critically revised various drafts of the manuscript. All authors read and approved the final manuscript.
References
1. Wagner K-H, Brath H. A global view on the development of non-communicable diseases. Prev Med. 2012;54: Suppl:S38-S41. [ Links ]
2. Naghavi M, Forouzanfar M. Burden of non-communicable diseases in sub-Saharan Africa in 1990 and 2010: Global Burden of Diseases, Injuries, and Risk Factors Study 2010. Lancet. 2013;381:S95. [ Links ]
3. Mayosi BM, Flisher AJ, Lalloo UG, et al. The burden of non-communicable diseases in South Africa. Lancet. 2009;374:934-947. [ Links ]
4. Levitt NS, Steyn K, Dave J, et al. Chronic noncommunicable diseases and HIV-AIDS on a collision course: Relevance for health care delivery, particularly in low-resource settings - insights from South Africa. Am J Clin Nutr. 2011;94:1690S-1696S. [ Links ]
5. Hosseinpoor AR, Bergen N, Kunst A, et al. Socioeconomic inequalities in risk factors for non communicable diseases in low-income and middle-income countries: Results from the World Health Survey. BMC Public Health; 2012;12:1-1. [ Links ]
6. van Zyl S, Van der Merwe LJ, Walsh CM, et al. Risk-factor profiles for chronic diseases of lifestyle and metabolic syndrome in an urban and rural setting in South Africa. Afr Prim Health Care Fam Med. 2012;4:1-10. [ Links ]
7. Abrahams Z, McHiza Z, Steyn NP. Diet and mortality rates in Sub-Saharan Africa: stages in the nutrition transition. BMC Public Health. 2011;11:801. [ Links ]
8. Margolis R. Educational differences in healthy behavior changes and adherence among middle-aged Americans. J Health Soc Behav. 2013;54:353-368. [ Links ]
9. Shisana O, Labadarios D, Rehle T, et al. South African National Health and Nutrition Examination Survey (SANHANES-1). Human Science Research Council: Cape Town; 2013. c2013 [cited 16 September 2013]. [ Links ] Available from: http://www.ncbi.nlm.nih.gov/books/NBK53012/?report=printable
10. Ezzati M, Riboli E. Behavioral and dietary risk factors for noncommunicable diseases. N Engl J Med. 2013;369:954-964. [ Links ]
11. Prospective Studies Collaboration, Whitlock G, Lewington S, et al. Body-mass index and cause-specific mortality in 900 000 adults: Collaborative analyses of 57 prospective studies. Lancet. 2009;373:1083-1096. [ Links ]
12. Department of Health. South Africa Demographic and Health Survey 2003. c2003 [cited 6 April 2015]. [ Links ] Available from: http://www.measuredhs.com/pubs/pdf/FR206/FR206.pdf
13. World Health Organization. WHO global action plan for the prevention and control of non-communicable disease 2013-2020. c2013 [cited 9 December 2013]. [ Links ] Available from:http://apps.who.int/iris/bitstream/10665/94384/1/9789241506236_eng.pdf?ua=1
14. World Health Organization. 2008-2013 action plan for the global strategy for the prevention and control of noncommunicable diseases. c2008 [cited 7 April 2014]. [ Links ] Available from:http://www.who.int/nmh/publications/9789241597418/en/
15. Chopra M, Lawn JE, Sanders D, et al. Achieving the health Millennium Development Goals for South Africa: Challenges and priorities. Lancet. 2009;374:1023-1031. [ Links ]
16. Du Plessis J. The chronic dispensing unit. SA Pharmaceutical Journal. 2008;75:46-47. [ Links ]
17. Department of Health. Strategic plan for the prevention and control of non-communicable diseases, 2013-2017. c2012 [cited 10 December 2015]. [ Links ] Available from:http://www.hsrc.ac.za/uploads/pageContent/3893/NCDs%20STRAT%20PLAN%20%20CONTENT%208%20april%20proof.pdf
18. Parker W-A, Steyn NP, Levitt NS, et al. Health promotion services for patients having non-communicable diseases: Feedback from patients and health care providers in Cape Town, South Africa. BMC Public Health. 2012;12:1-10. [ Links ]
19. Department of Health. Chronic disease management policy and implementation strategy. Pretoria: Department of Health; 2009. [ Links ]
20. Hoddinott P, Allan K, Avenell A, et al. Group interventions to improve health outcomes: A framework for their design and delivery. BMC Public Health. 2010;10:800. [ Links ]
21. Steinsbekk A, Rygg L, Lisulo M, et al. Group based diabetes self-management education compared to routine treatment for people with type 2 diabetes mellitus. A systematic review with meta-analysis. BMC Health Serv Res. 2012;12:213. [ Links ]
22. Gallagher R, Armari E, White H, et al. Multi-component weight-loss interventions for people with cardiovascular disease and/or type 2 diabetes mellitus: A systematic review. Eur J Cardiovasc Nurs. 2013;12:320-329. [ Links ]
23. Brown I, Gould J. Decisions about weight management: A synthesis of qualitative studies of obesity. Clin Obes. 2011;1:99-109. [ Links ]
24. de-Graft Aikins A, Boynton P, Atanga LL. Developing effective chronic disease interventions in Africa: Insights from Ghana and Cameroon. Global Health. 2010;6:1-15. [ Links ]
25. Van der Hoeven M, Kruger A, Greeff M. Differences in health care seeking behaviour between rural and urban communities in South Africa. Int J Equity Health. 2012;11:31. [ Links ]
26. Ash S, Reeves M, Bauer J, et al. A randomised control trial comparing lifestyle groups, individual counselling and written information in the management of weight and health outcomes over 12 months. Int J Obes. 2006;30:1557-1564. [ Links ]
27. Samuel-Hodge CD, Johnston LF, Gizlice Z, et al. Randomized trial of a behavioral weight loss intervention for low-income women: The weight wise program. Obesity. 2009;17:1891-1899. [ Links ]
28. Moroshko I, Brennan L, O'Brien P. Predictors of dropout in weight loss interventions: A systematic review of the literature. Obes Rev. 2011;12:912-934. [ Links ]
29. Seme ZB. Formative assessment of teachers of grade four to six learners to advise the development of the teacher focus of a multi-component primary school-based intervention programme for the prevention of non-communicable diseases. Masters dissertation. Cape Town: University of Cape Town; 2013. [ Links ]
30. Department of Health. South African guidelines for healthy eating for adults and children over the age of seven years. c2004 [cited 13 December 2014]. [ Links ] Available from:http://ftp.fao.org/es/esn/nutrition/dietary_guidelines/zaf_eating.pdf
31. World Health Organization. BMI classification. Global database on body mass index. c 2006 [cited 20 September 2014]. [ Links ] Available from: http://apps.who.int/bmi/index.jsp?introPage=intro_3.html
32. WHO Expert Consultation. Waist circumference and waist-hip ratio: Report of a WHO expert consultation. c2008 [cited 5 March 2015]. [ Links ] Available from:http://whqlibdoc.who.int/publications/2011/9789241501491_eng.pdf
33. Klug E, South African Heart Association (S A Heart), Lipid and Atherosclerosis Society of Southern Africa (LASSA). South African dyslipidaemia guideline consensus statement. S Afr Med J. 2012;102:178-187. [ Links ]
34. World Health Organization. Global recommendations on physical activity for health. c 2011 [cited 24 December 2012]. [ Links ] Available from: http://www.who.int/dietphysicalactivity/physical-activity-recommendations-18-64years.pdf
35. Grøntved A, Hu FB. Television viewing and risk of type 2 diabetes, cardiovascular disease, and all-cause mortality: A meta-analysis. JAMA. 2011;305:2448-2455. [ Links ]
36. Naude C. Would an increase in vegetable and fruit intake help to reduce the burden of nutrition-related disease in South Africa? An umbrella review of the evidence. S Afr J Clin Nutr. 2013;26:104-114. [ Links ]
37. Rollnick S, Heather N, Gold R, Hall W. Development of a short 'readiness to change' questionnaire for use in brief, opportunistic interventions among excessive drinkers. Addiction. 1992;87:743-754. [ Links ]
38. Heather N, Rollnick S, Bell A. Predictive validity of the readiness to change questionnaire. Addiction. 1993;88:1667-1677. [ Links ]
39. Amod A, Motala A, Levitt N, et al. The 2012 SEMDSA guideline for the management of Type 2 diabetes. JEMDSA. 2012;17 Suppl 1:S1-S94. [ Links ]
40. Seedat YK, Rayner BL, Southern African Hypertension Society. South African hypertension guideline 2011. S Afr Med J. 2012;102:57-83. [ Links ]
41. De-Graft Aikins A, Pitchforth E, Allotey P, et al. Culture, ethnicity and chronic conditions: Reframing concepts and methods for research, interventions and policy in low- and middle-income countries. Ethn Health. 2012;17:551-561. [ Links ]
42. Gray CM, Anderson AS, Clarke AM, et al. Addressing male obesity: An evaluation of a group-based weight management intervention for Scottish men. JMH. 2009;6:70-81. [ Links ]
43. Gregory CO, Blanck HM, Gillespie C, et al. Perceived health risk of excess body weight among overweight and obese men and women: differences by sex. Prev Med. 2008;47:46-52. [ Links ]
44. Poobalan AS, Aucott LS, Precious E, et al. Weight loss interventions in young people (18 to 25 year olds): A systematic review. Obes Rev. 2010;11:580-592. [ Links ]
45. Davidson EM, Liu JJ, Bhopal RS, et al. Consideration of ethnicity in guidelines and systematic reviews promoting lifestyle interventions: A thematic analysis. Eur J Public Health. 2013;24:508-513. [ Links ]
46. Puoane T, Fourié J, Shapiro M, et al. 'Big is beautiful' - an exploration with urban black community health workers in a South African township. S Afr J Clin Nutr. 2005;18:6-15. [ Links ]
47. Duncan PR, Howe LD, Manukusa Z, et al. Determinants of obesity and perception of weight in hypertensive patients in rural South Africa. S Afr J Clin Nutr. 2014;27:56-62. [ Links ]
48. Noia J, Furst G, Park K, et al. Designing culturally sensitive dietary interventions for African Americans: Review and recommendations. Nutr Rev. 2013;71:224-238. [ Links ]
49. Shankar A, McMunn A, Steptoe A. Health-related behaviors in older adults relationships with socioeconomic status. Am J Prev Med. 2010;38:39-46. [ Links ]
50. LaRowe TL, Piper ME, Schlam TR, et al. Obesity and smoking: Comparing cessation treatment seekers with the general smoking population. Obesity. 2009;17:1301-1305. [ Links ]
51. Braveman P, Egerter S, Williams DR. The social determinants of health: Coming of age. Annu Rev Public Health. 2011;32:381-398. [ Links ]
52. StatsSA. South African census 2011. c2011 [cited 13 March 2013]. [ Links ] Available from:http://www.statssa.gov.za/publications/P03014/P030142011.pdf (2011).
53. Temple NJ, Steyn NP. The cost of a healthy diet: A South African perspective. Nutrition. 2011;27:505-508. [ Links ]
54. Seagle HM, Strain GW, Makris A, et al. Position of the American Dietetic Association: Weight management. J Am Diet Assoc. 2009;109:330-346. [ Links ]
55. Wing RR, Lang W, Wadden TA, et al. Benefits of modest weight loss in improving cardiovascular risk factors in overweight and obese individuals with type 2 diabetes. Diabetes Care. 2011;34:1481-1486. [ Links ]
56. Van Gaal LF, Mertens IL. What is the relationship between risk factor reduction and degree of weight loss? Eur Heart J. 2005;7:21-26. [ Links ]
57. Goeiman H, Labadarios D, Steyn NP. Who is the nutrition workforce in the Western Cape? S Afr J Clin Nutr. 2011;24:90-98. [ Links ]
58. Guthold R, Ono T, Strong KL, et al. Worldwide variability in physical inactivity: A 51-country survey. Am J Prev Med. 2008;34:486-494. [ Links ]
59. Peltzer K, Phaswana-Mafuya N. Physical inactivity and associated factors in older adults in South Africa. AJPHERD. 2012;18:447-460. [ Links ]
60. Popkin BM, Adair LS, Ng SW. Global nutrition transition and the pandemic of obesity in developing countries. Nutr Rev. 2012;70:3-21. [ Links ]
61. US Department of Agriculture, US Department of Health and Human Services. Dietary guidelines for Americans. c2011 [cited 12 May 2015]. [ Links ] Available from:http://www.health.gov/dietaryguidelines/dga2010/dietaryguidelines2010.pdf
62. Rubin E. To drink or not to drink: That is the question. Alcohol Clin Exp Res. 2015;38:2889-92. [ Links ]
63. Phaswana-Mafuya N, Peltzer K, Chirinda W, et al. Sociodemographic predictors of multiple non-communicable disease risk factors among older adults in South Africa. Global Health Action. 2013;6:20680. [ Links ]
64. Lichtenstein AH, Appel LJ, Brands M, et al. Diet and lifestyle recommendations revision 2006: A scientific statement from the American Heart Association Nutrition Committee. Circulation. 2006;114:82-96. [ Links ]
65. Lawrence W, Skinner C, Haslam C, et al. Why women of lower educational attainment struggle to make healthier food choices: The importance of psychological and social factors. Psychol Health. 2009;24:1003-1020. [ Links ]
66. Norman R, Bradshaw D, Schneider M, et al. A comparative risk assessment for South Africa in 2000: towards promoting health and preventing disease. S Afr Med J. 2007;97:637-641. [ Links ]
67. Jiménez-García R, Esteban-Hernández J, Hernández-Barrera V, et al. Clustering of unhealthy lifestyle behaviors is associated with nonadherence to clinical preventive recommendations among adults with diabetes. J Diabetes Complicat. 2011;25:107-113. [ Links ]
68. Young M. Behaviour change and motivational interviewing in the patient with diabetes. JEMDSA. 2010;15:45-47. [ Links ]
69. Sutton K, Logue E, Jarjoura D, et al. Assessing dietary and exercise stage of change to optimize weight loss interventions. Obes Res. 2003;11:641-652. [ Links ]
 Correspondence:
Janetta Harbron
janetta.harbron@uct.ac.za
Received: 03 July 2015
Accepted: 14 Jan. 2016
Published: 10 June 2016

